Article Text

Statistics from Altmetric.com
Current guidelines recommend aortic valve replacement in patients with severe symptomatic aortic stenosis (AS). However, symptom onset often is insidious so that some patients attribute their declining exercise capacity to normal aging rather than to valve obstruction. Furthermore, AS is a progressive disease; patients with severe obstruction who are currently asymptomatic will soon transition to overt symptoms. The Editor's Choice in this issue of Heart is an original research article by Dr Capoulade and colleagues (see page 1606) who hypothesized that asymptomatic AS patients at risk of imminent symptom onset could be identified by the combination of resting and exercise serum B-type natriuretic peptide (BNP) levels. In a prospective study of 211 asymptomatic AS patients followed for a mean of 1.8±1.3 years, there were 7 deaths and 97 aortic valve replacements. Both resting and exercise BNP were predictive of event free survival with the combination of both providing incremental prognostic value (figure 1).

Comparison of the event-free survival curves for median peak-exercise B-type natriuretic peptide (BNP) level in the subsets of patients with high and low resting BNP level in patients with severe aortic stenosis (n=157). This figure shows the event-free survival curves for the composite end-point of death or aortic valve replacement in the subsets of patients with low versus high resting BNP level (red vs blue curves, respectively), according to low versus high peak-exercise BNP (full vs dotted lines, respectively). The symbols indicate the significant difference between groups: *p<0.05 versus ‘Low resting—Low peak-exercise BNP level’; ¶p<0.05 versus ‘Low resting—High peak-exercise BNP level’; §p<0.05 versus ‘High resting—Low peak-exercise BNP level’. The numbers at the bottom of the graph represent the number of patients at risk at each follow-up year. The p value is that of the log-rank test.
In the accompanying editorial, Dr. Lindman notes that AS severity itself is also a predictor of symptom onset and that current indications for aortic valve replacement in asymptomatic patients include very severe AS or predictors of rapid progression, including measurement of resting BNP levels in the European guidelines. The current study supports those recommendation and, as Dr. Lindman states: “Perhaps a higher exercise BNP integrates the various stresses on the heart in patients with AS and identifies a patient whose heart is closer to the point of being unable to compensate for them”. However, it is not clear whether we need to measure exercise BNP in all our AS patients. “As the number of patients with AS grows and treatment options expand, developing better ways to risk-stratify patients will become increasingly important to determine optimal timing for valve replacement, the best procedural approach (surgical or transcatheter), and whether valve replacement is potentially futile”.
Implementation of clinical guidelines in daily practice is challenging as illustrated in an important paper in this issue of Heart. Appropriate antithrombotic therapy in patients with atrial fibrillation was evaluated in 7243 patients in the PREvention oF thromboembolic events–European Registry in Atrial Fibrillation (PREFER in AF) (see page 1625). Concurrent oral anticoagulation (OAC) and antiplatelet therapy (AP) is associated with an increased risk of bleeding and is generally discouraged except in patients with an acute coronary syndrome or recent coronary stent implantation. Even so, 10.9% of patients in this registry were receiving combined OAC and AP therapy, with neither of these indications. Compared to patients treated with either OAC or AP alone, combination therapy was more often prescribed in patients with diabetes, dyslipidemia, coronary artery or peripheral vascular disease. However 96.3% of those on dual AP+OAC mediations did not have an accepted indication for this combination therapy.
Dr. Brandes puts these findings in perspective in his editorial (see page 1565) by pointing out that there are “a number of gaps and barriers impeding optimal care of AF patients including uncertainty of the definition of AF, its pathophysiology and knowledge gaps across the care continuum including screening, diagnosis and treatment”. He also suggests that multiple guidelines written by groups focused on various aspects of the same disease are confusing; coordination of efforts by different guideline writing committees would result in more consistent recommendations. Finally, we need a stronger evidence base for management of AF and concurrent coronary disease: “The uncertainty especially about the duration of combined therapy might also be due to the fact that the respective guideline recommendations are largely based on expert consensus rather than evidence from a number of clinical trials”.
Another very interesting article addresses the issue of how genetic data might be integrated with clinical factors in estimating risk for coronary disease events. Dr Labos and colleagues (see page 1620) evaluated a genetic risk score (GRS) in 460 patients with a first acute coronary syndrome event. The GRS was based on 30 single nucleotide polymorphisms previously associated in genome wide studies with a higher risk or coronary disease. After multivariable adjustment, a 1 SD increment in GRS was associated with a 1.0 (95% CI 0.1 to 2.0) year earlier age of first ACS. However, traditional clinical risk factors remained even stronger predictors of outcome including male sex (6.9 years earlier (95% CI 4.1 to 9.7)), current cigarette smoking (8.1 years (95% CI 6.1 to 10.0)), overweight (Body Mass Index, BMI >25), and obesity (BMI>30) (5.2 years (95% CI 2.6 to 7.9)). (figure 2)

Association of risk factors and Genetic Risk Score (GRS) with age at first ACS. *Difference in mean age for presence of risk factor as compared with absence. For BMI, the reference category was BMI <25. The GRS is presented per SD increase. Negative values indicate earlier mean age at first ACS. All p values <0.05. ASA, acetylsalicylic acid; HTN, hypertension; BMI, Body Mass Index; HRT, hormone replacement therapy; ACS, acute coronary syndrome.
In an Editorial, Drs. Priest and Ashley (see page 1569) point out that the GRS in this study “included variants within genes such as LPA, APOA5, LDLR, and PCSK9 which drive traditional risk factors such as lipid levels and composition, however the GRS also included genes such as TCF21 which plays a role in endothelial biology”. They suggest that incorporating genetic markers not measured directly by clinical risk factors, such as endothelial and smooth muscle cell pathobiology, adds to the predictive power for clinical risk of coronary events. How might genetic risk scores impact clinical practice? Drs Priest and Ashley propose that we will need to provide integrated care with clinical practitioners and genetic counselors working together to focus primary prevention towards patients at highest risk of cardiac events. However, they caution that “we know what genomics is today, but know not what it may be in the future. The wealth of useful data produced by the field of genomics leads us to consider other types of comprehensive “omics” datasets such as transcriptomics, proteomics, and metabolomics which show extraordinary potential for informing the diagnosis and treatment of human disease”.
Also in this issue, you will find the final two review articles in our series on Aortic Disease including one on surgical management in patients with Marfan Disease by Professor Treasure and colleagues (see page 1571) and another on surgical management of thoracoabdominal aneurysms by Professors Ziganshin and Eleferiades (see page 1577). These are both excellent concise reviews of increasingly prevalent clinical problems.
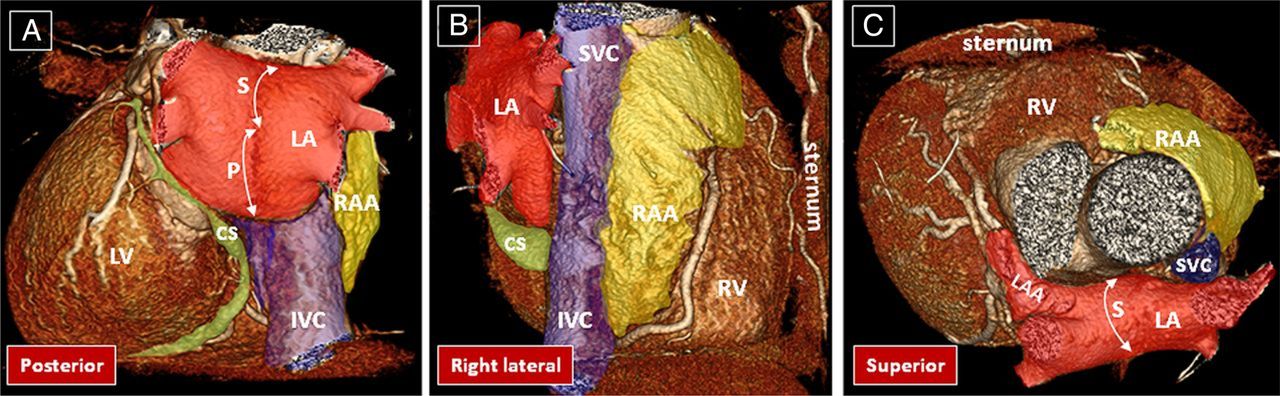
The Education in Heart article by Dr. Cabrera and colleagues (see page 1636) presents an overview of the anatomy and imaging landmarks of the left atrial appendage as related to percutaneous catheter closure with outstanding illustrations (figure 3).

Spatial relationship of the atrial structures as they lie in the body. Posterior, right lateral, and superior view of volume rendered CT angiographies are shown. The left atrium (LA in red) is located superior and posterior to the right atrium. Its superior (S) and posterior (P) walls are shown by double-headed arrows. The right atrial appendage (RAA) is shown in yellow and the venous component of the right atrium in blue. The coronary sinus (CS) tributaries are shown in green. IVC, inferior vena cava; LAA, left atrial appendage; LV, left ventricle; RV, right ventricle; SVC, superior vena cava.
Remember to check out the Image Challenge (see page 1619) to see an interesting finding on coronary angiography in a patient presenting with chest pain. The entire Image Challenge collection can be accessed online from the Image Challenge box on the Heart homepage.
Linked Articles
- Review
- Editorial
- Image challenge
- Education in Heart
- Valvular heart disease
- Review
- Arrhythmias and sudden death
- Cardiac risk factors and prevention
- Editorial