Article Text

Statistics from Altmetric.com
We now easily can do genetic testing for specific inherited conditions in our patients; indeed, sequencing of the whole genome is possible. Yet, even with inherited conditions due to changes in a single gene, such as the FBN1 gene in Marfan syndrome, there is considerable variation in the specific mutation in each patient. Presumably, resultant differences in the abnormal fibrillin-1 protein translate into differences in clinical disease manifestations. A better understanding of the genotype–phenotype relationships in Marfan syndrome might be useful in identifying which patients require more frequent diagnostic evaluation or earlier intervention to prevent adverse consequences of the underlying inherited condition.
In this issue of Heart, Franken and colleagues1 classified FBN1 mutations in 290 Marfan patients as either ‘dominant-negative’ (61%) if the mutated and non-mutated fibrillin-1 proteins both were incorporated into the extracellular matrix or as ‘haplo-insufficient’ (39%) if there was a decreased total amount of fibrillin-1 with only the non-mutated protein incorporated into tissue. Compared with patients with a dominant-negative mutation, those with haplo-insufficiency had larger aortic root diameters at baseline, a faster rate of aortic dilation and an increased risk of the combined endpoint of aortic dissection and death (HR: 3.3, 95% CI 1.0 to 11.4, p=0.060).
In an accompanying editorial, Landis, Veldtman and Ware2 summarise the pathogenesis of Marfan syndrome and discuss how this new research adds to our understanding of this condition (figure 1). They conclude: “The study detects an aortic phenotype difference based on FBN1 mutation classifications and stands as an example of the increasingly powerful capability to stratify patients based on individualised genetic testing results. Thus, the study shows the potential value of genotyping all patients with Marfan syndrome and consideration of the role of allelic heterogeneity in management. In addition, the study highlights the value of large volume centres specialised in genetic and cardiac management of aortopathy to analyse robustly phenotyped cohorts and propel clinical practice forward.”

Genetics and pathogenesis in Marfan syndrome. A schematic overview of the effect of haploinsufficiency (HI) or dominant negative (DN) mutations is shown. The most common type of mutations that lead to HI or DN effect are listed. However, these classifications are not absolute, and the precise effect of a specific DNA mutation must be determined at the protein level. Mutations that cause HI result in less protein because only the normal, non-mutated FBN1 allele generates protein products. In contrast, a combination of normal protein products (fibrillin-1) generated by the non-mutated FBN1 allele and stable abnormal protein products generated by the DN allele are seen with DN mutations. The green circle in the fibrillin-1 protein represents the altered amino acid residue. Normal microfibrils are associated with latency associated peptides (LAP; red circles), which bind TGFβ in a biologically inactive complex in combination with latent TGFβ binding protein (LTBP1; blue oval). When microfibrils are reduced due to HI, interaction with matrix fibres is disrupted, and increases in activated TGFβ are seen due to a reduced number of microfibrils. DN mutations can have a range of effects depending on the specific mutation. Shown here, a DN mutation results in abnormalities in fibrillin-1 protein folding and increased activated TGFβ. TGFβ, transforming growth factor beta.
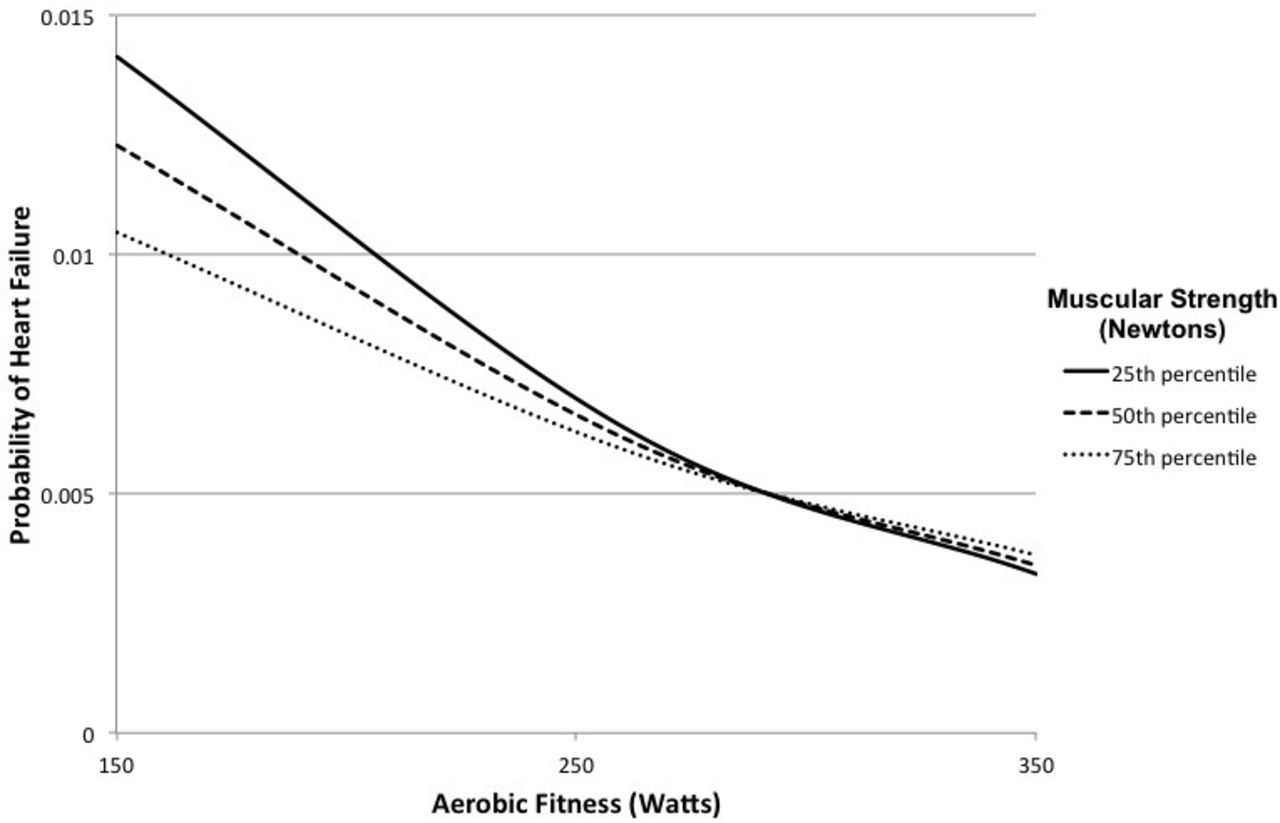
The risk of developing heart failure later in life is associated with health behaviours in young adulthood. In order to examine the interaction of physical fitness and obesity with risk of heart failure, Crump and colleagues3 looked at the association between baseline factors and subsequent heart failure in a cohort 1.3 million Swedish military conscripts, which includes 97–98% of all 18-year-old men in Sweden, with follow-up data to age 47–62 years. Baseline aerobic fitness, muscle strength and body mass index at age 18 years were independently associated with a higher risk of long-term heart failure, even when adjusted for potential confounding factors. Those in the lowest tertile of aerobic fitness and muscular strength had a 1.7× increased risk of heart failure compared to the high tertile, corresponding to incident rates per 100,000 person-years of 43.2 versus 10.8 with a significant interaction between aerobic fitness and muscular strength (figure 2).

Probability of developing heart failure by aerobic fitness and muscular strength at the age of 18 years (median attained age 47 years, maximum 62 years), adjusted for height, weight and other covariates.
In an editorial, Schmidt4 suggests: “If causal, these findings imply that improvements in aerobic fitness have the greatest primary prevention potential among persons with low muscular strength. Vice versa, improvements in muscular strength have the largest impact on heart failure prevention in those with low aerobic fitness. The take-home message for patient counselling is that preventive interventions for heart failure should begin early in life and include weight control and aerobic fitness and muscular strength, even among non-obese persons.”
Another interesting paper in this issue examines the effect of Fontan geometry on exercise capacity.5 Cardiac magnetic resonance (CMR) images at peak exercise allowed both visualisation of Fontan anatomy and quantitation of flow rates with computational simulations performed to measure indexed power loss. This data suggests that eliminating vessel narrowing in total caval pulmonary connections will reduce power loss and result in improved exercise capacity (figure 3). This study also illustrates how advanced imaging modalities can provide detailed pathophysiological data which may lead to improved patient outcomes, even when small numbers of patients are studied.

Patient anatomies with streamtraces colour-coded by velocity magnitude. The number underneath each figure presents TCPC power loss. The patient is ordered with an ascending TCPC power loss. TCPC, total cavapulmonary connections.
The Education in Heart article in this issue summarises the indications, approach to and potential complications of trans-septal heart catheterisation.6 This approach is increasingly utilised for complex mitral valve interventions as well as in the electrophysiology laboratory. Photographs and schematic diagrams provide a step-by-step approach that will guide both novices and experts in optimising their clinical skills.
The Image Challenge question is based on a pulsed and continuous wave Doppler tracing in a young woman with pulmonic valve stenosis.7 This one will test your knowledge of cardiovascular pathophysiology!
Footnotes
Competing interests None declared.
Provenance and peer review Commissioned; internally peer reviewed.