Article Text

Statistics from Altmetric.com
The 2016 National Institute for Health and Care Excellence (NICE) guidelines for the assessment of suspected stable angina recommend diagnosis with computed tomographic coronary angiography (CTCA), but this approach remains controversial. In a study in this issue of Heart,1 the key to optimal use of CTCA appears to be careful patient selection. Specifically, CTCA is most useful in patients with symptoms consistent with possible angina defined as meeting two or three of the following characteristics: constricting discomfort in the front of the chest, neck, shoulders, jaw, or arms; precipitated by physical exertion; and relieved by rest or nitroglycerin within about 5 min. Possible angina also includes patients with non-anginal chest pain who have an abnormal resting ECG.
In a post-hoc analysis of the Scottish COmputed Tomography of the HEART (SCOT-HEART) trial, diagnostic certainty with CTCA was increased most in those with possible angina (relative risk (RR) 2.22 (95% CI 1.91 to 2.60), P<0.001) than in those with non-anginal symptoms (RR 1.30 (1.11 to 1.53), P=0.002). In the possible angina subjects, the overall rate of coronary angiography was unchanged, but there were fewer normal coronary angiograms. Further, fatal or non-fatal myocardial infarction was reduced in patients with possible angina at 3.2 years of follow-up, (3.2% to 1.9%; HR 0.58 (0.34 to 0.99), P=0.045). No benefit was seen in patients with non-anginal chest pain and a normal resting ECG (figure 1).

Cumulative event curves for fatal and non-fatal myocardial infarction in the possible angina (solid lines) and non-anginal (dashed lines) cohorts in patients assigned to standard care (blue) and standard care plus CTCA (red). CTCA, CT coronary angiography.
In an editorial, Budoff2 highlights the benefits of CTCA over functional testing for diagnosis of stable coronary artery disease (CAD) and reduction of incident myocardial infarction in patients with possible angina. His three key points are: (1) CTCA is more accurate for diagnosis of CAD, (2) CTCA does not lead to increased rates of coronary angiography with careful patient selection, and (3) with CTCA as the initial test, fewer patients who do undergo coronary angiography are found to have normal coronary arteries. He goes on to argue that diagnosis of non-obstructive CAD is an even more important advantage of CTCA. “Non-obstructive CAD identifies additional at-risk patients, translating into better prognostic and discriminatory information provided by CTCA compared with functional testing.”
The importance of patient selection in the use of CTCA may explain the findings in the meta-analysis by Gongora and colleagues3 which combined data from 10 trials with 6285 subjects undergoing CTCA compared with physiologic testing for acute chest pain. Subjects in this meta-analysis presented to an emergency department with acute chest pain symptoms and thus have a different pre-test likelihood of coronary disease compared with those with chronic symptoms. In those with acute chest pain, there were no differences between CTCA and physiologic testing for all-cause mortality or major adverse cardiac events; however, CTCA was associated with higher rates of coronary angiography and higher rates of re-vascularisation (figure 2). Perhaps, better patient selection in those with acute chest pain would show different results.

Coronary revascularisation with coronary CT angiography (CCTA) compared with other standard-of-care (SOC) approaches in patients with acute chest pain. The size of central markers reflects the weight of each study.
The optimal definition of severe aortic stenosis (AS) has been questioned, especially in patients with low transaortic volume flow rates. Accurate diagnosis is essential given that aortic valve replacement (AVR) reduces symptoms and prolongs life only when symptoms are due to severe AS. In a study of patients with isolated AS and a normal left ventricular ejection fraction, Mehrota and colleagues4 found similar outcomes in patients with an aortic valve area (AVA) <0.8 cm2 and those with an AVA of 0.8–0.99 cm2, regardless of whether patients had high-gradient or low-flow low-gradient AS. The sensitivity for the combined endpoint of death from any cause or AVR within 3 years was only 61% for an AVA <0.8 cm2 compared with 91% for an AVA <1.0 cm2, supporting this cut-off value in current guidelines (figure 3).
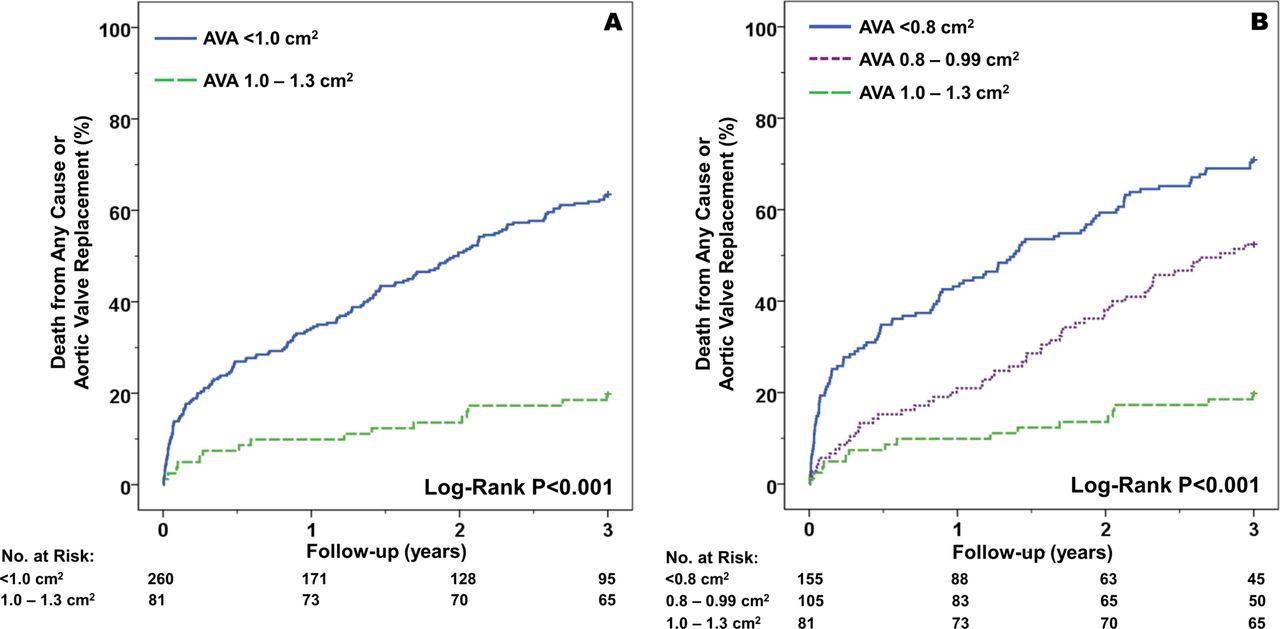
Time-to-event curves for the entire AS cohort according to current valvular heart disease guideline cut-off of ≤1.0 cm2 for severe AS (A) and by AVA group (B). AS, aortic stenosis; AVA, aortic valve area.
In an editorial, Pislaru and Pellikka5 remind us that AS severity is only the starting point in the assessment of patients with AS; other factors including symptoms, left ventricular function, comorbidities, the risk of intervention, and likely outcomes all are important. “To be systematic in our thinking, we create rigorous patterns and cut-off values for all diseases. While that is essential for practising medicine, we must resist our inclination to become fascinated with numbers. Diseases, including AS, are a continuum rather than a step-like process” (figure 4).

The continuum of disease versus the fascination with numbers. Disease progression is a continuous process. We must not let our fascination with cut-off numbers get us into thinking in a stepwise mode. AS, aortic stenosis.
The idea that we should ‘treat the patient, not the numbers’ is further discussed in my commentary on AS severity.6 “Many of us have dedicated years of our lives to the elusive search for a number that defines ‘severe’ AS, eventually coming to the realisation that there is no single simple number. Instead, there is a dynamic interaction between the dysfunctional valve tissue, left ventricle and systemic vasculature with changing pressure-flow relationships over the patient’s lifetime and even during normal daily activities” (figure 5). “Diagnosis and management of AS is straightforward in the otherwise healthy patient with isolated high gradient severe AS. However, we increasingly face the dilemma of an elderly patient with multiple comorbidities in whom there are many potential causes of symptoms. Thus, the challenge today goes beyond simply measuring AS severity, we need to determine whether symptoms are due to AS, and thus likely to improve after AVR.”

Schematic diagram of the relationship between aortic maximum velocity and aortic valve area in adults with valvular aortic stenosis (AS). Curves are shown for three different hypothetical transaortic flow rates. The grey bar indicates the definition of severe AS as a velocity of 4 m/s or higher, recognising that this is a reference value, not a rigid precise break point. The yellow box shows the range of mild to moderate AS, the pink box shows high gradient severe AS. The blue rectangle highlights the group of patients with a valve area between 0.8 and 1.0 cm2, some of whom have high gradient AS (above grey bar) and some of whom have low gradient AS with a small valve area.
The Education in Heart article in this issue discusses the role of echocardiography in the diagnosis and management of hypertrophic cardiomyopathy.7 The Image Challenge question8 shows a computed tomographic image of the aorta with an interesting choice of answers and details about how to differentiate these diagnoses by the combination of clinical history and imaging findings.
Footnotes
Competing interests None declared.
Provenance and peer review Commissioned; internally peer reviewed.