Article Text

Abstract
Objective We aimed to explore whether age, period or cohort effects explain the trends and inequalities in ischaemic heart disease (IHD) and cerebrovascular disease (CeVD) mortality in Scotland.
Methods We analysed IHD and CeVD deaths for 1974–2015 by sex, age and area deprivation, visually explored the data using heatmaps and dotplots and built regression models.
Results CeVD mortality improved steadily over time while IHD mortality improved more rapidly from the late 1980s. Age effects were evident; both outcomes showed an exponential relationship with age for all except males for IHD in the 1980s and 1990s. The mortality profiles by age became older, although improvement was slower for those aged <50 years for IHD, especially for males, and faster for CeVD in females aged <65 years. Rates were higher, and inequalities greater, among males, especially for IHD. For IHD, increased risk for males over females reduced with age (incidence rate ratio for 41–50 year old males=4.28 (95% CI 4.12 to 4.44) and 1.17 (95% CI 1.16 to 1.18) for 71–80 year olds). Inequalities in IHD mortality by area deprivation persisted over time, increasing from around 10% to around 25% higher risk in the most deprived areas between 1974 and 1986 before declining in absolute terms from around 2000. Inequalities for CeVD increased after the late 1980s.
Conclusions IHD and CeVD mortality in Scotland exhibit age but not recent distinct period or cohort effects. The improvements in mortality rates have been more sustained for CeVD and inequalities greater for IHD.
- Heart Disease
- Stroke
- Epidemiology
This is an open access article distributed in accordance with the Creative Commons Attribution Non Commercial (CC BY-NC 4.0) license, which permits others to distribute, remix, adapt, build upon this work non-commercially, and license their derivative works on different terms, provided the original work is properly cited, appropriate credit is given, any changes made indicated, and the use is non-commercial. See: http://creativecommons.org/licenses/by-nc/4.0/.
Statistics from Altmetric.com
Introduction
Ischaemic heart disease (IHD) and cerebrovascular disease (CeVD) have among the highest cause-specific mortality rates in Scotland and substantially contribute to Scotland’s burden of disease.1 Mortality rates for IHD have, however, been rapidly and consistently declining for both males and females aged 15–74 years of age since the 1980s, and for CeVD for the last 60 years.2 The relative decline in the rates of death has been greater for females than males between 1980–1982 and 2016.3 Both IHD and CeVD mortality display marked inequalities by deprivation, with higher rates with increasing area deprivation.4 5 While mortality rates have fallen across the deprivation spectrum recently for both, IHD rates have decreased more in the most deprived areas reducing the absolute inequalities. However, in relative terms inequalities in IHD and CeVD have continued to increase.6
High levels of mortality from IHD, CeVD and cancer throughout adulthood together with increased mortality from alcohol-related and drug-related deaths, suicide and violence explain Scotland’s ‘excess’ mortality (ie, over and above that explained by deprivation) compared with England & Wales (E&W).7 These health outcomes have also contributed to Scotland’s slower improvement in mortality and greater health inequalities compared with the rest of Western Europe.8–10 A greater vulnerability to economic and social changes resulting from political changes of the 1980s has been proposed to best explain these mortality trends.7
Using age, period, cohort (APC) analyses we have shown that age-period effects help explain recent trends in alcohol-related deaths11 and that cohort effects explain trends in suicide and drug-related deaths, especially among young males in deprived areas.12 13 These effects are consistent with the proposed hypothesis to explain Scotland’s ‘excess' mortality. Given the importance of IHD and CeVD in the relatively high mortality rates in Scotland we wanted to explore whether there is also evidence for APC effects for these causes in the overall Scottish trends that could correspond to the changing political context from the 1980s and whether APC effects might explain some of their inequality trends.
Methods
Data sources
Data on the number of deaths due to IHD and CeVD by sex, single year of age at death and year of registration of death for Scotland from 1974 to 2015, and mid-year population estimates for Scotland by sex and single year of age, from age 0 to 89 years (with pooled data for ages 90+), from 1974 to 2015, were obtained from the National Records of Scotland (NRS). IHD deaths (n=5 97 850) from 1974 to 1978 were coded by International Classification of Diseases 8 (ICD8) 410–414, from 1979 to 1999 by ICD9 410–414, and from 2000 onward by ICD10 I20–25. CeVD deaths (n=3 05 542) from 1974 to 1978 were coded by ICD8 430–438, from 1979 to 1999 by ICD9 430–438 and from 2000 onward by ICD10 I60–69 and G45.
Analyses by deprivation were based on Carstairs area deprivation scores14 which are available around each census year (1981 and every 10 years thereafter). Carstairs look-up files were obtained from Information Services Division Scotland (ISD) and each death was assigned to a deprivation category using the nearest census. Deaths with missing deprivation data (2.8% and 2.3% of IHD and CeVD datasets respectively) were removed from deprivation analyses. Population data by Carstairs, from age 0 to 84 years (with pooled data for ages 85+), were obtained from ISD with interpolation between the censuses. IHD and CeVD cases are rare in those aged <15 years, and the denominator populations were less certain for those aged 90+ years so, unless stated otherwise, analyses were restricted to those aged 15–89 years, or aged 15–84 years for deprivation analysis. Data manipulation was performed using IBM SPSS Statistics V.19 and Microsoft Excel 2013.
Descriptive analysis
For trend analysis, death rates for all ages from 1974 to 2015 by sex were age-standardised using direct age standardisation and the 2013 version of the European Standard Population as the standard population. For age effects analysis, data from 1974 to 1994 and data from 1995 to 2015 were separately combined for presentation of crude death rates by 5-year age groups (from 0-4 years to 90+ years (85+ years for deprivation analysis) for age at death by sex.
Two methods were used to support visual exploration of how cause-specific mortality rates have changed at different ages and over time: heatmaps of rates by age and year; and coloured dotplots plotting rates against age for each of the years. These were produced in R. For the heatmaps (Lexis surfaces)15 one axis was single year of age and the other single year of death (see appendix 1 in Parkinson et al 12). The colours of the squares making up the heatmap were determined by the size of the (base10) logarithm of the mortality rate for each specific combination of age and year; squares of the same colour indicate the same mortality rates. The coloured dotplots show mortality rate for a single age and year of death on the vertical axis (with a log10 scale) against age on the horizontal axis; the colours of dots indicate the year of death. A continuity correction of 0.5 was added to both the numerator and denominator before rates based on five or fewer observations were excluded due to unreliability.
We undertook an initial analysis by deprivation comparing areas ranked by deprivation quintiles and thereafter, for ease of presentation and unless noted otherwise, compared areas ranked in the 40% most deprived areas to the 40% least deprived areas.
Statistical analysis
Visual exploration of the data revealed a relatively continuous trend in age-specific mortality improvement for CeVD, a more discontinuous trend for IHD, and some sex and deprivation group differences. Intrinsic estimator models using the IE command in Stata (as described in Parkinson et al 12 13 and online supplementary appendix 1) were used to explore whether any clear APC effects were evident and did not identify any clear effects other than age effect (online supplementary appendix 1). Multivariable binomial regression models were therefore used to model these patterns and control for sex and deprivation (online supplementary appendix 2). The Carstairs deprivation variable was categorised as the most deprived 40%, central 20% and least deprived 40% of areas. The command margins, predict (ir) in Stata V.14.2 was used to provide predictions for the mortality rate assuming all other independent variables were at mean values. This provides a measure of difference (with a p value) for a variable such as sex, which takes into account the variable’s interaction with other variables. Predicted rates (based on the fully-adjusted models in online supplementary appendix 2) also take into account interactions between the variables and supplement descriptive analyses.
Supplemental material
Supplemental material
Patient and public involvement statement
Neither patients nor the public were involved in the design, or conduct, or reporting, or dissemination of our research.
Results
Age-period-cohort analysis
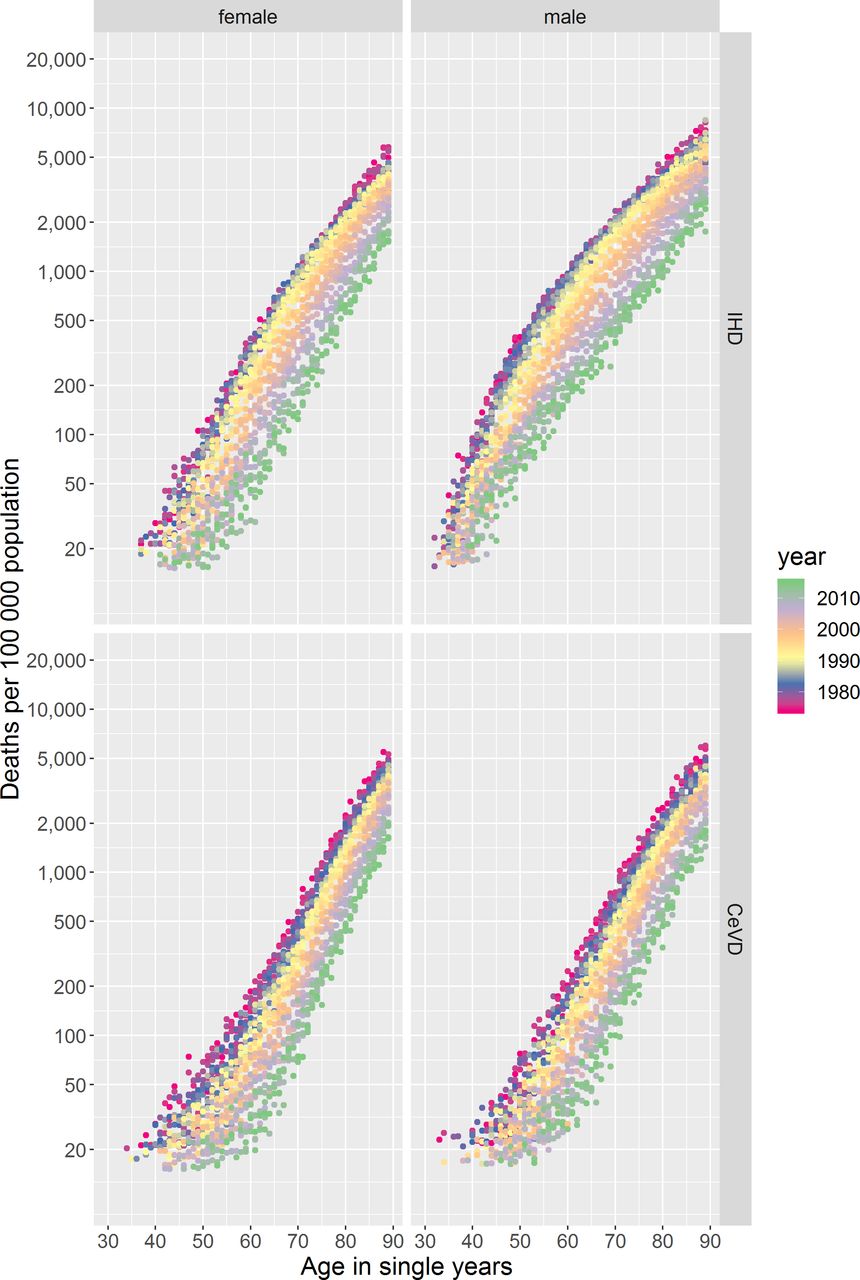
IHD and CeVD mortality rates differ by age, an age effect, with very few deaths occurring among those aged <40 years in both sexes for CeVD and for females for IHD and among those aged <30 years for males for IHD (figure 1). Above these ages mortality rates increase broadly exponentially with age, for all except males for IHD in the 1980s/‘90s (discussed below), seen as ‘diagonal straight lines’ for any given year in the coloured dotplots (figure 2).

Heatmap plot of log (base10) age–year specific crude mortality rates per 100 000 population in Scotland for each single age from 15 to 89 years and each year from 1974 to 2015 stratified by sex for IHD and CeVD. CeVD, cerebrovascular disease; IHD, ischaemic heart disease.

Coloured dotplot of mortality rate per 100 000 population in Scotland by age for those aged 30 to 89 years, from 1974 to 2015, stratified by sex for IHD and CeVD. CeVD, cerebrovascular disease; IHD, ischaemic heart disease.
There is a known cohort effect for those born around 1918, especially for IHD (online supplementary figure 1).15 The absence of other vertical patterns and diagonal ‘disruptions’ running from bottom left to top right in figure 1 indicate that simple cohort and period effects do not explain the trends observed. Confirmed by the Intrinsic Estimator models which only identified clear age effects (online supplementary appendix 1).
Supplemental material
Trends in mortality by age
The age profiles of death from IHD and CeVD have become older over the period for both sexes (figure 1 and online supplementary figure 2), evidenced in the coloured dotplot by the dots for more recent years tending to be below those for the same age in previous years, as the mortality risks at specific ages have decreased (figure 2 and supplementary file video 1). The statistical modelling confirms these observations (online supplementary figure 3).
Supplementary video
There are important differences between IHD and CeVD trends. First, there was only modest improvement in age-specific mortality until the end of the 1980s for IHD, with faster improvement thereafter, contrasting with more continuous improvement for CeVD. Second, the relationship between age and mortality was not exponential for males for IHD in the 1980s and 1990s, with rates increasing faster per year of age between those aged around 30–50 years than at older ages (figure 2 and supplementary file video 1). IHD mortality improvement was also slower for those aged around 50 years and under, especially for males (figures 1 and 2). In comparison, improvement in CeVD mortality rates was similar for all ages except females aged <65 years where improvement was slightly faster.
The fully adjusted statistical models showed that the discontinuity in the IHD mortality trends is starkest at older ages and is more continuous at younger ages (online supplementary figure 4).
Trends in mortality by sex
Age-standardised rates for both IHD and CeVD mortality have declined for both males and females over the time period (figure 3). Rates of IHD in 1974 were higher for males than females but have fallen faster for males, especially since around 1987. By 2015 the gap in rates between the sexes was much reduced. In contrast, the difference in CeVD rates between the sexes in 1974 was considerably smaller and had almost disappeared by the late-2000s. Higher mortality rates for males are evident at all ages and time periods for both IHD and CeVD (figure 1), although this sex difference is less noticeable for CeVD. The pattern of improvement over time has largely been similar for both males and females for CeVD but differs for IHD for younger adults.
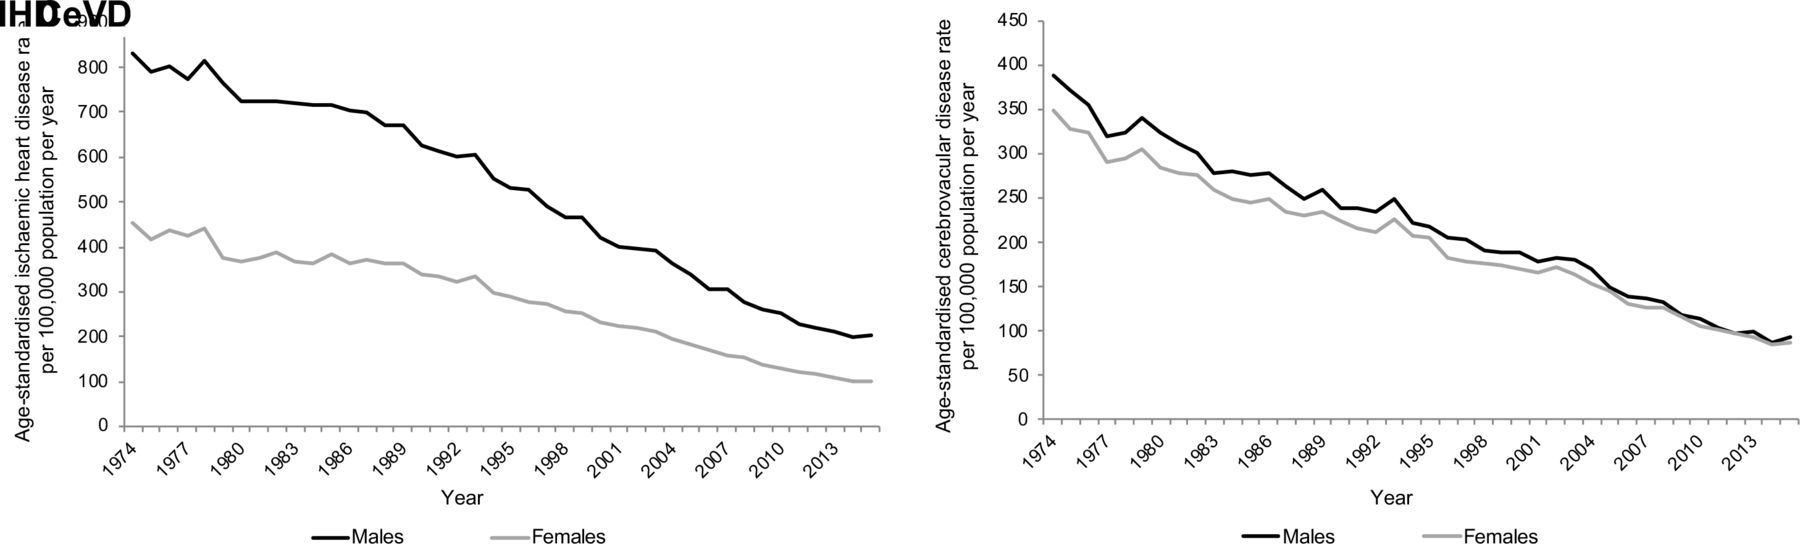
European age-standardised IHD and CeVD rate per 100 000 population per year in Scotland 1974–2015, by sex. CeVD, cerebrovascular disease; IHD, ischaemic heart disease.
The fully adjusted statistical models (online supplementary appendix 2) confirm the larger gap between male and female mortality rates for IHD compared with those for CeVD, which is more evident at older ages (online supplementary figure 4). For both IHD and CeVD, the gap between males and females has reduced in all age groups above 40 years over the period, largely due to faster improvements among males.
Results from margins analysis over the full period confirms a higher risk for males for IHD in every age group where a result was estimable (table 1), with the increased risk for males over females reducing in each subsequent age group. For CeVD, the differences between the age groups are smaller with no evidence of a difference in risk in the 41–50 years group and females having higher risks in the 71–80 years group.
Gap in mortality rates by sex for different age groups for IHD and CeVD, 1974–2015
Trends in mortality by area deprivation
Inequalities in age-standardised IHD mortality rates by area deprivation are evident for the whole time series and are greater among males in absolute terms (figure 4, online supplementary figure 5 and relative index of inequality (RII) and slope index of inequality (SII) analysis in online supplementary appendix 3). Inequalities increased in the late 1980s because of a faster improvement in the least deprived areas. Since around 2000 the rate of improvement has been greater in the most deprived areas, reducing the absolute inequalities across the population.
Supplemental material
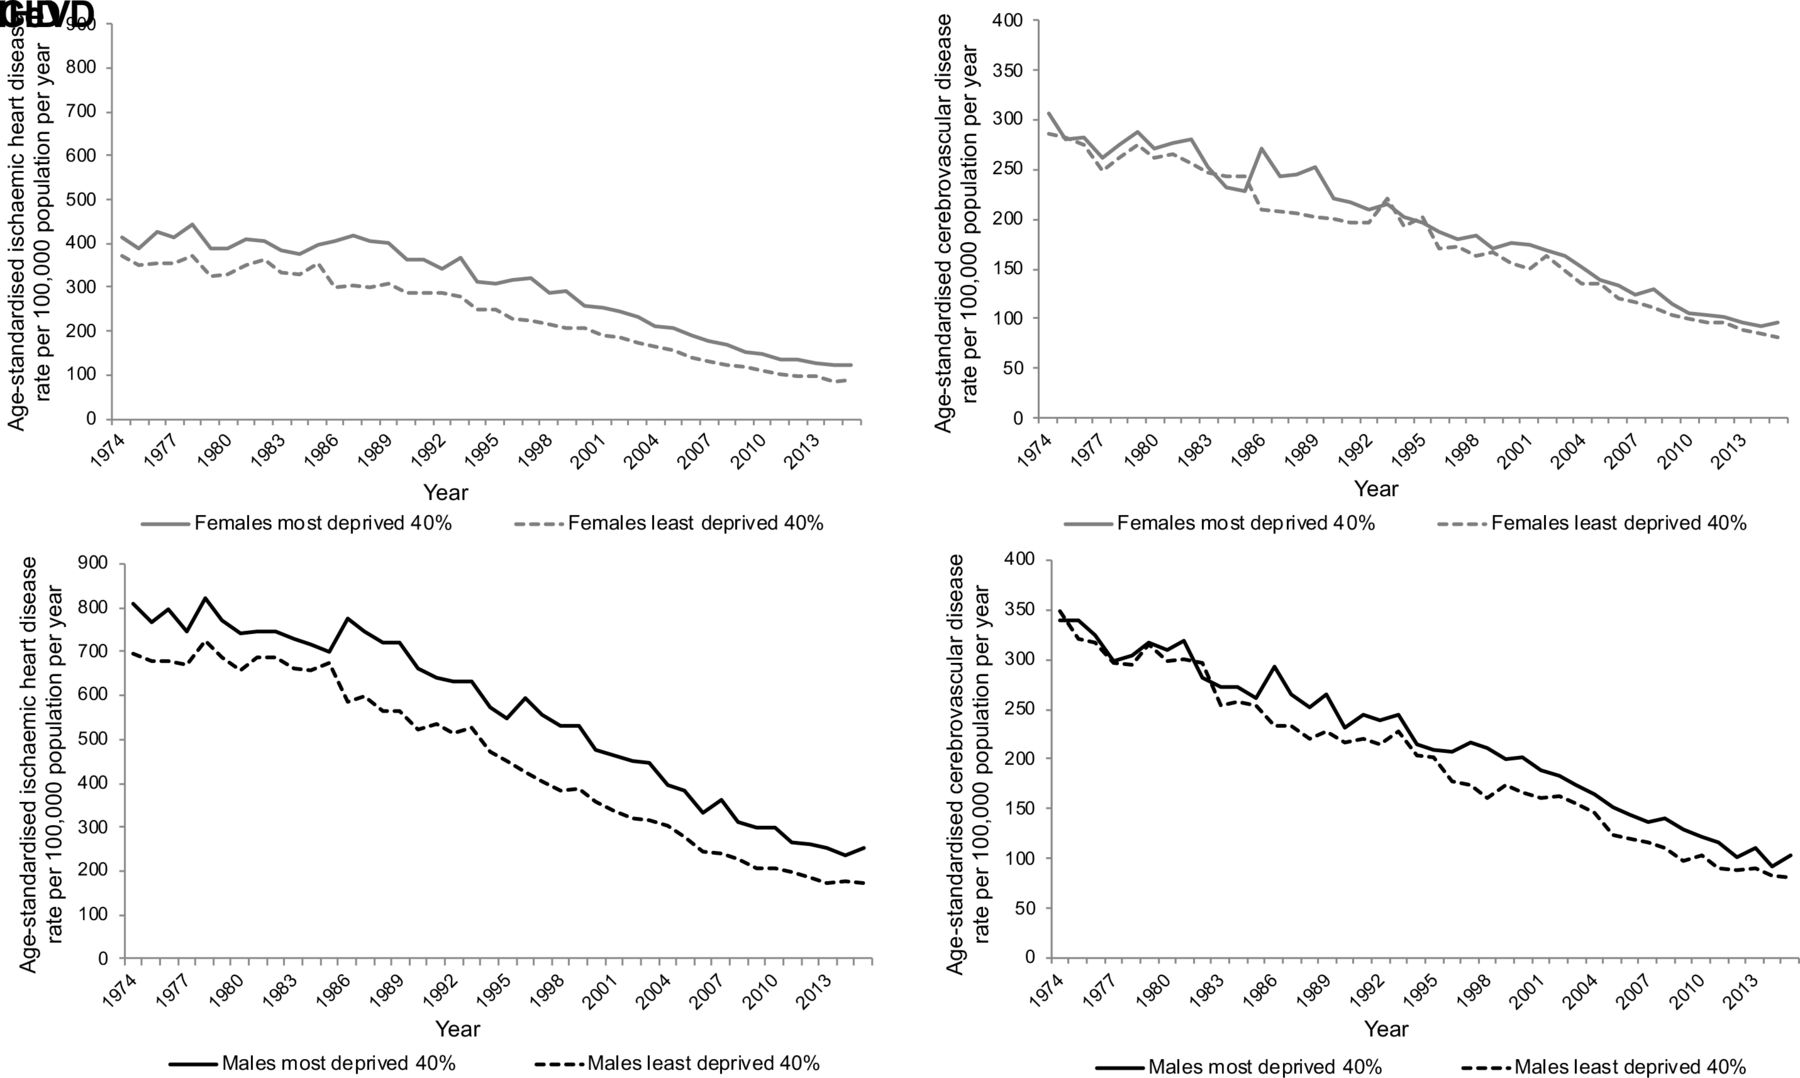
European age-standardised IHD and CeVD rate per 100 000 population per year in Scotland, 1974–2015, by sex and deprivation. CeVD, cerebrovascular disease; IHD, ischaemic heart disease.
In contrast, CeVD rates were more similar in the most and least deprived areas and declined at similar rates from 1974 to the mid-1980s but inequalities emerged in the late 1980s (figure 4, online supplementary figure 5 and RII and SII analysis in online supplementary appendix 3). This absolute inequality has remained for males but narrowed among females.
There are also clear differences in the age profiles of mortality from IHD for males and females by area deprivation and over time (figure 5 and online supplementary figure 6). Rates of death are consistently higher at all ages and improved later for those living in more deprived areas. The slower rate of improvement in IHD mortality for those aged around <50 years and under is more evident for those in more deprived areas while the faster improvement in CeVD rates for females aged <65 years is more evident in less deprived areas. The dotplots of log mortality rates by age for the period confirm the inequalities in mortality, especially for IHD and for males (figure 6 and supplementary files videos 2 and 3).
Supplementary video
Supplementary video

Heatmap plot of log (base10) age–year specific crude mortality rates per 100 000 population in Scotland for each single age from 15 to 84 years and each year from 1974 to 2015 stratified by sex and deprivation for IHD and CeVD. CeVD, cerebrovascular disease; IHD, ischaemic heart disease.

Coloured dotplot of mortality rate per 100 000 population in Scotland by age for those aged 30 to 84 years, from 1974 to 2015, stratified by sex and deprivation for IHD and CeVD. CeVD, cerebrovascular disease; IHD, ischaemic heart disease.
The fully adjusted statistical models (online supplementary appendix 2) confirm the inequalities in mortality rates, with higher rates for those living in the two most deprived quintile areas for both IHD and CeVD and males and females (online supplementary figure 7). Margins analysis suggest that for IHD there are inequalities for both males and females throughout the period; increasing from around 10% in 1974 to around 25% by 1986 and remaining at this level through to 2015 (table 2). The corresponding data for CeVD suggest that there was no inequality in 1974 but by 1986 the inequality was 23% for females and 16% for males. By 2015 the gap was no longer significant for females but had increased to 19% for males.
Gap in mortality rates between most deprived and least deprived 40% of areas for IHD and CeVD at different time points
Discussion
Main results
No noticeable recent period or cohort effects were identified to explain the trends in mortality for either outcome, but there was evidence of an exponential relationship with age for all except males for IHD in the 1980s/‘90s. The age profiles for death have become older, although the rate of improvement was slower for those aged around 50 years and under, especially for males, for IHD and slightly faster for females aged <65 years for CeVD.
While mortality rates of both IHD and CeVD fell between 1974 and 2015, CeVD mortality improved steadily while IHD mortality improved more rapidly from the late 1980s. Rates decreased faster for males than females such that by 2015 the gap between the sexes for IHD was greatly reduced and had almost disappeared for CeVD. Inequalities in mortality by area deprivation were evident for IHD, especially for males, increasing in the late 1980s and then subsequently decreasing in absolute terms and were larger than those for CeVD. For CeVD, inequalities only became apparent from the late 1980s. This absolute inequality has remained for males.
Despite no evidence for simple period or cohort effects for both IHD and CeVD mortality, the more rapid secular improvement in mortality rates at older ages for IHD could be interpreted as a period-cohort interaction which reduced the mortality rates for each subsequent birth cohort. This appears to have started around 1985 when rates of IHD deaths improved more rapidly for older birth cohorts (older ages) who retained this higher rate of improvement while improvement remained slower for younger adults. It is not possible to determine which of the many possible factors could have disproportionately impacted those in the older age groups to explain this period-cohort effect.
Strengths and weaknesses of the analysis
This study used a complete record of all deaths in Scotland over the time period and there are sufficient numbers of deaths to show the patterning of mortality over time and by age, and allowed for more detailed inequalities analysis. It was not possible to analyse trends pre-1974 as individual digital records were only introduced by NRS in 1974. Our analysis is based on the year that a death was registered rather than the year of occurrence, to match the NRS coding convention, so the data for any single year may differ slightly from that for the actual date of events. We present most of our deprivation analysis comparing the most and least deprived 40% of areas. Our sensitivity analysis shows that while the 40–40 comparison will inevitably show smaller differences between groups, especially for IHD, the overall conclusions are the same (figure 4 and online supplementary figure 5). Subsequent to our analysis, a revision was made by NRS to their Scottish mid-year population estimates for 2002–2010, which affected the age distribution for those aged 81 years and above (see https://www.nrscotland.gov.uk/files//statistics/population-estimates/mid-year-corrections/correction-to-age-distribution-mid-year-pop-estimates-2002-2010.pdf). Sensitivity analysis showed that this had no effect on our results.
Comparison with other studies
The absence of distinct recent cohort and period effects for IHD and CeVD contrasts with our findings from APC analysis for suicide and drug-related deaths, and for alcohol-related deaths in Scotland, respectively.11–13 This may be due to longer lag effects for IHD and CeVD which obscure real effects, or due to different causal pathways driving those trends.
Our results are consistent with and expand those found by others for IHD and CeVD mortality in Scotland showing age, sex and area deprivation inequalities.4 5 Previous analysis of IHD mortality in Scotland from 1986 to 2006 also noted that reductions in mortality rates have levelled off for young adults (aged 35–54 years) since 1996, especially for males and in the most deprived areas.16 A trend in IHD rates for young adults reported in several countries including E&W.17 Studies using slightly more contemporary data have highlighted that the recent slowing in all-cause mortality rates across Britain may be partially due to a reduction in the rate of improvement in IHD (Fenton et al, 2019, personal communication).
The reductions in mortality are attributed to both reduced incidence and case fatality rates. This is credited to (i) improvement in primary prevention strategies such as pharmacological management of risk factors such as hypercholesterolaemia18 and hypertension19 and public health approaches such as policies to reduce tobacco exposure20 intended to reduce the risk of cardiovascular disease and to (ii) improvement in management of acute atherosclerotic disease including coronary revascularisation for ST elevation myocardial infarction21 and appropriate medical therapy for secondary prevention of cardiovascular disease including antiplatelet therapy, statins and ACE inhibitors.22 23
Studies have sought to evaluate the relative contributions of medical therapies and risk factors to cardiovascular trends over specific periods in several countries.24–26 The IMPACT model, which aims to quantify the contributions of temporal changes in exposure to risk factors and uptake of treatments to declines in IHD deaths, has estimated that in Scotland between 1975–1994 medical treatment accounted for 40% of the reduction in IHD mortality, and wider risk factors 51%, while between 2000–2010 they accounted for 43% and 39%, respectively.25 27 Similar IMPACT analysis shows medical treatment contributed 52% and risk factors 34% to IHD reductions in England over 2000–2007 and to 42% and 58% of reductions in E&W over 1981–2000.28 29 Inequalities in the risk factors for cardiovascular disease rather than medical treatment uptake, which appears to be uniformly delivered across deprivation groups in the IMPACT model, could help explain the inequalities in IHD and CeVD in Scotland.17 27 29 Likewise risk factors such as increasing trends in body mass index and diabetes are likely to have diminished the reduction in IHD mortality rates in recent decades.27 30
Implications and conclusions
There have been substantial improvements in mortality in two of the leading causes of death in Scotland. CeVD mortality has improved steadily since the mid-1970s, while IHD mortality more rapidly since the mid-1980s. The trends in their mortality exhibit age but not distinct period or cohort effects. Mortality rates were higher, and inequalities greater, among males. Inequalities in IHD widened from the late 1980s until around 2000, after which absolute inequalities decreased. Mortality from CeVD only became unequal from the late 1980s.
IHD and CeVD improvement has been important to the overall all-cause mortality improvement seen in Scotland. However, recent evidence sources show that this is now changing (Fenton et al, 2019, personal communication) and that it is imperative that we seek to understand the recent changes better to determine how we can improve mortality rates from these outcomes in order to impact on the overall Scottish mortality rate and prevent the current stalling in life expectancy.
Key questions
What is already known on this subject?
Ischaemic heart disease (IHD) and cerebrovascular disease (CeVD) have among the highest cause-specific mortality rates in Scotland. They are causes of death partly responsible for ‘excess' mortality in Scotland (the higher mortality compared to England & Wales after accounting for deprivation). Mortality rates for both have been declining in Scotland for over 35 years.
What might this study add?
CeVD mortality has improved steadily at most ages from 1974 to 2015, while improvements in age-specific IHD mortality have been much faster from the late 1980s, a discontinuity starkest at older ages. Inequalities by area deprivation in mortality from IHD widened between the late 1980s and 2000 before reducing in absolute terms; inequalities by area deprivation in CeVD mortality appeared from the late 1980s onwards.
There are no recent distinct period or cohort effects for IHD and CeVD mortality trends in Scotland, but there is an exponential relationship with age for both causes for all except males for IHD in the 1980s and 1990s.
This contrasts to suicide and drug-related, and alcohol-related deaths that also contribute to Scotland’s 'excess' mortality and for which cohort effects and age-period effects, respectively, help explain their recent trends.
How might this impact on clinical practice?
It is important for clinical practice that there is an understanding of how trends in mortality by IHD and CeVD have changed over time by age, sex and deprivation. This shows that more work is required to reduce inequalities in these outcomes.
Acknowledgments
We would like to thank Frank Dixon and Julie Ramsay at NRS for the dataset and also David Readhead, Laura Kate Campbell and Tina Fu at NHS National Services Scotland for assistance in providing population data by deprivation groupings.
References
Footnotes
Contributors GM generated the initial idea for the study. Analyses of data were led by JP. JM undertook the visualisation analysis in R and JB with JL the statistical analyses. JP drafted the manuscript. All authors provided critical input into the redrafting of the manuscript and approved the final draft.
Funding JP, JM and GM authors are salaried employees of the NHS, JB and JL are employees of the University of Glasgow and AS is a salaried employee of the University of Edinburgh.
Competing interests None declared.
Patient consent for publication Not required.
Provenance and peer review Not commissioned; externally peer reviewed.
Data availability statement No data are available. All data relevant to the study are included in the article or uploaded as supplementary information.