Article Text

Abstract
Objective The prognostic importance of a coronary stenosis depends on its functional severity and its depending myocardial mass. Functional severity can be assessed by fractional flow reserve (FFR), estimated non-invasively by a specific validated CT algorithm (FFRCT). Calculation of myocardial mass at risk by that same set of CT data (CTmass), however, has not been prospectively validated so far. The aim of the present study was to compare relative territorial-based CTmass assessment with relative flow distribution, which is closely linked to true myocardial mass.
Methods In this exploratory study, 35 patients with (near) normal coronary arteries underwent CT scanning for computed flow-based CTmass assessment and underwent invasive myocardial perfusion measurement in all 3 major coronary arteries by continuous thermodilution. Next, the mass and flows were calculated as relative percentages of total mass and perfusion.
Results The mean difference between CTmass per territory and invasively measured myocardial perfusion, both expressed as percentage of total mass and perfusion, was 5.3±6.2% for the left anterior descending territory, −2.0±7.4% for the left circumflex territory and −3.2±3.4% for the right coronary artery territory. The intraclass correlation between the two techniques was 0.90.
Conclusions Our study shows a close relationship between the relative mass of the perfusion territory calculated by the specific CT algorithm and invasively measured myocardial perfusion. As such, these data support the use of CTmass to estimate territorial myocardium-at-risk in proximal coronary arteries.
- Cardiac catheterisation and angiography
- cardiac computed tomographic (CT) imaging
This is an open access article distributed in accordance with the Creative Commons Attribution Non Commercial (CC BY-NC 4.0) license, which permits others to distribute, remix, adapt, build upon this work non-commercially, and license their derivative works on different terms, provided the original work is properly cited, appropriate credit is given, any changes made indicated, and the use is non-commercial. See: http://creativecommons.org/licenses/by-nc/4.0/.
Statistics from Altmetric.com
Introduction
In patients with coronary artery disease, the most important parameters for both symptoms and outcome are the presence and extent of inducible ischaemia.1–4
Fractional flow reserve (FFR) measurement during cardiac catheterisation is the invasive standard for the presence of ischaemia and is useful to determine if a patient benefits from percutaneous coronary intervention. An FFR ≤0.80 indicates functional significance of a particular stenosis. Because FFR is determined by the stenosis itself and also by the amount of viable myocardium distal to that stenosis, the same FFR value may have a different prognostic significance depending on the extent of the distal myocardium. It is known from previous trials that patients benefit most from revascularisation if FFR is ≤0.80 or if at least 10%–12.5% of the myocardium is at ischaemic risk.1 2 Therefore, information about the extent of the perfusion territory distal to a specific coronary stenosis, in addition to FFR of that stenosis, is clinically relevant.3 4
Up to now, no method has been validated to assess the amount of myocardium at risk in conjunction with simultaneous assessment of functional stenosis severity. Both MRI and CT scanning are able to estimate myocardial mass non-invasively, but no stenosis-specific functional information can be obtained.5 6 During the last decade, a method to compute FFR from coronary CT-angiographic images along the coronary tree has been developed and validated and is known as FFRCT 7–9 (HeartFlow, Redwood City, CA, USA). Several studies have investigated coronary volume to myocardial (V/M) mass computations using FFRCT, but calculation of relative mass per territory (expressed as percentage of total mass) has not been reported.10–13
Experimentally, it has been shown that an excellent correlation exists between coronary blood flow and mass of the perfused territory.14–16 Therefore, direct measurement of myocardial perfusion is a good approach to validate myocardial mass.
The purpose of this exploratory study was to compare the relative myocardial mass distribution assessed by that specific CT algorithm to the respective distribution of blood flow measured invasively in the three major coronary arteries. If such relation can be demonstrated, both the functional significance of the stenosis (FFRCT) and its depending myocardial mass (CTmass) can be assessed non-invasively by one single CT examination.
Methods
Design and study population
This study was performed in 35 patients with normal coronary arteries or minimal atherosclerosis between July 2017 and December 2018. These patients were characterised by angiographically normal coronary arteries (ie, no signs of atherosclerosis on angiogram or less than a 30% lumen reduction in one segment only; non-ischaemic FFR values (ie, >0.80); no lumen reductions of more than 30% in more than one segment on the CT scan). An invasive angiogram in these patients was performed because of persistent non-specific thoracic complaints. Patients with coronary anomalies, valvular disease, known left ventricular hypertrophy or pulmonary hypertension were excluded. Other exclusion criteria included contraindications for CT scanning and age above 75. The coronary CT angiogram (CTA) and invasive angiography were performed less than 3 months apart without interventions in between.
Patient and public involvement statement
Patients were screened and signed informed consent before all examinations. This research was done without patient involvement.
CT scanning for calculation of myocardial mass
All 35 patients underwent a coronary CTA performed on a 256-slice scanner (Brilliance iCT, Philips Healthcare or SOMATOM, Siemens). The coronary CTA scan parameters were as follows: tube potential, 120 kVp; field of view, ≤255 mm; slice thickness, 0.9 mm; increment, 0.45 mm. Prior to CT examination, patients were pretreated with 0.8 mg sublingual nitroglycerine and intravenous metoprolol if the heart rate was ≥65 beats/min. Thereafter, ECG-gated step-and-shoot images (in two stacks at 75% of the heart cycle) were made. The scan procedure included a non-contrast ECG-triggered coronary artery calcium scoring scan directly followed by a diagnostic coronary CTA scan using iomeron 300 with a flow of at least 6 mL/s. Coronary CTA images were transferred to a core laboratory at HeartFlow Inc. (Redwood City, CA, USA), and the images were screened for interpretability by detecting image artefacts automatically. First, all images were processed through deep learning–based centreline and lumen extraction algorithms and checked for anatomical correctness of the segmented geometry and the left ventricular myocardium.9 17 The left ventricle (LV) was segmented using standard methods and the LV myocardial mass was computed by multiplying the extracted myocardial volume by a tissue density of 1.05 g/cc. For the relative mass calculation, the coronary centreline trees were traversed and the centrelines of the main branches in the vicinity of the segmented LV myocardium were classified as perfusing the LV using a distance threshold based on vessel size.18 Vessels that were identified to feed other heart chambers (right ventricle (RV)) were classified as non-LV feeding vessels. Next, the total baseline flow to the LV feeding vessels was computed using the LV myocardial mass and an assumed flow per unit tissue as previously described.9 The total baseline flow through the non-LV feeding vessels was estimated to be 20% of LV baseline flow based on literature data.19 Next, total flow to the LCA and RCA was distributed to the individual vessels within these territories based on downstream vascular volume. Finally, the myocardial mass subtended by each coronary vessel territory (left anterior descending (LAD), left circumflex (LCX) and right coronary artery (RCA)) was computed by dividing the territory flow (calculated as the product of the coronary artery cross-sectional area and area averaged velocity) by a constant baseline flow per unit tissue and the fraction of total myocardial mass was reported. All corelab personnel were blinded.
Invasive measurement of absolute coronary blood flow
Cardiac catheterisation with FFR and absolute blood flow measurements was performed according to routine by either the femoral or the radial access, at the discretion of the operator. Guiding catheters were advanced into the coronary arteries and after intracoronary administration of 200 µg nitroglycerin and proper equalisation of pressures, FFR was measured in all three major coronary arteries using a pressure/temperature wire (PressureWire X; Abbott, Saint Paul, MN, USA); following, a dedicated monorail infusion catheter (Rayflow; Hexacath, Paris) was advanced over the pressure wire and positioned with its tip in the proximal part of the coronary artery. The pressure/temperature sensor of the pressure wire was positioned in the distal part of the coronary artery.
Next, saline infusion was started at a rate of 20 mL/min (Qi) and absolute blood flow in the coronary artery was calculated as previously described.20–22
In short, this method provides calculation of hyperemic coronary blood flow (mL/min). During continuous infusion of saline at a set rate (Qi, mL/min), the temperature of the completely mixed blood and saline (T) is measured in the distal coronary artery and after a steady-state has been reached (within 10–20 s), the pressure wire is pulled back in the Rayflow catheter to determine the infusion temperature of the saline (Ti). Absolute blood flow (mL/min) is calculated by the equation

The constant 1.08 relates to the difference between the specific heats and densities of blood and saline.
All signals are continuously displayed on the regular cathlab monitor by the Coroventis software (Coroflow, Uppsala, Sweden; figure 1).
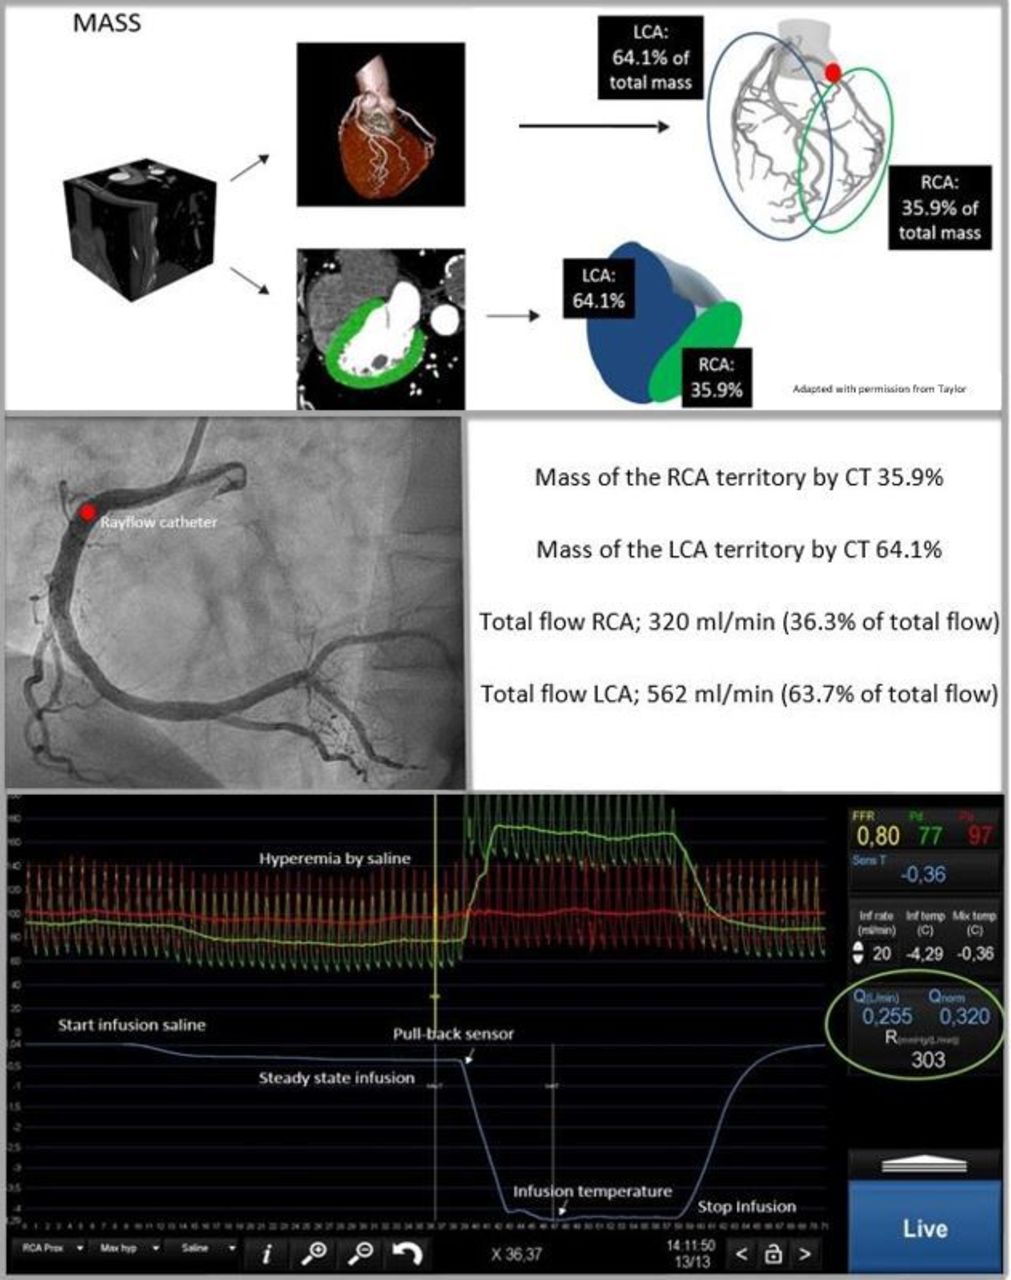
Left upper panel shows the CT angiogram images derived by the physiological CT algorithm (HeartFlow). Dedicated software was used to calculate mass distal to the position of the Rayflow catheter. All patients underwent coronary angiography (middle left panel) with invasive blood flow and resistance measurements in all three coronary arteries (bottom).10 LCA, left carotid artery; RCA, right carotid artery.
Comparison of CT mass and invasively measured perfusion
The invasively measured blood flow is the flow distal to the point of the infusion, that is, at the tip of the infusion catheter. To compare these measurements with the non-invasive CT data, the exact position of the Rayflow catheter was taken into account to determine the amount of myocardial mass (figure 1).
Because even in normal coronary arteries, the presence of the infusion catheter may influence the measured blood flow (creating a small gradient), the flow in the absence of a stenosis is determined by the Coroventis software (Qnorm) by dividing the actually measured flow by FFR.
Assuming homogeneous myocardial perfusion and assuming a direct relation between blood flow and mass of the perfused territory, the relative distributions of both the mass and flow should be equal. Therefore, the relative amount of myocardial mass of the LAD, LCX and RCA artery will be compared with the relative blood flow in the respective coronary arteries. As an example, if the myocardial mass perfused by the LAD equals 37% of total myocardial mass and flow measured in the LAD equals 40% of total measured myocardial flow, the percentual difference is 3%.
Statistical analysis
Analyses were performed using R V.3.5.2 (R Foundation for Statistical Computing, Vienna, Austria). The package ‘ggplot2’ was used for the graphical plots. The package ‘blandr’ was used for the Bland Altman and ‘psych’ for the intraclass correlation (ICC) analyses. The ICC technique used is the two-way mixed-effects model estimated for a single rater. Bland-Altman plots were made per vessel (LAD, LCX and RCA) to compare mass and flow distributions. Mean values and ±1.96 SD are plotted. Categorical variables are presented as counts and percentages. Continuous variables are presented as mean±SD as appropriate.
Results
Patient characteristics and procedural results
A total of 35 normal patients with a mean age of 59.3±9.4 were included, undergoing coronary angiography and flow measurements in all three major coronary arteries and CT scanning. CT scans were sent for analysis; two were rejected due to motion artefacts, and these patients were excluded. Patient characteristics are listed in table 1. Successful invasive measurements were performed in all 105 coronary arteries. Most patients (54.3%) had completely normal coronary arteries. The others showed mild wall irregularities in one coronary segment only. No significant adverse events were observed during the invasive coronary angiography and physiological measurements. No chest pain was noted during the infusion of saline. One patient showed transient atrioventricular block during the invasive flow measurement with immediate recovery after stopping saline infusion. This minor side effect is in line with previous data on safety of the invasive flow measurement technique.22 23
Baseline characteristics
Relation between CTmass and myocardial perfusion
Table 2 summarises the absolute values from CT and the invasive measurements. Myocardial mass was 49.2±12.2 g, 39±13.2 g and 46.5±15.9 g for the LAD, LCX and RCA territory, respectively. Total mass equalled 153.3±33.5 g. Coronary blood flow measured in the LAD was 312.1±108.8 mL/min, compared with 200±77.5 mL/min in the LCX and 226.8±79.4 mL/min in the RCA. Total hyperemic blood flow for the complete heart equalled 738.9±201.9 mL/min. The percentage difference between relative CTmass per territory and relative flow per coronary artery is presented for the individual patients and per vessel in Bland-Altman plots in figure 2. The mean difference was 5.3%±6.2% for the LAD territory, −2.0±7.4% for the LCX territory and −3.1±3.4% for the RCA territory. The distributions for mass and flow are visualised for the individual patients in the supplementary file (online supplementary figure S1). Figure 3 shows the relationship between CTmass and invasive flow measurements in the 35 patients. The intraclass correlation between mass and flow is 0.90 in these normal or near-normal patients.
Procedural characteristics

Bland-Altman plots representing CT mass assessment and invasive flow measurement per coronary artery. (A) RCA, (B) LAD and (C) LCx. Dotted line indicates mean value and black solid lines 95% limits of agreement. LAD, left anterior descending; LCx, left circumflex; RCA, right coronary artery.

Intraclass correlation (ICC) between mass and coronary blood flow with 95% CI bands.
Discussion
Summary of findings
The present study shows a close relationship between the mass of the perfusion territory calculated by the specific CT algorithm and invasively measured myocardial perfusion. Therefore, these data support the reliability of that CT algorithm to estimate myocardial mass at-risk in the proximal coronary arteries and justifies future regional-based CTmass assessment.
Clinical importance of myocardial mass at risk
Several methodologies are available for assessing myocardial mass or functional stenosis severity separately. But no methodology has been prospectively validated so far for simultaneous assessment of both parameters per territory and within the same examination. On one hand, myocardial mass can be assessed non-invasively by several MRI or CT methods. However, no stenosis-specific functional information about the corresponding coronary artery perfusing that territory could be obtained. On the other hand, FFR measured invasively is specific indeed for stenosis-specific ischaemia with excellent spatial resolution. Yet, although FFR for a given stenosis is in itself also determined in part by the extent of the depending viable myocardium, it does not allow to estimate that extent for an individual stenosis. Combining FFRCT and CTmass within one single non-invasive examination may enable more reliable risk assessment in patients with coronary artery disease.3 4
HeartFlow is already able to accurately assess FFRCT, but mass assumption using their protocol had to be prospectively validated as was done in this study, using invasive measurement of myocardial perfusion as the reference standard.
Myocardial perfusion to mass relationship and comparison with previous studies
One of the hypotheses of our study is that under physiological circumstances, myocardial perfusion is homogeneous and that myocardial mass is closely linked to myocardial perfusion. This has been extensively investigated in experimental studies, showing proportionality between perfusion and mass.14–16 24 This principle is based on the allometric scaling laws by Choy and Kassab14 who investigated both the relationship between coronary artery volume and myocardial mass and the relationship between myocardial perfusion and myocardial mass. The latter was the focus in this study and continuous thermodilution was used to measure the myocardial perfusion in millilitres per minute (ie, invasive absolute blood flow measurement). Since there was such a close relationship between the mass derived by HeartFlow and the invasive flow measurements, this confirms the mass calculation.
Murai et al 25 did already analyse the relationship between perfusion/flow and mass and compared the Voronoi method with invasive physiology measures (partial myocardial mass (PMM) derived by Doppler flow in a single coronary artery). The difference with our study is that they did not compute total coronary flow neither percentage flow per territory. Our study is an assessment of total myocardial mass and coronary flow of all three coronary arteries. Another difference with our study is that Murai et al validated the PMM method to assess mass and our goal is to confirm mass assessment using non-invasive CT imaging.25
Further, Ide et al validated the myocardial segmentation algorithm against whole heart histology in 15 pig hearts.6 Voronoi segmentation was validated to calculate myocardial mass using CT. Later, it was also validated against SPECT by Kurata et al.5 The technique used by HeartFlow differs from Voronoi in that it can account for non-LV feeding vessels using only an LV segmentation as an input. Geometric information about the other heart chambers is not required, which is desirable because it is more difficult to obtain accurate segmentations of the other heart chambers.
All other reported papers10–13 are related to volume-to-mass computations, which reported total coronary volume as a ratio to total LV myocardial mass.
Derived flow and mass values compared with literature
Of interest, both our data for normal hyperemic blood flow and the observed values for myocardial mass are consistent with literature. Normal myocardial LV mass varied between 120 and 160 g in earlier studies,26 whereas in our study total LV mass equalled 110 g. This slightly lower value may be explained by the fact that some proximal side branches in several patients were excluded. The myocardial mass per territory was 49.2 g for the LAD, 39 g for the LCX and 46.5 g for the RCA, and is in line with previous literature.6 26
Total hyperemic coronary blood flow in normal individuals has been well investigated in several human studies and equals 500–600 mL/min by PET.27–29 In these studies, blood flow to the RV is not included. Since we also measured flow in the proximal RCA (including perfusion of the RV), this explains the higher values in our study (738±201 mL/min).
Limitations
For optimal comparison of flow and mass, in our study, 35 selected patients were included with normal or almost normal arteries as reflected by angiogram, FFR and CT scanning.
For the purpose of this study, this validation in normal patients only is not a real limitation because, once the mass calculation by the CT algorithm has been validated, it can be applied in the analysis of the CT scans even in the presence of coronary artery stenosis. Further studies are mandatory to support this position in patients with extensive coronary artery disease.
Next, we have assumed that our patients were normal or nearly normal by the criteria previously mentioned. Nevertheless, a number of these patients had non-specific chest pain and it cannot be excluded that some of them had microvascular disease, thereby influencing blood flow and the assumption of homogeneous myocardial perfusion.
Only the myocardial volume of the left ventricle was extracted from medical image data and the trabeculae and papillary muscles were excluded. Thus, the total myocardial mass of the left ventricle may be underestimated by this method. The whole septum was included in LV mass calculation. The calculation of the myocardial territories was performed using only the vessels explicitly identified in the CT image data. This could be extended in the future to include synthetic trees generated using branching laws to fill the myocardium.30
Furthermore, in our study, homogeneous myocardial density was assumed to be present.
Also, the assumed RV mass was used rather than measured RV mass due to difficulties in resolving the RV wall thickness from CT data. Measuring exact RV mass would have been superior if feasible. The assumption of RV mass being 20% of the LV mass is a reasonable approximation for patients without pulmonary hypertension. Further, this study shows that the per vessel agreement is high, but we have not investigated segments. Thus, the results can be translated only to ostial lesions, but it remains to be investigated for more distal lesions.
Finally, it should be noticed that this new application of CTmass by HeartFlow is not a currently commercially available outcome of FFRCT.
Conclusions
Our study shows a close relationship between the relative mass of the perfusion territory calculated by the specific CT algorithm and invasively measured myocardial perfusion. As such, these data support the use of CTmass to estimate territorial myocardium-at-risk in proximal coronary arteries. However, as indicated in the limitations, further studies in non-selected patients are mandatory to support this position.
Key questions
What is already known on this subject?
It is already known that for a coronary stenosis, both the presence of ischaemia as well as the extent of the perfusion territory distal to the stenosis are clinically relevant. Presence of ischaemia can be reliably assessed by fractional flow reserve (FFR) calculated by CT angiography (FFRCT). However, assessment of mass by the same set of CT data (CTmass) has not been compared yet with direct invasive measurement of myocardial perfusion.
What might this study add?
These data validate regional CTmass, using invasively measured myocardial perfusion as a standard. Outcome of this study supports reliability of that CT algorithm to estimate relative myocardium at risk.
How might this impact on clinical practice?
Using the same set of CT data, the presence and severity of proximal coronary artery stenosis and also the extent of myocardium at risk (CTmass) can be assessed simultaneously. Combining FFRCT and CTmass within one single non-invasive examination may enable more reliable risk assessment in patients with coronary artery disease.
Supplemental material
Acknowledgments
We thank Hyun Jin Kim, Adam Updegrove and Professor Dr Charles Taylor for providing support for FFRCT and percent myocardial blood flow data.
Footnotes
Twitter @j_zelis
DCJK and SF contributed equally.
Contributors DCJK: planning, conducting; patient enrolment, data collection and reporting; article writing, submission. SF: conducting; patient enrolment, data collection. MvV: reporting; article writing, data check, statistical check. IC: conducting; patient enrolment, reporting; data collection. JMZ: conducting; patient enrolment, reporting; article check, statistical analysis. MEF: conducting; patient enrolment, reporting; article check. FZ: conducting; patient enrolment, reporting; article check. CC: reporting; data check, statistical check. BDB: reporting; article writing, data check. NHJP: planning; principal investigator, reporting; article writing.
Funding Myomass was an investigator-initiated study supported by an unrestricted educational grant from HeartFlow.
Competing interests SF: institutional consultance/speaker fees from Bayer and Cathworks. CC: grants from HeartFlow, Abbott Vascular, Biosensors, Pie Medical and consultancy fees from HeartFlow and Philips. Member of the advisory board of Abbott Vascular, Pie Medical and Opsens. BDB: institutional grant; Abbott, Boston Scientific, Biotronik AG. Institutional consultance fees; Abbott, Opsens and Boston Scientific outside of the submitted work. Minor equities: Siemens, GE, Bayer, Philips, HeartFlow, Edwards Life Sciences and Ceyliad. NHJP: institutional grant; Abbott, Hexacath. Consultant; Abbott, Opsens. Minor equities Philips, GE, ASML, HeartFlow. Consultant GE and personal fees GE.
Patient and public involvement Patients and/or the public were not involved in the design, or conduct, or reporting, or dissemination plans of this research.
Patient consent for publication Not required.
Ethics approval The study was approved by the medical ethics committee of the hospital and all investigators adhered to the principles of the declaration of Helsinki.
Provenance and peer review Not commissioned; externally peer reviewed.
Data availability statement Data are available on reasonable request.