Article Text

Abstract
Objective Many patients who present with chest pain have previous measurements of high-sensitivity cardiac troponin T (hs-cTnT). The clinical usefulness of incorporating these measurements in identifying patients who are at a high risk of myocardial infarction (MI) is unknown. We investigated if the relative change between a historical hs-cTnT and the admission hs-cTnT could improve early identification of patients with a high risk of MI.
Methods We included all patients presenting with chest pain to seven different emergency departments (EDs) in Sweden from December 2009 to December 2016, who had at least one hs-cTnT measurement at the presentation and at least one available prior measurement. We used logistic regression to investigate the diagnostic performance of using various combinations of current and historical hs-cTnT measurements in diagnosing MI within 30 days.
Results A total of 27 809 visits were included, among whom 2686 (9.7%) had an MI within 30 days. A cut-off value for historical hs-cTnT-adjusted admission hs-cTnT with similar specificity (91.2%) as an admission hs-cTnT of ≥52 ng/L identified 4% more MIs (43% vs 39%) and had a higher positive predictive value, 42.6% (95% CI, 41.0% to 44.3%) vs 38.9% (95% CI 37.4% to 40.4%), as well as a higher positive likelihood ratio, 6.95 (95% CI 6.69 to 7.22) vs 5.95 (95% CI 5.73 to 6.18). Among patients with an admission hs-cTnT of <52 ng/L who were classified as high-risk patients when incorporating past hs-cTnT measurements, 28% suffered an MI.
Conclusions Historical hs-cTnT levels can be used with admission hs-cTnT to improve early risk stratification of MI in the ED.
- Biomarkers
- Chest Pain
- Myocardial Infarction
- Epidemiology
Data availability statement
All data relevant to the study are included in the article or uploaded as supplementary information.
This is an open access article distributed in accordance with the Creative Commons Attribution 4.0 Unported (CC BY 4.0) license, which permits others to copy, redistribute, remix, transform and build upon this work for any purpose, provided the original work is properly cited, a link to the licence is given, and indication of whether changes were made. See: https://creativecommons.org/licenses/by/4.0/.
Statistics from Altmetric.com
WHAT IS ALREADY KNOWN ON THIS TOPIC
The clinical role of historical high-sensitivity cardiac troponin T (hs-cTnT) concentrations in risk stratification of patients with chest pain in the emergency department (ED) is unknown.
We investigated if the relative change between a historical hs-cTnT measurement and the 0-hour hs-cTnT could improve early identification of patients with a high risk of MI.
WHAT THIS STUDY ADDS
We found that a novel historical-hs-cTnT-based strategy with similar specificity (91.2%) as an admission hs-cTnT of ≥52 ng/L identified 4% more MIs (43% vs 39%) and had a higher positive predictive value, 42.6% (95% CI 41.0% to 44.3%) vs 38.9% (95% CI 37.4% to 40.4%).
HOW THIS STUDY MIGHT AFFECT RESEARCH, PRACTICE OR POLICY
The use of a novel historical-hs-cTnT-based strategy could ultimately lead to prognostic improvements, as a rapid diagnosis of MI is essential for the early initiation of evidence-based and effective therapies.
Introduction
The use of high-sensitivity cardiac troponin (hs-cTn) assays in clinical practice has improved the early diagnosis of myocardial infarction (MI) in emergency department (ED) patients with chest pain.1–4 Several hs-cTn-based algorithms for risk stratification exist, which help clinicians to triage patients towards rule-in or rule-out already at first presentation.5–7 Current guidelines from the European Society of Cardiology (ESC) for the management of patients with a suspected non-ST segment acute coronary syndrome (NSTE-ACS) recommend the use of a 0-and-1-hour algorithm which identifies patients with an admission hs-cTnT concentration of ≥52 ng/L as having a high risk of MI, among whom prompt management and treatment are required.8
Hs-cTnT measurements from prior visits are often available in patients presenting to the ED with symptoms suggestive of an acute MI.9 The clinical usefulness of incorporating previous hs-cTnT measurements is unclear, but merits further attention as they could potentially help to improve identification of patients who are at a high risk of MI.
Using a large cohort of patients with a primary report of chest pain in the ED, we sought to investigate if the change between a historical hs-cTnT concentration and the admission hs-cTnT could be used to improve early risk stratification for an evolving MI.
Methods
Data sources
The study was based on data from seven large EDs in Stockholm and Göteborg, Sweden, between 1 December 2009 and 1 December 2016. Each hospital’s local administrative database was used to identify all ED visits by adult patients during the study period. Laboratory data were obtained from the hospitals’ IT Departments. The Elecsys 2010 system (Roche Diagnostics, Mannheim, Germany) was used to analyse hs-cTnT levels at all sites. This assay has a detection limit of 5 ng/L, a 99th percentile cut-off point of 14 ng/L, and a coefficient of variation of <10% at 13 ng/L.1
Data on ED visits and laboratory data were thereafter sent to the Swedish National Board of Health and Welfare for ascertaining information on comorbidities, use of medication and mortality, including causes of death, using data from the National Patient Register (NPR), the Prescribed Drug Register and the Cause of Death Register, respectively.10 11 Further details on MI diagnoses were obtained from The Swedish Web system for Enhancement and Development of Evidence-based care in Heart disease Evaluated According to Recommended Therapies (SWEDEHEART) register.12
Study population
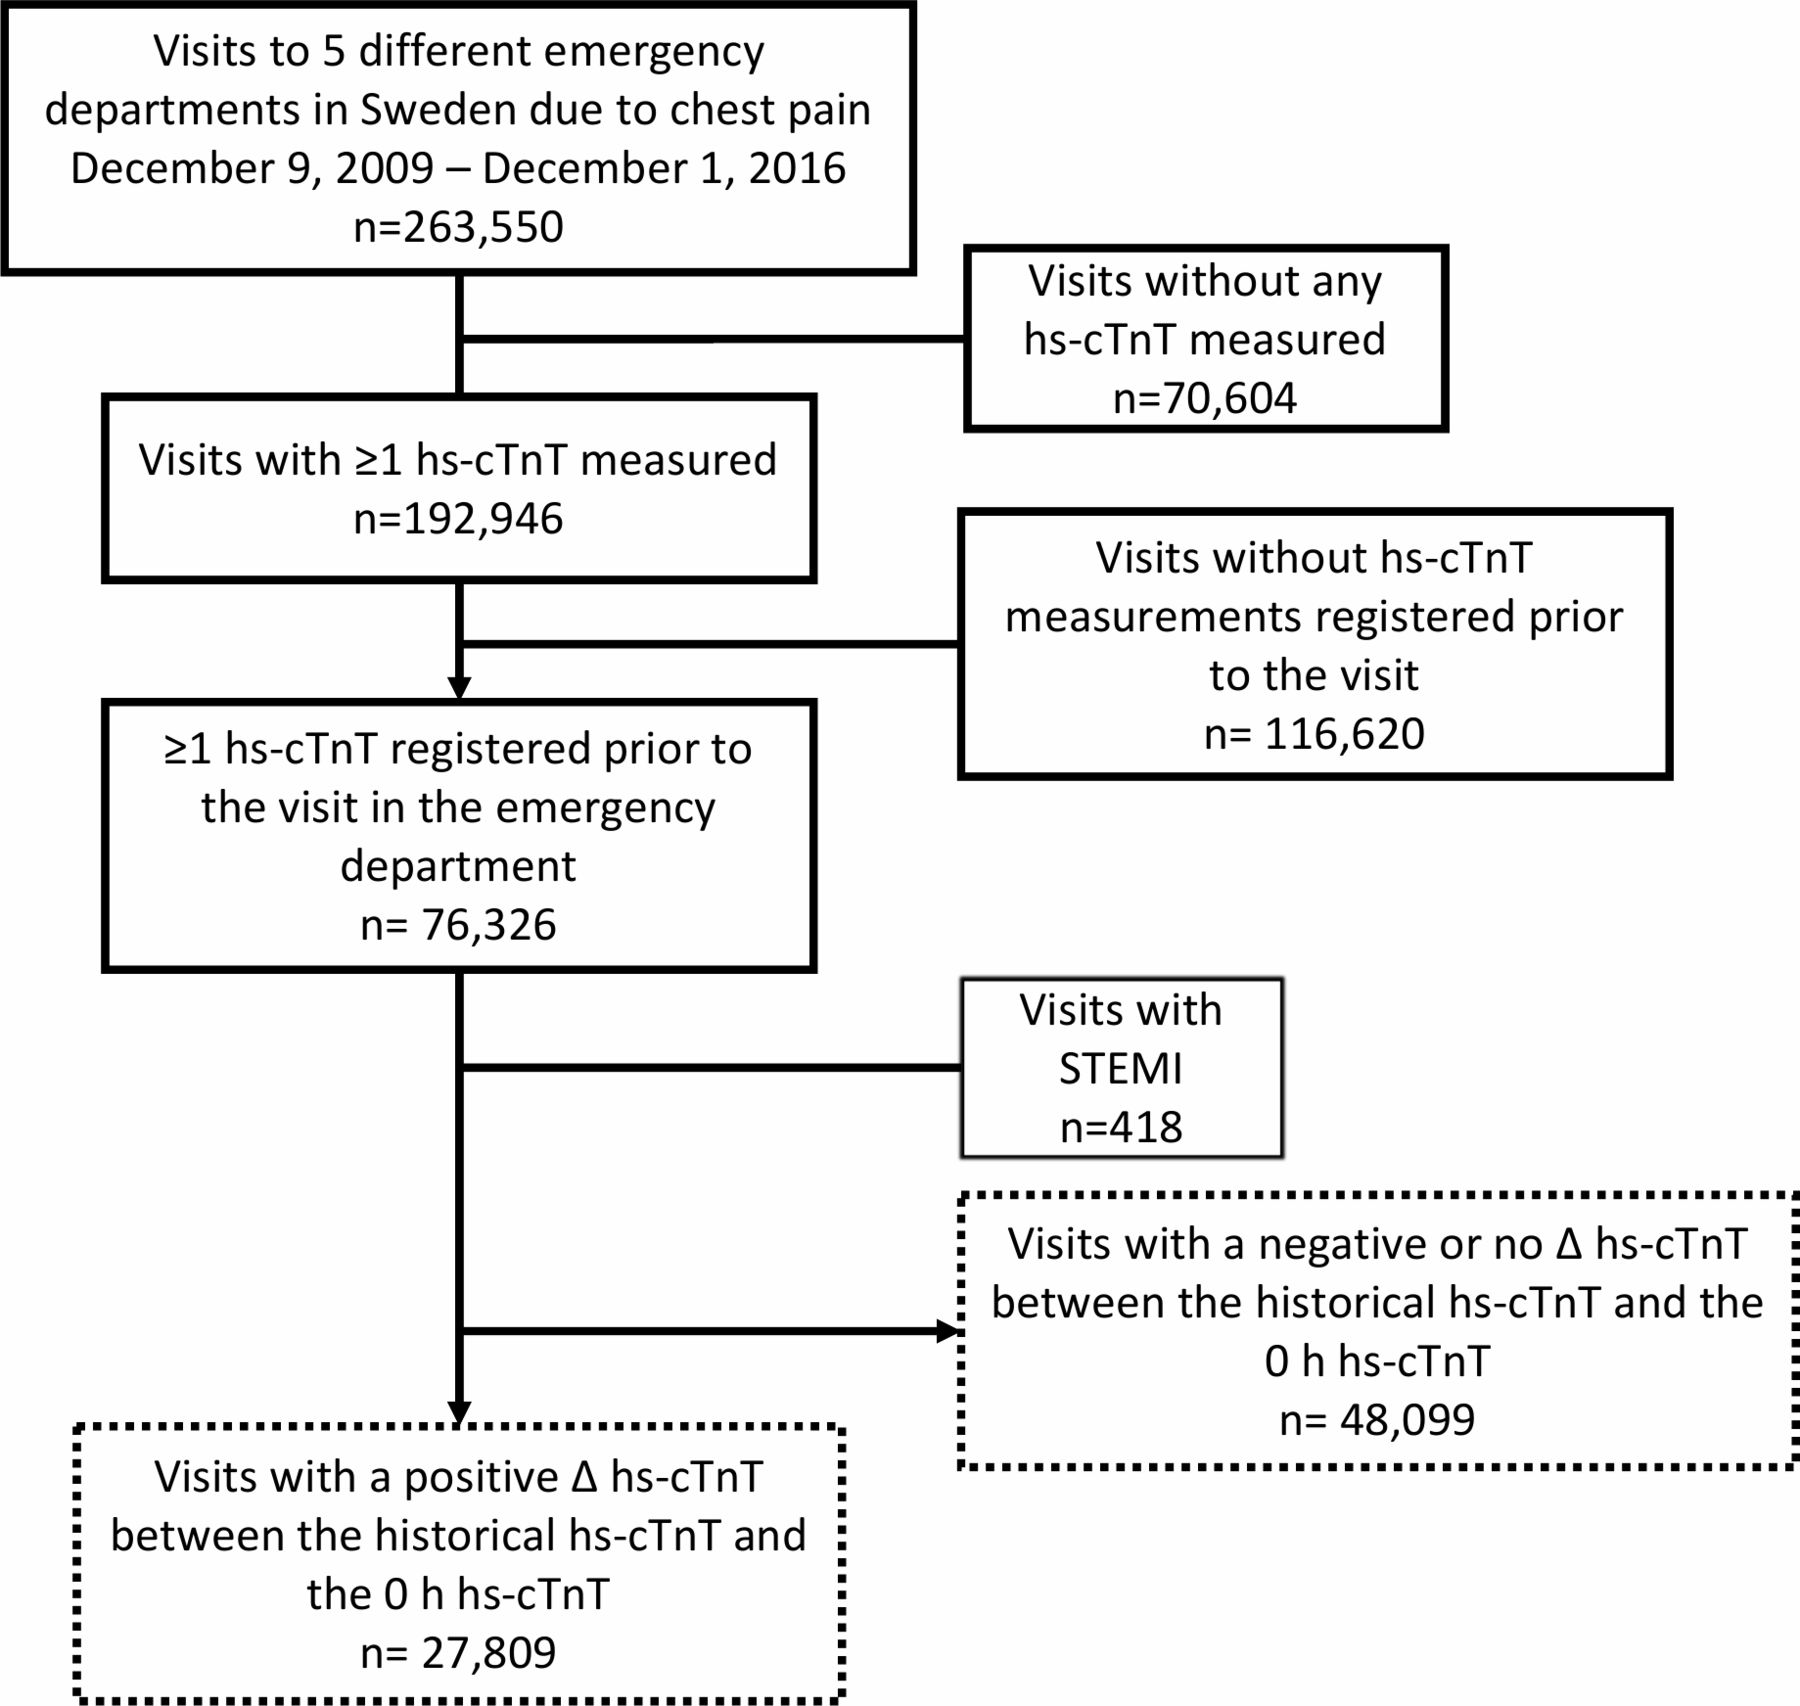
All visits with a primary complaint of chest pain were identified in the study base. After excluding visits associated with a STEMI diagnosis, we analysed all visits with at least one hs-cTnT concentration measurement, at least one historical hs-cTnT concentration measurement available, and where there was an increase between the historical hs-cTnT and the first hs-cTnT concentration measured at the ED visit (figure 1).

Selection of the study population. hs-cTnT, high-sensitivity cardiac troponin T; STEMI, ST-segment elevation myocardial infarction.
Outcomes and comorbidities
The primary outcome was an MI diagnosis within 30 days of the index date, which was defined as a discharge diagnosis from the NPR of I21 or I22, and/or as an MI diagnosis registered in the SWEDEHEART register. Secondary outcomes were all-cause mortality and cardiovascular mortality within 30 days. Cardiovascular death was defined as a cause of death in the I-chapter, or R960-R961, according to the International Classification of Disease (ICD), Revision 10. Follow-up for all outcomes ended on 31 December 2016.
Comorbidities were based on all discharge diagnoses registered before the date of the ED visit, coded according to ICD-10 in the NPR. Ongoing medication usage was defined as at least two dispensed prescriptions of a particular type during the year preceding the index date. Estimated glomerular filtration rate (eGFR) was calculated based on most recent creatinine concentration, using the Chronic Kidney Disease Epidemiology Collaboration equation.13
Definitions of hs-cTnT measurements
The 0-hour hs-cTnT was defined as the first hs-cTnT measurement at the index visit, and the historical hs-cTnT as the most recently registered hs-cTnT concentration. Hs-cTnT concentrations below the limit of detection of <5 ng/L were assigned a value of 4.9 ng/L. The relative change between the historical and the 0 hour hs-cTnT was calculated as

To explore the usefulness of combining information about the historical hs-cTnT concentration with the hs-cTnT concentrations measured at the index visit, a historical-adjusted 0-hour hs-cTnT was calculated as the product of the relative change (ie, Δhs-cTnT) and the 0-hour hs-cTnT according to the following equation:

In addition to the historical adjusted hs-cTnT, we also investigated the diagnostic performance of using only the 0-hour hs-cTnT or only the Δhs-cTnT. Different combinations of historical hs-cTnT and 0-hour hs-cTnT concentrations, with corresponding Δhs-cTnT and historical-adjusted 0-hour hs-cTnT, are presented in online supplemental table 1.
Supplemental material
Statistical analysis
The diagnostic performance of three different hs-cTnT-based diagnostic strategies for MI were evaluated, that is, using (1) only the 0-hour hs-cTnT concentration, (2) using only the relative change between the historical and admission hs-cTnT (ie, the Δhs-cTnT) and (3) using the historical-adjusted 0-hour hs-cTnT.
A cut-off value of 52 ng/L for the 0-hour hs-cTnT was used as recommended by the ESC 0/1-hour algorithm for identifying patients at a high risk of MI.8 Cut-off values for the two other hs-cTnT-based strategies were optimised according to the different measures of the receiver operational curve (ROC). Additional cut-off values were derived to meet the diagnostic performance of a cut-off for the 0-hour hs-cTnT of 52 ng/L. Separate analyses restricted to patients with a second hs-cTnT measured at the ED visit were performed.
Quantile regression was used to estimate predictors of median historical hs-cTnT and Δhs-cTnT. Logistic regression models were used to estimate the risk of primary and secondary outcomes in patients in different tertiles of relative change between the historical and the 0-hour hs-cTnT, and of historical-adjusted 0-hour hs-cTnT, respectively, using the lowest tertile as the reference. The models were run both unadjusted and adjusted for the following covariates, which were selected a priori based on clinical relevance: age, sex, eGFR, prior MI, heart failure, prior stroke, prior chronic obstructive pulmonary disease, atrial fibrillation, diabetes and treatment with cardiovascular medications. Robust SEs were used. All analyses were conducted using SAS software V.9.4.
Patient and public involvement
Patient or public involvement was not feasible or appropriate for this study.
Results
Study population
Altogether, 75 908 patient visits with historical hs-cTnT concentrations available were identified (figure 1). Among these, 27 809 (37%) visits had a positive Δhs-cTnT and were included in the analyses. A diagnosis of MI was made in conjunction with 2686 (9.7%) of these visits (figure 1, table 1). Patients with MI were older, had a lower eGFR and a higher prevalence of cardiovascular comorbidities.
Patient characteristics
Patients within the highest tertile of historical-adjusted 0-hour hs-cTnT were older and had a higher burden of cardiovascular disease compared with patients within lower tertiles (online supplemental table 2). The most common discharge diagnoses in the highest tertile were symptom diagnoses (ICD codes R00-09) followed by MI (online supplemental table 3).
Among the 48 099 (64%) patient visits where the 0-hour hs-cTnT was stable or had decreased compared with the most recent historical measurements (3.6%) MIs occurred (figure 1). Characteristics of these patients are presented in online supplemental table 4. The strongest predictor for historical hs-cTnT concentrations and Δhs-cTnT in both unadjusted and adjusted models was eGFR (online supplemental table 5).
Performance for diagnosing myocardial infarction
The overall diagnostic performance for an MI diagnosis was lower for the relative Δhs-cTnT, in pairwise comparisons) and slightly lower for the 0-hour hs-cTnT, compared with the historical-adjusted 0-hour hs-cTnT (AUC 0.80, 95% CI 0.79 to 0.81, AUC 0.84, 95% CI 0.83 to 0.85, and AUC 0.85, 95% CI 0.84 to 0.86, respectively, with p values of <0.0001 and 0.011 in pairwise comparisons with the historical-adjusted 0hour hs-cTnT) (figure 2A–C).

Receiver operating characteristic curves (ROCs) of the different hs-cTnT-based strategies for diagnosing myocardial infarction. (A) All visits. (B) vVsits with 0-hour hs-cTnT 12–51 ng/L. (C) Visits with 0-hour hs-cTnT ≥52 ng/L. hs-cTnT, high-sensitivity cardiac troponin T.
The adjusted risk of MI was increased within higher tertiles of both relative Δhs-cTnT and historical-adjusted 0-hour hs-cTnT, being 2-fold and 17-fold elevated (adjusted OR 2.08, 95% CI 1.71 to 2.52, and adjusted OR 16.7, 95% CI 14.0 to 20.0) at the intermediate and highest tertiles of historical-adjusted 0-hour hs-cTnT, respectively (figure 3).
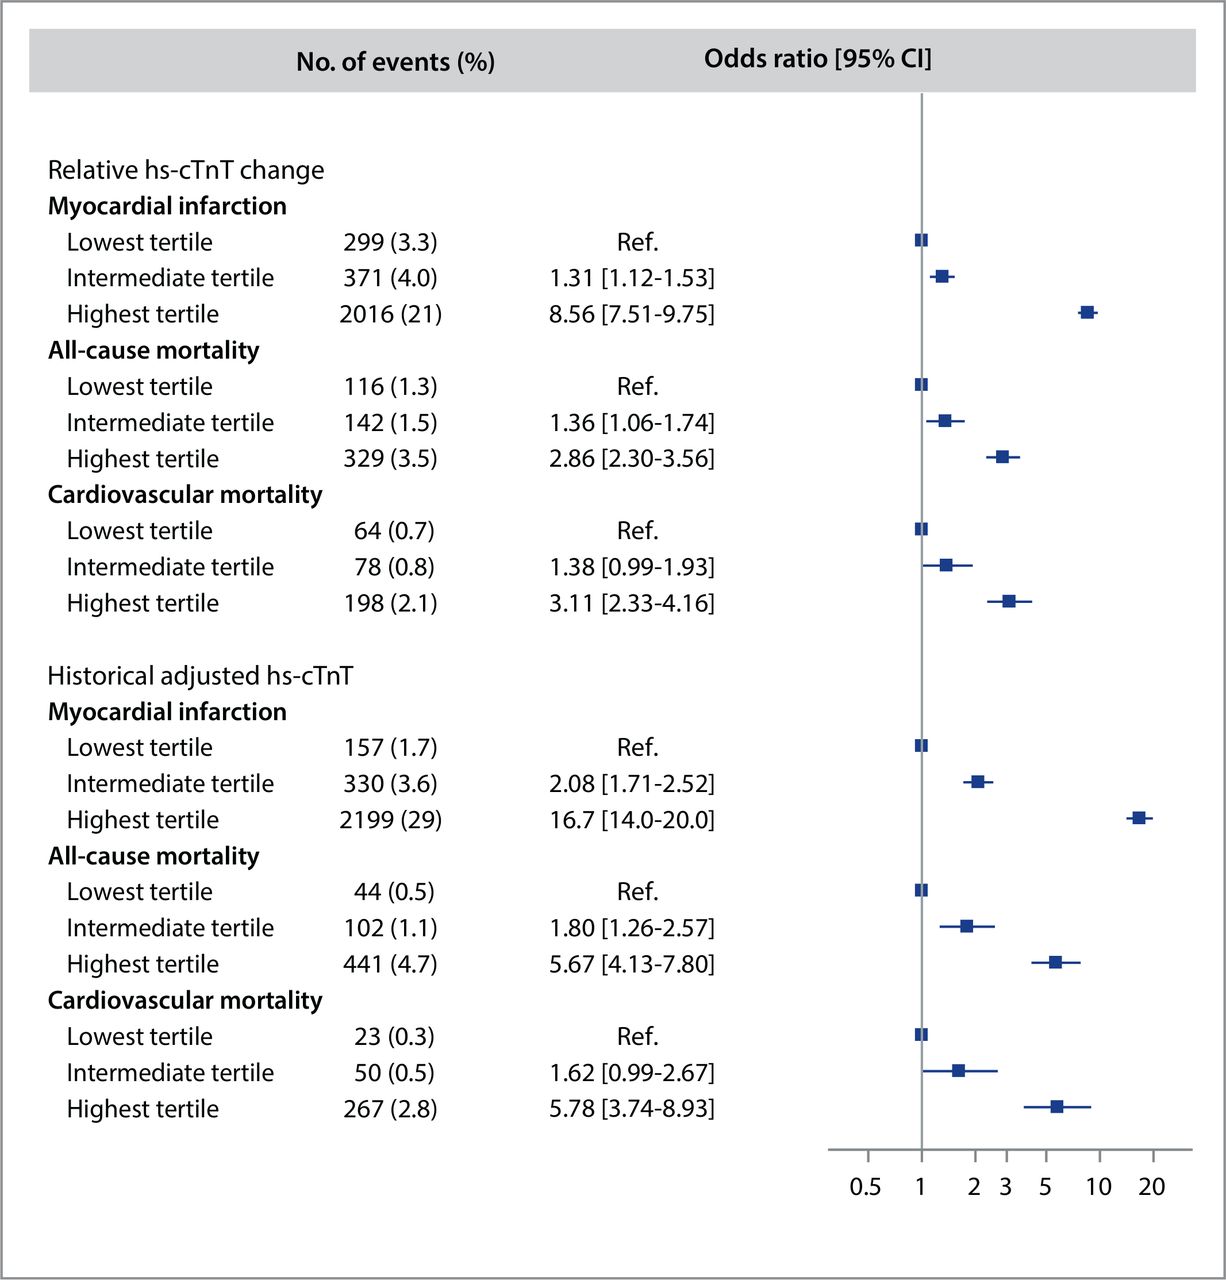
Adjusted risk of myocardial infarction, all-cause mortality and cardiovascular mortality within tertiles of relative Δhs-cTnT and historical-adjusted hs-cTnT. The model was adjusted for the following covariates: age, sex, eGFR, prior MI, heart failure, prior stroke, prior chronic obstructive pulmonary disease, atrial fibrillation, diabetes, and treatment with aspirin, P2Y12 inhibitors, oral anticoagulants, beta-blockers, angiotensin-converting enzyme inhibitor/angiotensin receptor blockers, and statins. eGFR, estimated glomerular filtration rate; hs-cTnT, high-sensitivity cardiac troponin T; MI, myocardial infarction.
A cut-off for the relative Δhs-cTnT optimised according to the Youden’s J Index yielded a specificity of 83.4 (80.3–86.6), a positive predictive value (PPV) of 30.0 (28.4–30.7) and a positive likelihood ratio (LR+) of 3.92 (3.78–4.08), while corresponding numbers for historical-adjusted 0-hour hs-cTnT concentrations were 86.0 (95% CI 82.8 to 89.4), 34.9 (95% CI 33.6 to 36.3) and 5.02 (95% CI 4.83 to 5.22), respectively (table 2).
Diagnostic performance of relative change between historical and admission hs-cTnT concentrations for myocardial infarction
Comparison of diagnostic performance
An admission hs-cTnT concentration of ≥52 ng/L identified 3629 (13%) high-risk patients, of whom 1411 (39%) had an MI, resulting in a specificity of 91.2% (95% CI 87.8 to 94.7), a PPV of 38.9 (95% CI 37.4 to 40.4) and a LR+of 5.95 (95% CI 5.73 to 6.18), respectively (table 3, figure 4). Using a cut-off value for historical hs-cTnT-adjusted admission hs-cTnT calibrated to have the same specificity (91.2%) as a cut-off of 52 ng/L for the 0-hour hs-cTnT generated a similar proportion of ‘true’ negatives, but identified a larger number of high-risk patients (3852, 14%) among whom a higher fraction suffered an MI (1642, 43%) (table 3). Thus, this strategy identified 16% more MIs (1642 vs 1411 patients) than a 0-hour hs-cTnT ≥52 ng/L. The corresponding PPV was 42.6 (95% CI 41.0 to 44.3) and the LR+ was 6.95 (95% CI 6.69 to 7.22), respectively.

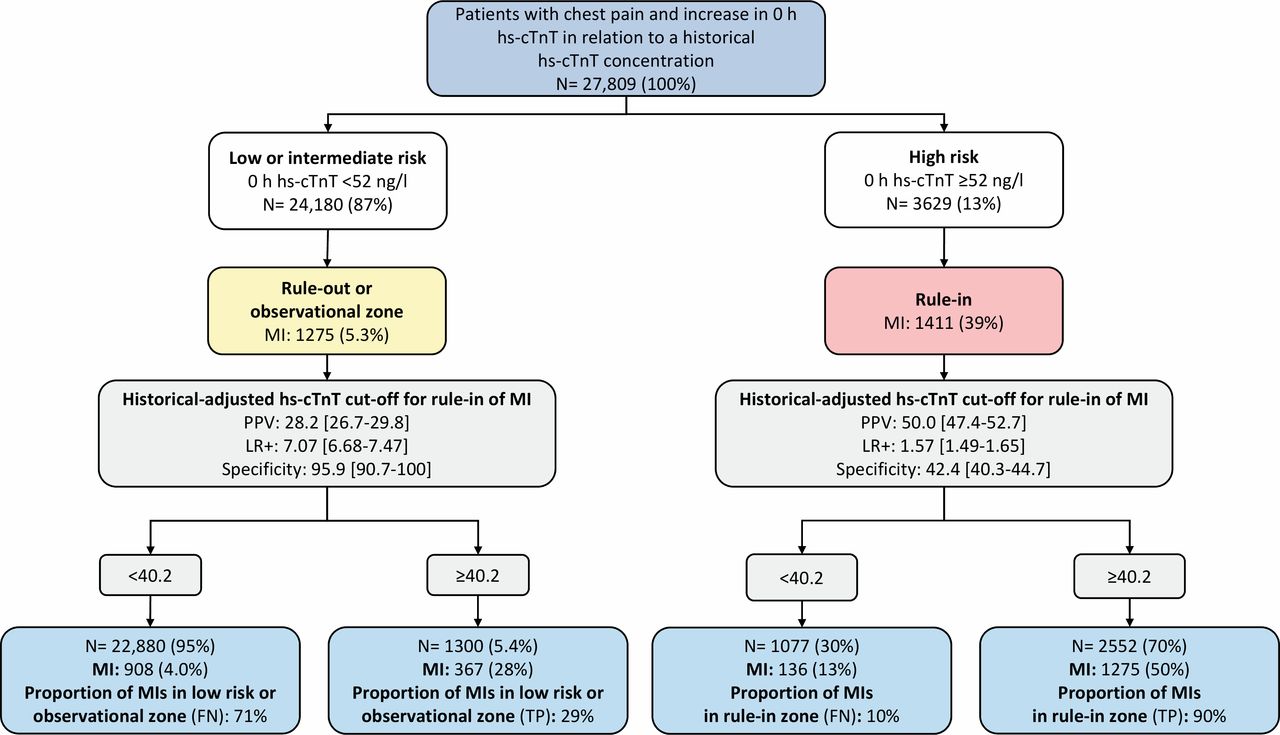
Diagnostic performance of historical-adjusted hs-cTnT for diagnosing myocardial infarction in patients risk-stratified according to the ESC 0/1-hour algorithm. The numbers are shown with percent in parentheses. Note: No patients had a very low risk according to the 0-hour hs-cTnT (ie, a 0-hour hs-cTnT <5 ng/L), as only patients with a positive Δhs-cTnT were included. FN, false negative; hs-cTnT, high-sensitivity cardiac troponin T; LR+, positive likelihood ratio; MI, myocardial infarction; PPV, positive predictive value; TP, true positive.
Diagnostic performance of different measures of hs-cTnT concentrations for myocardial infarction
A cut-off value for historical hs-cTnT-adjusted admission hs-cTnT calibrated to identify a similar proportion of high-risk patients (13%) as with an admission hs-cTnT concentration of ≥52 ng/L resulted in a specificity of 91.9 (95% CI 88.5 to 95.5), a PPV of 44.3 (95% CI 42.6 to 46.0) and a LR + of 7.43 (95% CI 7.16 to 7.72), respectively, and identified 14% more patients with MI (1608 vs 1411 patients) (table 3).
Altogether, 1275 (5.3%) MIs occurred among all other 24 180 patients assigned to low or intermediate risk according to the 0-hour hs-cTnT (figure 4). The application of a cut-off for the historical hs-cTnT-adjusted admission hs-cTnT with a similar specificity (91.2%) reclassified 1300 (5.4%) patients in the low-risk or intermediate-risk group to high-risk, of whom almost one-third (28%) had an MI. Correspondingly, this strategy identified two-thirds (70%) of patients assigned to the high-risk group according to the 0-hour hs-cTnT, in whom 50% had an MI. In a separate analysis on all patients who had a second hs-cTnT measured, this approach identified 1051 (15%) high-risk patients among those assigned to the observational zone (7025, 47%) according to the ESC 0/1-hour algorithm, and resulted in a specificity, PPV and LR + of 86.3 (77.2–96.7), 12.9 (11.6–14.5) and 3.12 (2.83–3.54), respectively (online supplemental figure 1).
All-cause mortality and cardiovascular mortality
Altogether, 587 (2.1%) patients died within 30 days of the index visit, of whom 163 (28%) had an MI at the index presentation (table 1). The adjusted risk of all-cause mortality within 30 days was almost threefold and sixfold higher in patients within the highest tertile of relative Δhs-cTnT and historical-adjusted 0-hour hs-cTnT, compared with the lowest tertile (OR 2.86, 95% CI 2.30 to 3.56, and OR 5.67, 95% CI 4.13 to 7.80, respectively) (figure 3). A total of 340 (1.2%) cardiovascular deaths occurred. The corresponding adjusted risk was most notably increased in patients within the highest tertile of historical-adjusted 0-hour hs-cTnT (OR 5.78, 95% CI 3.74 to 8.93).
In patient with a negative Δhs-cTnT>20%, 78 (5.8%) and 179 (1.2%) deaths occurred in patients with and without MI, respectively, while corresponding numbers in patients with negative Δhs-cTnT of 0% to 20% were 24 (5.9%) and 137 (0.4%) (online supplemental table 4).
Discussion
Using a large cohort of patients presenting with chest pain to the ED, we investigated different strategies for incorporating historical hs-cTnT measurements in the management of patients with chest pain. In clinical practice, more than one-third of all patients with chest pain in the ED with troponin testing have had hs-cTnT concentrations measured at prior visits.9 14
We report three major findings. First, we found that a novel hs-cTnT-based strategy that incorporated historical hs-cTnT and 0-hour hs-cTnT concentrations identified a larger number of high-risk patients, without more false positives, and concomitantly identified 4% more MIs, in absolute terms, than a 0-hour hs-cTnT of ≥52 ng/L. The currently recommended ESC 0/1-hour algorithm triage patients with a 0-hour hs-cTnT of ≥52 ng/L to high-risk group, while the majority of patients would be assigned to an observational or low-risk group.5 7 15 16 This threshold has been found to triage >10% of patients with chest pain towards rule-in with a corresponding PPV for MI of 80%, while others have reported a PPV around 70%–75% in patients who meet the rule-in criteria of the ESC 0/1-hour algorithm at 1 hour.15 17–19 The proportion of patients with a 0-hour hs-cTnT ≥52 ng/L was similar compared with that reported in a recent large multicentre diagnostic study on chest pain cohorts, although the MI incidence and concomitant PPV for MI was substantially lower.15 This observation likely reflects the effect of variable patient selection where the PPV will invariably be affected by the MI incidence among patients who undergo cardiac troponin testing in the ED.20 That said, our findings demonstrate that incorporating historical hs-cTnT measurements can improve the identification of high-risk patients, which ultimately could lead to prognostic improvements as a rapid diagnosis of MI is essential for the early initiation of evidence-based therapies.8 However, neither the 0-hour hs-cTnT or this novel approach resulted in PPV and/or LR for rule-in of MI that would motivate the use of any of these strategies alone when identifying patients eligible for early coronary angiography and possible intervention.16 Nonetheless, prior studies indicate that the addition of clinical information could improve the diagnostic accuracy of hs-cTn-based strategies.21–23 As such, it seems reasonable to believe that adding information, such as risk scores or ECG, would further improve the performance of the present strategy.
Second, we found that 5.4% of patients assigned to low-risk or intermediate-risk groups according to the 0-hour hs-cTnT were reclassified as high-risk patients with the novel strategy. Prior studies on selected chest pain cohorts have typically reported that approximately 60% and 25% of patients are triaged towards rule-out and observational zone according to the ESC 0/1-hour algorithm, with varying MI incidence in patients assigned to the latter group.5 15 16 Management of patients in the observational zone may be particularly challenging as careful considerations are needed to identify candidates suitable for invasive or non-invasive cardiac imaging.8 In the present study, almost one of three patients who were reclassified to high risk according to the novel strategy had a final MI diagnosis. Thus, historical hs-cTnT concentrations may help to discriminate patients with a high clinical likelihood of MI from those with low-to-intermediate likelihood.
Third, relative Δhs-cTnT and historical-adjusted 0-hour hs-cTnT were both associated with all-cause and cardiovascular mortality. These observations indicate that historical-adjusted 0-hour hs-cTnT could add clinical prognostic value in patients with chest pain regardless of the final diagnosis, considering that the vast majority of patients did not have an acute MI. Overall, the most common diagnoses at discharge according to ICD codes were symptom diagnoses.
The use of historical-adjusted 0-hour hs-cTnT could potentially enhance the ability to identify individuals at a high risk of cardiovascular events and death, and to target interventions aiming at reducing the corresponding risks.
Strengths
To our knowledge, this is the first study that has systematically investigated the usefulness of historical hs-cTnT concentrations to improve strategies for early rule-in of MI in the ED. The study data was obtained from validated healthcare registers with complete nationwide coverage, and thus had virtually no loss to follow-up.10 11 We had complete data on all covariates used in the statistical analyses throughout.
The study was conducted at several Swedish hospital sites in different regions and demographic environments. We believe that the ability to apply the study findings to other national hospitals and to healthcare settings in other countries with a similar healthcare level is high.
Limitations
Visits with a negative or no Δhs-cTnT were not used in the analyses, which limited the generalisability to patients with an increase between historical hs-cTnT and 0-hour hs-cTnT concentrations. The inclusion of negative Δhs-cTnT would have relied on the assumption that any Δhs-cTnT have the same diagnostic implication regardless of positive or negative change, or that there is a graded association between the Δhs-cTnT, starting from negative to positive Δhs-cTnT, and the outcome. We argue that none of these assumptions would have been appropriate. Also, the additive value of historical hs-cTnT concentrations to identify high-risk patients with a negative or no Δhs-cTnT may be limited considering that the number of MIs was rather low within this group (3.7%). Our findings indicate that such hs-cTnT concentrations may instead be helpful to identify those with low risk in whom outpatient management after ED discharge may be appropriate, preferably in selected cases among patients with no or small negative Δhs-cTnT in whom the overall observed MI risk was low (1.3%).
To mimic clinical practice and to avoid selection bias, we used the most recent hs-cTnT measurement to define the historical hs-cTnT concentration regardless of the clinical setting where it was measured. Consequently, some patients with an acute medical condition associated with myocardial injury in conjunction with the historical hs-cTnT measurement may have been incorrectly classified towards a lower risk with the novel historical approach. Thus, it is important to emphasise that some patients not assigned to the high-risk group with the novel historical approach may still be assessed as high-risk patients based on all other medical information.
Lastly, future research is warranted to explore how the findings from this study could be applied in clinical practice.
Conclusions
We found that a novel historical-hs-cTnT-based strategy improved the identification of patients with chest pain at a high risk of an evolving MI, compared with using only measurements available at the index visit. Of note, 5.4% of the patients assigned to low-risk or intermediate-risk groups were reclassified to high risk, among whom almost one of three had an MI.
Data availability statement
All data relevant to the study are included in the article or uploaded as supplementary information.
Ethics statements
Patient consent for publication
Ethics approval
This study involves human participants and was approved by the Regional Ethics Review Board in Stockholm, ID 2018/1089-31, and conformed to the ethical guidelines of the 1975 Declaration of Helsinki. Informed consent was not required to conduct this retrospective observational cohort study.
Acknowledgments
The authors would like to thank Professor Martin J. Holzmann (deceased 5 June 2021) for his prior research leadership.
References
Supplementary materials
Supplementary Data
This web only file has been produced by the BMJ Publishing Group from an electronic file supplied by the author(s) and has not been edited for content.
Footnotes
Correction notice This article has been corrected since it was first published. The open access licence has been updated to CC BY.
Contributors Both authors made substantial contribution to the study concept, design of the study protocol. The acquisition of data was conducted by AR. The authors contributed equally to the analysis and interpretation of data. The manuscript was drafted by AR, and critically revised for important intellectual content and finally approved by both authors. GE is responsible for the overall content as guarantor.
Funding No specific funding was obtained for this study. The work was supported by the Stockholm County Council (20200935 to AR), the Swedish Research Council (2017-01954 to GE) and Region Stockholm (clinical research appointment for GE). The sponsors had no role in the design or conduct of this study.
Competing interests None declared.
Patient and public involvement Patients and/or the public were not involved in the design, or conduct, or reporting or dissemination plans of this research.
Provenance and peer review Not commissioned; externally peer reviewed.
Supplemental material This content has been supplied by the author(s). It has not been vetted by BMJ Publishing Group Limited (BMJ) and may not have been peer-reviewed. Any opinions or recommendations discussed are solely those of the author(s) and are not endorsed by BMJ. BMJ disclaims all liability and responsibility arising from any reliance placed on the content. Where the content includes any translated material, BMJ does not warrant the accuracy and reliability of the translations (including but not limited to local regulations, clinical guidelines, terminology, drug names and drug dosages), and is not responsible for any error and/or omissions arising from translation and adaptation or otherwise.