Article Text

Abstract
Background The association of physical activity with the development and progression of coronary artery calcium (CAC) scores has not been studied. This study aimed to evaluate the prospective association between physical activity and CAC scores in apparently healthy adults.
Methods Prospective cohort study of men and women free of overt cardiovascular disease who underwent comprehensive health screening examinations between 1 March 2011 and 31 December 2017. Baseline physical activity was measured using the International Physical Activity Questionnaire Short Form (IPAQ-SF) and categorised into three groups (inactive, moderately active and health-enhancing physically active (HEPA)). The primary outcome was the difference in the 5-year change in CAC scores by physical activity category at baseline.
Results We analysed 25 485 participants with at least two CAC score measurements. The proportions of participants who were inactive, moderately active and HEPA were 46.8%, 38.0% and 15.2%, respectively. The estimated adjusted average baseline CAC scores (95% confidence intervals) in participants who were inactive, moderately active and HEPA were 9.45 (8.76, 10.14), 10.20 (9.40, 11.00) and 12.04 (10.81, 13.26). Compared with participants who were inactive, the estimated adjusted 5-year average increases in CAC in moderately active and HEPA participants were 3.20 (0.72, 5.69) and 8.16 (4.80, 11.53). Higher physical activity was association with faster progression of CAC scores both in participants with CAC=0 at baseline and in those with prevalent CAC.
Conclusion We found a positive, graded association between physical activity and the prevalence and the progression of CAC, regardless of baseline CAC scores.
- risk factors
- coronary artery disease
Data availability statement
Data are available upon reasonable request. The datasets generated during and/or analysed during the current study are available from the corresponding author on reasonable request.
Statistics from Altmetric.com
INTRODUCTION
Physical activity is associated with a dose-dependent reduction in the risk of metabolic disease, cardiovascular events, and cardiovascular and all-cause mortality.1 2 The 2018 Physical Activity Guidelines for Americans emphasise the central role of physical activity in promoting cardiovascular health and maintaining a healthy lifestyle, and recommend that adults engage in at least 150–300 minutes/week of moderate-intensity or 75–150 minutes/week of vigorous-intensity aerobic physical activity.3
While physical activity improves a wide array of cardiovascular and metabolic biomarkers, endurance athletes were more likely to have a coronary artery calcium (CAC) score >300 Agatston units or coronary plaques compared with sedentary men with a similar risk profile.4 Furthermore, men with high levels of physical activity, defined as more than 3000 metabolic equivalents of task (MET)-minutes/week (equivalent to running approximately 6.5 km/day or 350–400 min/week), had higher CAC scores compared with men with lower levels of physical activity.5 It is still unclear if the higher CAC scores associated with high levels of physical activity are restricted to very high levels of activity, and how current levels of physical activity affect future CAC scores. This study was conducted to evaluate the prospective association between physical activity and CAC scores in a large cohort study of apparently healthy men and women who attended repeated health screening visits.
Methods
Study population
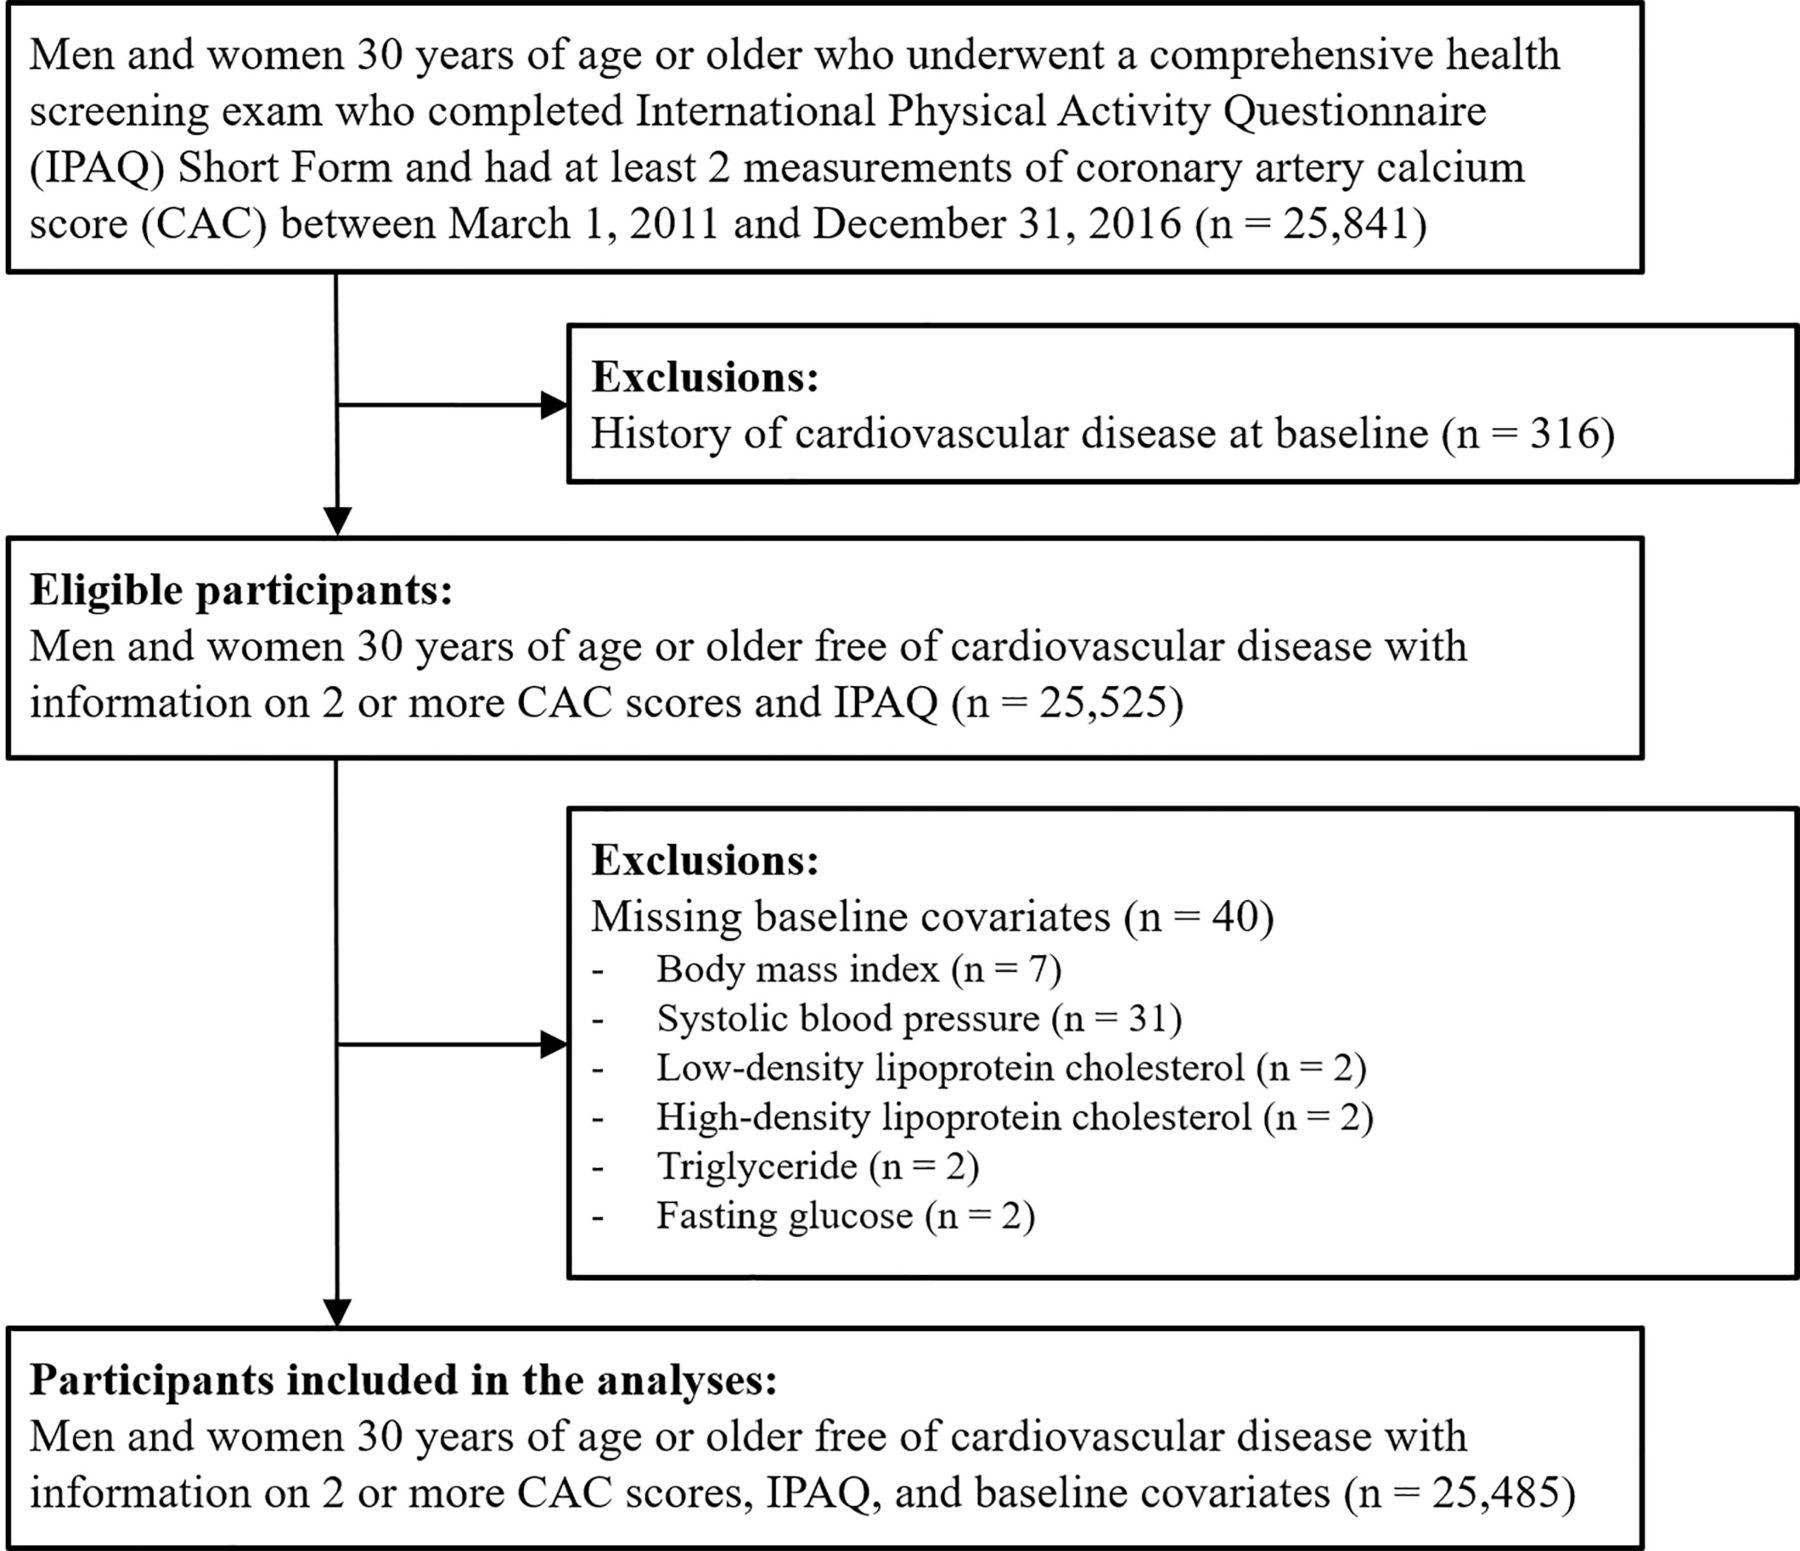
The Kangbuk Samsung Health Study is a cohort of Korean men and women ≥18 years of age who underwent comprehensive health examinations annually or biennially at the two Kangbuk Samsung Hospital Total Healthcare Centers located in Seoul and Suwon, South Korea. We included men and women ≥30 years with two or more measurements of CAC score and who had completed the International Physical Activity Questionnaire Short Form questionnaire (IPAQ-SF) between 1 March 2011 and 31 December 2017 (n=25 841). In most cases, CAC scans were available as part of the screening package contracted by the employer of the participant with the health screening centre. We excluded participants with prevalent cardiovascular disease (CVD) at the time of the first CAC measurement (n=316). We then excluded participants with missing data on body mass index (BMI), systolic blood pressure (SBP), lipid levels or fasting glucose levels at baseline (n=40). The final sample included 25 485 participants (22 741 men and 2744 women; figure 1).
Flowchart of study participants.
The Kangbuk Samsung Hospital Institutional Review Board approved the study and waived the requirement for informed consent as we only used de-identified data obtained as part of routine health screening examinations.
Data collection
At each screening visit, study participants filled out a questionnaire, which included questions on medical history, medication use, family history, smoking habits, alcohol intake, physical activity and education level. Smoking was categorised as never, former and current smoking. Alcohol intake was categorised as none, moderate (≤20 g/day for women, ≤30 g/day for men) and heavy drinking (>20 g/day for women, >30 g/day for men). Education level was categorised as ≤12 and >12 years of education. Family history of CVD was determined by self-report of heart disease or stroke in a first-degree relative. Prevalent CVD was identified by self-report of a physician diagnosis of coronary heart disease, other heart disease or stroke. Lipid-lowering medication use was also identified by self-report.
Anthropometric measurements were measured at each screening visit by trained medical personnel. BMI was calculated as weight divided by height squared (kg/m2). Hypertension was defined at the screening visit as a self-reported physician diagnosis, a self-reported use of antihypertensive medications, or a measured blood pressure ≥140/90 mmHg. Diabetes was defined as a self-reported physician diagnosis, a self-reported use of insulin or other hypoglycaemic agents, or a measured fasting serum glucose ≥126 mg/dL. Serum triglycerides, low-density lipoprotein (LDL)-cholesterol, high-density lipoprotein (HDL)-cholesterol and glucose were measured in fasting serum samples at each screening visit.
The Framingham Risk Score (FRS) for the 10-year risk of coronary events was generated using age, sex, total cholesterol, HDL-cholesterol, SBP and smoking, based on the National Cholesterol Education Programme (NCEP) Adult Treatment Panel (ATP) III algorithm. The FRS was then categorised as <10% (low risk) and ≥10% (moderate-to-high risk).6
Physical activity
The self-administered questionnaire included the validated Korean version of the IPAQ-SF, which we used to measure physical activity levels. IPAQ-SF measures the duration and frequency of physical activities (moderate to vigorous, including walking) performed in any context (ie, work, home and leisure) for over 10 consecutive minutes during a 7-day period. Physical activity was then categorised into three groups: inactive, moderately active (≥3 days of vigorous-intensity activity for ≥20 min/day, ≥5 days of moderate-intensity activity or walking for ≥30 min/day, or ≥5 days of any combination of walking and moderate- or vigorous-intensity activities attaining ≥600 MET-min/week) and health-enhancing physically active (HEPA; ≥3 days of vigorous-intensity activity attaining ≥1500 MET-min/week, or 7 days of any combination of walking, moderate- or vigorous-intensity activities attaining ≥3000 MET-min/week).7–9
Coronary artery calcium score
We measured CAC scores with a Lightspeed VCT XTe-64 slice MDCT scanner (GE Healthcare, Tokyo, Japan) at both study centres. We used the same standardised protocol with 2.5 mm slice thickness, 400 ms rotation time, 120 kV tube voltage, and 124 mAS (310 mA × 0.4 s) tube current under electrocardiographically (ECG)-gated dose modulation. CAC scores were estimated using the Agatston method.10 The intraclass correlation coefficient for CAC scores was 0.99.
Statistical analysis
P values for a linear trend in baseline participant characteristics by physical activity categories were calculated by using as predictor a continuous variable for the physical activity level (1, 2 or 3 for inactive, moderately active and HEPA, respectively) in univariable linear regression models (continuous variables) or univariable logistic regression models (dichotomous variables).
We used linear mixed models with random intercepts and slopes for follow-up time to estimate CAC scores at baseline and at 5 years as a function of baseline physical activity. The models were adjusted for age, sex, smoking, alcohol intake, education, family history of CVD, BMI, SBP, LDL-cholesterol, HDL-cholesterol, triglycerides, glucose, presence of hypertension, presence of diabetes and lipid-lowering therapy. We then estimated the 5-year change in adjusted CAC scores for each category of physical activity (inactive, moderately active and HEPA) and compared these estimates to the 5-year change in the reference category (inactive). The number of participants in the CAC 0, 1–99 and ≥100 groups after 5 years of follow-up was estimated based on the empirical Bayes estimates of random intercepts and random slopes for each individual. We performed these analyses on the progression of CAC in the entire cohort and then separately in participants with CAC >0 and CAC=0 at baseline. Moreover, because the CAC scores are right-skewed, we performed the same analysis after transforming CAC scores into loge(CAC+1). The estimates from this model were then exponentiated to obtain the geometric means of CAC scores. In addition, we estimated the 5-year progression of CAC separately for those with CAC 1–99 and CAC ≥100 at baseline.
We further estimated hazard ratios (HRs) and 95% confidence intervals (CIs) for the development of coronary calcium (incident CAC >0) by physical activity category among participants with CAC=0 at baseline (n=20 096). Because the exact date of developing coronary calcium occurs between two screening visits, we used a parametric proportional hazards model that allows for this type of interval censoring.11
Since participants had been recruited continuously into the study since 2011, only 25.8% of participants who had undergone a CAC scan had two or more CAC measurements prior to the end of the study period. To account for potential differences between participants with a single CAC measurement and those with ≥2 CAC measurements (online supplemental appendix table 1) we performed sensitivity analysis using inverse probability weights for selection. We estimated the probability of having ≥2 CAC measurements using baseline characteristics and weighted each individual by the inverse of the predicted probability of having ≥2 CAC measurements in the analyses.
Supplemental material
In addition, we performed the analyses stratified by age at baseline (<40 and ≥40 years), sex and FRS at baseline (<10% and ≥10%). Lastly, using the physical activity category defined at each health examination visit, we allowed the participant’s physical activity category to change over time as a time-varying exposure. To estimate the HRs for the development of CAC >0 in participants with CAC=0 at baseline, we used pooled logistic regression to account for both time-varying exposure and interval censoring.
All statistical analyses were performed using Stata version 16.0 (StataCorp LP, College Station, TX, USA).
Results
The mean (SD) age of study participants was 42.0 (6.1) years (table 1). The proportions of participants who were inactive, moderately active and HEPA were 46.8%, 38.0% and 15.2%, respectively. Participants with higher physical activity levels were older, less likely to be current smokers, and had lower levels of total cholesterol, LDL-cholesterol and triglycerides, higher levels of HDL-cholesterol, and higher prevalence of hypertension and presence of CAC than participants with lower physical activity levels.
Baseline characteristics by physical activity categories
Participants with CAC >0 at baseline were older, were more likely to be male and current smokers, and had higher levels of traditional cardiovascular risk factors (online supplemental appendix table 2). The median (IQR) interval between the first and the last CAC measurement was 3.0 (2.0–4.2) years.
The multivariable-adjusted average CAC scores (95% CI) in participants who were inactive, moderately active and HEPA were 9.45 (8.76, 10.14), 10.20 (9.40, 11.00) and 12.04 (10.81, 13.26) at baseline (table 2). Compared with participants who were inactive, the adjusted 5-year average increases in CAC in moderately active and HEPA participants were 3.20 (0.72, 5.69) and 8.16 (4.80, 11.53). Among participants with CAC >0 at baseline (n=5389), the estimated differences in 5-year average increase in CAC in moderately active and HEPA participants compared with inactive participants were 7.70 (–3.72, 19.11) and 15.05 (0.56, 29.49), respectively (table 3), and among participants with CAC=0 at baseline (n=20.096), the estimated differences were 0.17 (–0.18, 0.52) and 0.32 (–0.16, 0.81), respectively (table 4). Based on our results, we estimated 800 (3.1%), 23 051 (90.5%) and 1634 (6.4%) participants would be in the CAC 0, 1–99 and ≥100 groups after 5 years of follow-up.
Five-year progression of coronary artery calcium by physical activity categories at baseline
Five-year progression of coronary artery calcium (CAC) by physical activity categories among participants with prevalent CAC (CAC >0) at baseline
Five-year progression of coronary artery calcium (CAC) by physical activity categories among participants with no CAC (CAC=0) at baseline
Among participants with CAC=0 at baseline (median follow-up 3.1 years; maximum follow-up 6.7 years), compared with participants who were inactive, the multivariable-adjusted HR (95% CI) for developing CAC >0 in participants who were moderately active and HEPA were 1.04 (0.94, 1.15) and 1.21 (1.05, 1.38; p for trend=0.01), respectively (Model 5, table 5).
Hazard ratios (95% confidence intervals) for the development of coronary artery calcium (CAC) (CAC >0) among participants with no coronary calcium (CAC=0) at baseline
The results did not change materially for the analyses using inverse probability weights to account for potential differences between participants with a single CAC measurement and those with ≥2 CAC measurements (online supplemental appendix tables 3–6) or when we used log-transformed CAC scores (online supplemental appendix table 7). In analysis stratified by age, sex and FRS at baseline, the positive association between physical activity and estimated difference in 5-year average increase in CAC scores was observed in participants ≥40 years (p<0.001), in both men and women (p<0.001 and p=0.002), and in both participants with FRS <10% and ≥10% (p=0.009 and p<0001). The risk of developing CAC >0 was highest in the HEPA group in all subgroups except among participants <40 years (online supplemental appendix tables 8–13). When CAC >0 at baseline was further categorised into CAC 1–99 and CAC ≥100, higher physical activity was associated with greater difference in 5-year change (p=0.06) among those with CAC 1–99 at baseline (online supplemental appendix table 14). However, the number of participants with CAC ≥100 was too small to provide precise estimates. The results did not change further when physical activity level was allowed to change over time (online supplemental appendix tables 15–18).
Discussion
In this large prospective study of apparently healthy men and women, physical activity was associated with a higher prevalence of CAC at baseline and with a faster progression of CAC over follow-up. The association was graded across categories of increased physical activity, and it was observed both in participants free of CAC at baseline and in those with prevalent CAC. The association persisted after we adjusted for BMI, blood pressure and lipid levels, all potential mediators of the cardiovascular benefits of physical activity. Our findings should not be interpreted as a harmful effect of physical activity, but, rather, need to be taken into account when evaluating the progression of CAC in patients who exercise to reduce cardiovascular risk.
The cardiovascular benefits of physical activity are unquestionable.3 The 2018 Physical Activity Guidelines for Americans recommend at least 150–300 minutes/week of moderate-intensity or 75–150 minutes/week of vigorous-intensity aerobic physical activity.3 Regular physical activity reduces the risk of many adverse health outcomes, including mortality, CVD, diabetes, hypertension, obesity and dyslipidaemia.12–14 Some health benefits occur almost immediately after physical activity and, in general, there are additional health benefits with higher levels of physical activity. For example, in a study of 130 000 participants from high-, middle- and low-income countries, higher physical activity levels were associated with lower incidence of all-cause mortality and major CVD.15 In addition to the benefits of high-intensity physical activity, even small increments in physical activity are beneficial in sedentary subjects.
High levels of physical activity, however, may be associated with a higher risk of coronary artery calcification. In a meta-analysis, higher physical activity levels were associated with a higher prevalence of CAC (pooled odds ratio (OR) 1.84; 95% CI 1.41 to 2.93).16 In the Coronary Artery Risk Development in Young Adults (CARDIA) study, white young adults who exercised three or more times the recommended amount in the Physical Activity Guidelines had almost twice the prevalence of CAC >0 compared with those who exercised at levels below the Guidelines (OR 1.80; 95% CI 1.21 to 2.67).17 Older adults in the highest tertile of self-reported physical activity in the Whitehall II study also had a higher prevalence of CAC compared with those in the lowest tertile of physical activity18 and, among athletes, the most active group (>2000 MET-min/week) had a higher prevalence of CAC >0 and higher CAC scores compared with the least active group (<1000 MET-min/week).19 Finally, in the Coopers Clinic Study, there was only a modest and non-statistically significant association between physical activity levels and CAC scores ≥400, but physical activity was still inversely associated with all-cause mortality, particularly in the subgroup of participants with CAC scores ≥400 at baseline.20 21
A possible mechanism underlying this association is that physical activity may increase coronary atherosclerosis. Potential pathways include mechanical stress and vessel wall injury of coronary arteries,22 physiological responses during exercise, such as increased blood pressure,23 increased parathyroid hormone levels24 and changes in coronary haemodynamics and inflammation.25 In addition, other factors, such as diet, vitamins and minerals, may change with physical activity.26
The second possibility is that physical activity may increase CAC scores without increasing CVD risk. The standard Agatston CAC scores are calculated as a combination of calcium density and the volume of plaque burden. Higher calcium density, which suggests more stable, calcified plaque, produces a higher CAC score, however, it is associated with lower CVD risk.10 In the Multi-Ethnic Study of Atherosclerosis, when CAC volume and density were analysed separately, recreational physical activity was positively associated with CAC density but not with CAC volume after controlling for CAC density. However, higher levels of recreational physical activity were inversely associated with incident CVD independent of CAC density and volume, possibly through stabilisation of coronary plaques.27 Moreover, in a study of healthy athletes, more active participants had a more benign plaque composition with fewer mixed plaques and more often only calcified plaques, also suggesting that exercise may contribute to the stabilisation of atherosclerotic plaques.19
In general, progression of CAC scores is associated with a higher risk of CVD among individuals with CAC=0 and those with CAC >0.28 Moreover, the absence of detectable CAC is a strong negative predictor of CVD,29 whereas the presence of any CAC, even at very low levels, is associated with an increased risk of CVD.30 However, considering the undeniable protective effect of physical activity on CVD, the positive relationship between physical activity with CAC progression should be interpreted with caution as the complex interplay between physical activity, CAC progression and subsequent CVD risk remains largely unknown.
In most previous studies the association of physical activity and CAC scores had been evaluated in cross-sectional analyses. Our study provides evidence that participants with higher levels of physical activity at baseline not only have higher CAC scores, but are more likely to develop CAC in the future. In our analysis, the positive association of physical activity with progression of CAC was graded across categories of physical activity and was not restricted to participants with extreme levels of physical activity. This association may be clinically relevant, as patients who increase their exercise levels for CVD prevention may be discouraged by increasing CAC scores, despite the unquestionable beneficial effects of physical activity on morbidity and mortality. Increasing CAC score, however, may be an indication of stabilising atherosclerotic plaque and warrants careful interpretation.
There are several limitations to consider in the interpretation of our findings. First, physical activity was measured by a self-reported questionnaire and we did not have an objective assessment of physical activity. While we used a validated questionnaire for assessing physical activity, it is still subject to substantial measurement error, most likely overestimating physical activity levels. Misclassification in physical activity, however, is likely non-differential with respect to CAC scores and will tend to underestimate observed associations. Second, we could not evaluate the association between physical activity and CAC levels with incident cardiovascular events as the information was not available. This association is likely complex and will require long-term follow-up of large cohorts. Third, we did not have information on CAC density or volume in our dataset. A more refined measurement of CAC will provide a better understanding of the association between physical activity, CAC progression and subsequent CVD risk. Fourth, as an observational study, we may not have fully accounted for the baseline differences in the participant characteristics and the potential for residual confounding remains. Finally, our study population was comprised of apparently healthy, low-risk, young to middle-aged Korean men and women, and our findings may not generalise to other risk or race/ethnicity groups.
In conclusion, we identified a positive, graded association between physical activity with the prevalence and the progression of coronary calcium scores. Although the implications of a positive association between physical activity and CAC in terms of cardiovascular events need to be established in future studies, our findings do not question the well-established cardiovascular benefits of physical activity. Patients and physicians, however, need to consider that engaging in physical activity may accelerate the progression of coronary calcium, possibly due to plaque healing, stabilisation and calcification.
Key messages
What is already known about this subject?
While physical activity improves a wide array of cardiovascular and metabolic biomarkers, the association between physical activity and progression of coronary artery calcium (CAC) scores is unclear.
What does this study add?
The estimated adjusted 5-year increase in CAC was higher in participants engaged in moderate physical activity or health-enhancing physical activity compared with those who were inactive. The progression of CAC was faster with higher physical activity.
How might this impact on clinical practice?
Engaging in physical activity may accelerate the progression of CAC, possibly due to plaque healing, stabilisation and calcification.
Data availability statement
Data are available upon reasonable request. The datasets generated during and/or analysed during the current study are available from the corresponding author on reasonable request.
Ethics statements
Patient consent for publication
Acknowledgments
We are grateful for the efforts of the health screening group at Kangbuk Samsung Hospital, Seoul, South Korea.
References
Supplementary materials
Supplementary Data
This web only file has been produced by the BMJ Publishing Group from an electronic file supplied by the author(s) and has not been edited for content.
Supplementary Data
This web only file has been produced by the BMJ Publishing Group from an electronic file supplied by the author(s) and has not been edited for content.
Footnotes
K-CS and YSH contributed equally.
Contributors KS contributed to the study conception and design. YSH drafted the original manuscript. JL, SL, YC, SR, DZ and JC critically revised the manuscript. EG and JACL contributed to the acquisition, analysis and interpretation of the study data.
Funding The authors have not declared a specific grant for this research from any funding agency in the public, commercial or not-for-profit sectors.
Competing interests None declared.
Provenance and peer review Not commissioned; externally peer reviewed.
Supplemental material This content has been supplied by the author(s). It has not been vetted by BMJ Publishing Group Limited (BMJ) and may not have been peer-reviewed. Any opinions or recommendations discussed are solely those of the author(s) and are not endorsed by BMJ. BMJ disclaims all liability and responsibility arising from any reliance placed on the content. Where the content includes any translated material, BMJ does not warrant the accuracy and reliability of the translations (including but not limited to local regulations, clinical guidelines, terminology, drug names and drug dosages), and is not responsible for any error and/or omissions arising from translation and adaptation or otherwise.