Article Text

Abstract
Cardiovascular disease (CVD) presents a significant burden to the UK. This review presents data from nationally representative datasets to provide up-to-date statistics on mortality, prevalence, treatment and costs. Data focus on CVD as a whole, coronary heart disease (International Classification of Diseases (ICD):I20–25) and cerebrovascular disease (ICD:I60–69); however, where available, other cardiovascular conditions are also presented. In 2012, CVD was the most common cause of death in the UK for women (28% of all female deaths), but not for men, where cancer is now the most common cause of death (32% of all male deaths). Mortality from CVD varies widely throughout the UK, with the highest age-standardised CVD death rates in Scotland (347/100 000) and the North of England (320/100 000 in the North West). Prevalence of coronary heart disease is also highest in the North of England (4.5% in the North East) and Scotland (4.3%). Overall, around three times as many men have had a myocardial infarction compared with women. Treatment for CVD is increasing over time, with prescriptions and operations for CVD having substantially increased over the last two decades. The National Health Service in England spent around £6.8 billion on CVD in 2012/2013, the majority of which came from spending on secondary care. Despite significant declines in mortality in the UK, CVD remains a considerable burden, both in terms of health and costs. Both primary and secondary prevention measures are necessary to reduce both the burden of CVD and inequalities in CVD mortality and prevalence.
This is an Open Access article distributed in accordance with the Creative Commons Attribution Non Commercial (CC BY-NC 4.0) license, which permits others to distribute, remix, adapt, build upon this work non-commercially, and license their derivative works on different terms, provided the original work is properly cited and the use is non-commercial. See: http://creativecommons.org/licenses/by-nc/4.0/
Statistics from Altmetric.com
Introduction
Cardiovascular disease (CVD) is the leading cause of death worldwide.1 The 2013 Global Burden of Disease Study estimated that almost 30% of all deaths worldwide were caused by CVD. However, recent evidence from Europe suggests that in some countries cancer has overtaken CVD as the leading cause of death.2 Over the last decade, survival from myocardial infarction (MI) has improved in England.3 The last decade has also seen changes in the number of prescriptions prescribed to treat various CVD conditions and the types of surgeries to treat MIs.
This review is based on the Cardiovascular Disease Statistics 2014 report.4 This is the 19th edition of the report published by the British Heart Foundation. These reports aim to provide up-to-date statistics on CVD, coronary heart disease (CHD) and stroke in the UK. It is aimed at health professionals, medical researchers and others with an interest in CVD. In this review, we present selected data on CVD mortality, morbidity, treatment and costs in the UK, with additional data available in online supplementary files. Data in this review focus on CVD (International Classification of Diseases (ICD)10:I00–99), CHD (ICD10:I20–25) and stroke (ICD10:I60–69). Where available and appropriate, we have also included data on the major conditions within the WHO ICD10 subchapters for CVD.
Methods
We use a number of data sources to provide information on the mortality, morbidity and treatment of CVD. We aim to provide UK data; when this was not possible, we have provided information separately for the countries of the UK. The three main considerations when selecting data sources were the representativeness of data, its quality and the year of collection.
Mortality data from 2012 were provided by the Office for National Statistics (ONS), the National Records of Scotland and the Northern Ireland Statistics and Research Agency. We calculated age-standardised death rates using the 2013 European Standard Population. Mortality data are routinely collected in the UK, and it is a legal requirement to report a death that occurs in England, Wales, Scotland or Northern Ireland. Consequently, mortality data are representative of the entire UK population, are published annually and are considered high-quality data.
We obtained prevalence data from the Clinical Practice Research Datalink (CPRD) GOLD database, which is the world's largest validated computerised database of anonymised records for primary care.5 The CPRD GOLD database collates records from a widely used General Practice software system and covers approximately 8.8% of the UK population. CPRD data are regarded to be high quality and are updated on a monthly basis.5 Prevalence is calculated by dividing the number of cases by the patient population. We also used data from the Quality and Outcomes Framework (QOF) to estimate prevalence by Government Office Region and country. This framework became part of general practice contracts in 2004 and rewards general practitioners for keeping up-to-date records of the number of patients within their practices who are suffering from certain conditions. Prevalence data from QOF is updated annually and uses the list size of a general practice as the denominator. This means that changes in the registered population may affect the representativeness of the prevalence estimates between years.
Data on inpatient episodes due to CVD, CHD, stroke and other CVD conditions are from Hospital Episode Statistics (HES), published by national agencies of England, Wales, Scotland and Northern Ireland. An episode is defined as the main diagnosis attributed to a patient when they are discharged from hospital. This data may include multiple hospital episodes for one person over the course of the year and does not include people who die before reaching hospital. HES data are updated monthly and collected from all people who are seen by a consultant in hospital; therefore, they are representative of the hospitalised population. There have been concerns over the quality of HES data due to lack of clinician engagement in the process of reporting and coding;6 however, this is currently the best nationally representative source of inpatient data.
Data on revascularisations are published by the British Cardiovascular Intervention Society (BCIS) and are updated annually. We report on trends in percutaneous coronary interventions (PCIs) and coronary artery bypass grafts (CABGs). The BCIS conducts an annual audit of revascularisation procedures in the UK and >97% of PCI cases are included in the audit.7
Prescription data come from Prescription Costs Analysis (PCA) reports published by the ONS, the Welsh Government, the Information Services Division in Scotland and the Business Services Organisation in Belfast. PCA data represent all prescriptions prescribed in the community and are updated annually. The data are classified using the therapeutic groups of the British National Formulary. Data on the percentage of individuals taking certain prescriptions are collected by the Health Survey for England (HSE). The health surveys of Wales, Scotland and Northern Ireland do not collect this data. The HSE is a cross-sectional annual survey that aims to be representative of people living in private households in England; it uses a stratified random probability sample of private households to achieve this. Information on prescriptions is collected during a nurse visit, which is preceded by a general interview. In the 2013 survey, the response rate for all sampled households was 58% for the general interview and 40% for the nurse visit.
Cost data for England come from programme budgeting data, an analysis of commissioning expenditure by healthcare condition (eg, circulatory disease) and care setting (eg, primary, secondary, community). Estimates of expenditure are calculated using the price paid for specific activities and services purchased from healthcare providers for each region. Regions follow standard guidance, procedures and mappings when calculating programme budgeting data. Around 80% of planned National Health Service (NHS) funding in England is allocated to Primary Care Trusts (this will now change to Clinical Commissioning Groups), who are then free to commission local health services to meet local needs.8
Mortality
In 2012, for the first time since the middle of the 20th century,9 CVD went from being the main cause of death to the second cause of death in the UK. Twenty-eight per cent of deaths were caused by CVD in 2012, and 29% were caused by cancer. When analysed by sex, however, CVD was still a larger cause of death than cancer for women, but this was no longer the case for men (figure 1).

Deaths by cause and sex, UK. This figure compiles data from the four countries of the UK. In Northern Ireland, the data for lung cancer only includes International Classification of Diseases-10 code C34. Adapted from England and Wales, Office for National Statistics (2014) Deaths registered by cause, sex and age. http://www.statistics.gov.uk (accessed January 2014); Scotland, National Records of Scotland (2014) Deaths, by sex, age and cause. http://www.gro-scotland.gov.uk (accessed January 2014); Northern Ireland, Statistics and Research Agency (2014) Registrar General Annual Report. NISRA: Belfast.
The main causes of CVD death are CHD and stroke. In 2012, 46% of CVD deaths were from CHD and 26% were from stroke. Overall, CHD was responsible for 16% of all male deaths and 10% of all female deaths, a total of just under 73 500 deaths. Around 41 000 deaths were from stroke, making up 6% and 9% of total deaths in men and women, respectively (figure 1).
In this review, we treat deaths before the age of 75 as premature. More than one quarter of premature deaths in men and around 18% of premature deaths in women were from CVD in 2012 (see online supplementary tables). In total that year, there were nearly 42 000 premature deaths from CVD in the UK. CHD by itself was the most common single cause of premature death in the UK in men, responsible for about 15% of premature male deaths in 2012. In women, CHD caused around 8% of premature deaths.
Regional variations in mortality
Age-standardised CVD mortality rates by local authority showed a clear trend for higher CVD rates in Scotland and the North of England and lower CVD rates in the South of England. Glasgow City had the highest CVD mortality rate for both premature mortality (144/100 000 population) and mortality at all ages (400/100 000 population). Half of all the local authorities with the 10 highest CVD mortality rates in the UK were in Scotland, four were in the North of England and one was in Wales (table 1). Age-standardised CVD mortality rates were highest in Scotland in 2012 at 347/100 000 population and lowest in the South West of England at 269/100 000 population (see online supplementary data).
Rankings for 10 local authorities with highest cardiovascular disease mortality rates and 10 local authorities with the lowest cardiovascular disease mortality rates, UK 2010/2012
Prevalence
We obtained prevalence data by age through the CPRD GOLD database. Obtaining data from this database is prolonged and expensive; therefore, it was not possible to provide data for conditions within other ICD10 subchapters. Throughout the UK, prevalence of MI in men was almost three times greater than for women in 2013. Applying country-specific and age-specific population estimates, obtained from the national statistics agencies, to prevalence data from the CPRD GOLD database suggests that >915 000 people in the UK have suffered an MI and >1.3 million are living with angina. Consequently, if we combine estimates for MI and angina, we find that almost 2.3 million people in the UK are living with some form of CHD. Applying prevalence figures for heart failure to population estimates suggests that there are >308 000 men and 250 000 women in the UK living with heart failure. Using the same method, we estimate that 1.1 million people are living with atrial fibrillation in the UK (table 2).
Prevalence of cardiovascular conditions, UK 2013
Regional variations in prevalence
Estimates of the number of people in the UK who have CVD, derived from the CPRD GOLD database, are broadly supported by results from the QOF. QOF data suggest that in 2012/2013 there were around 2.3 million people suffering from CHD, 1.2 million people suffering from stroke, around 1 million from atrial fibrillation and just over 480 000 from heart failure. QOF only measures certain cardiovascular conditions; therefore, prevalence data are not available for all ICD10 chapters.
Comparing between regions in England, those in the North had a higher prevalence for CVD than the those in the South, with the highest prevalence reported in the North East for all diseases described here (4.5% for CHD, 2.1% for stroke). London had the lowest prevalence for all (2.1% for CHD, 1.0% for stroke). For CHD, the North East, North West and Yorkshire and The Humber all had a prevalence of 4% or higher. Among UK countries, England had the lowest prevalence for all cardiovascular conditions (3.4% for CHD, 1.7% for stroke) except hypertension (13.6%), for which Northern Ireland was lowest (12.9%). Scotland had the highest prevalence for CHD (4.3%), stroke (2.1%) and peripheral arterial disease (0.9%), while Wales had the highest for hypertension (15.5%), heart failure (0.9%) and atrial fibrillation (1.8%). It should be noted that these rates have not been adjusted to account for differences in the age structure of populations (table 3).
Prevalence of selected long-term conditions by Government Office Region for England and by country England, Scotland, Wales, Northern Ireland and UK 2012/2013
Inpatient episodes
In the UK, there were >1.6 million episodes related to CVD in NHS hospitals, accounting for 10.1% of all inpatient episodes among men and 6.3% among women. The proportion of inpatient episodes attributed to CHD was almost twice as high among men as among women, accounting for 3.5% of all inpatient episodes in men and 1.5% in women in the UK. Stroke accounted for around 1.1% of inpatient episodes in women and 1.2% in men in the UK. As a proportion of all conditions, stroke accounts for about 1.1% of all hospital episodes in the UK (table 4).
Inpatient episodes by main diagnosis in National Health Service Hospitals, by sex, UK 2012/2013
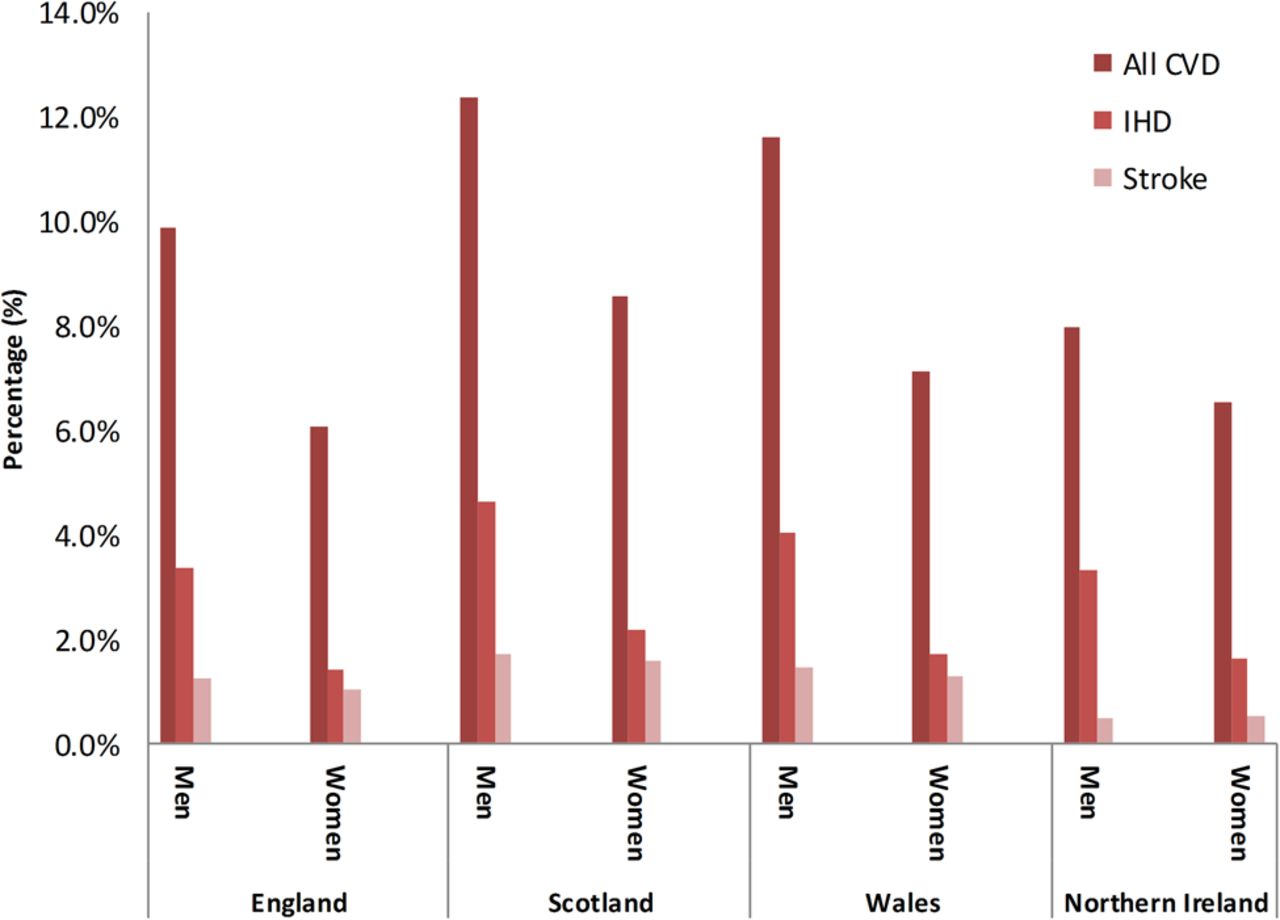
The highest proportion of inpatient episodes for all CVD were in Scotland (12.4% of men and 8.6% of women). The lowest proportion of CVD inpatient episodes were in Northern Ireland for men (8.0%) and in England for women (6.1%) (figure 2). Northern Ireland had the lowest proportion of inpatient episodes for stroke (0.5% for both men and women), and Scotland had the highest proportion (1.7% for men and 1.6% for women).

Percentage of all inpatient episodes for selected cardiovascular conditions, by sex and country of the UK, 2012/2013. Adapted from Department of Health (2013). Hospital Episode Statistics 2012/2013. http://www.hesonline.nhs.uk (accessed January 2014); Information Services Division Scotland (2015) Main diagnosis discharges from hospital 2012/2013. Personal correspondence; NHS Wales Informatics Service (2013). The Patient Episode Database for Wales—2012/2013. http://www.infoandstats.wales.nhs.uk (accessed January 2014); Hospital Information Branch (2012). Northern Ireland Episode Based Acute Inpatient and Day Case Activity Data (2012/2013) http://www.dhsspsni.gov.uk (accessed January 2014). Personal correspondence. CVD, cardiovascular disease; IHD.
Prescriptions
Prescription data is not available for the UK as a whole; therefore, we present England data here (table 5) and data for the other UK countries in online supplementary tables. The rapid increase in the number of prescriptions for the treatment and prevention of CVD began in the late 1980s. In 2013, >300 million prescriptions were dispensed for CVD in England, more than six times as many as issued in 1981, and an increase of 2.2% from the number of prescriptions in 2012. Since 1990, the number of prescriptions dispensed for antiplatelet drugs has increased steadily; there are now >38 million prescriptions for antiplatelet drugs in England every year. The increase in the number of prescriptions of lipid-lowering drugs was slow until the late 1990s, but since then has been very rapid, with the number of prescriptions for lipid-lowering drugs now more than six times higher than in 2000. HSE data show that 16% of men and 12% of women report being prescribed lipid-lowering medicines. Also, 14% of men and 15% of women reported being prescribed antihypertensives specifically for hypertension (figure 3).
Prescriptions used in the prevention and treatment of cardiovascular disease, England 1981–2013

Percentage of individuals aged 16 and over taking cardiovascular-related prescriptions, by sex, England 2012–2013. Medicines are included in the ‘Anti-hypertensive medicines’ category only if they were specifically prescribed for hypertension. Adapted from Joint Health Surveys Unit. Health Survey for England 2013. London: Health and Social Care Information Centre 2014.
Operations
The total number of operations carried out to treat CHD is increasing in the UK. The number of PCIs carried out in the UK in 2012 was more than two times higher than a decade earlier; >90 000 procedures were carried out in 2012 in the UK. The number of CABGs reached a peak in the late 1990s/early 2000s. CABGs have become less common due to the more widespread use of less-invasive procedures such as PCIs. Just under 17 000 CABGs were carried out in the UK in 2012 (figure 4) and >6000 carotid endarterectomies in 2011/2012 (see online supplementary tables).

Number of coronary artery bypass operations and percutaneous coronary interventions per year, UK 1980 to 2012. Operations performed in NHS hospitals and selected private hospitals are included. Adapted from British Cardiovascular Intervention Society (2013). BCIS Audit returns. Personal communication; The Society for Cardiothoracic Surgery in Great Britain and Ireland (2014). http://bluebook.scts.org/#ActivityRates (accessed in March 2014).
costs of CVD
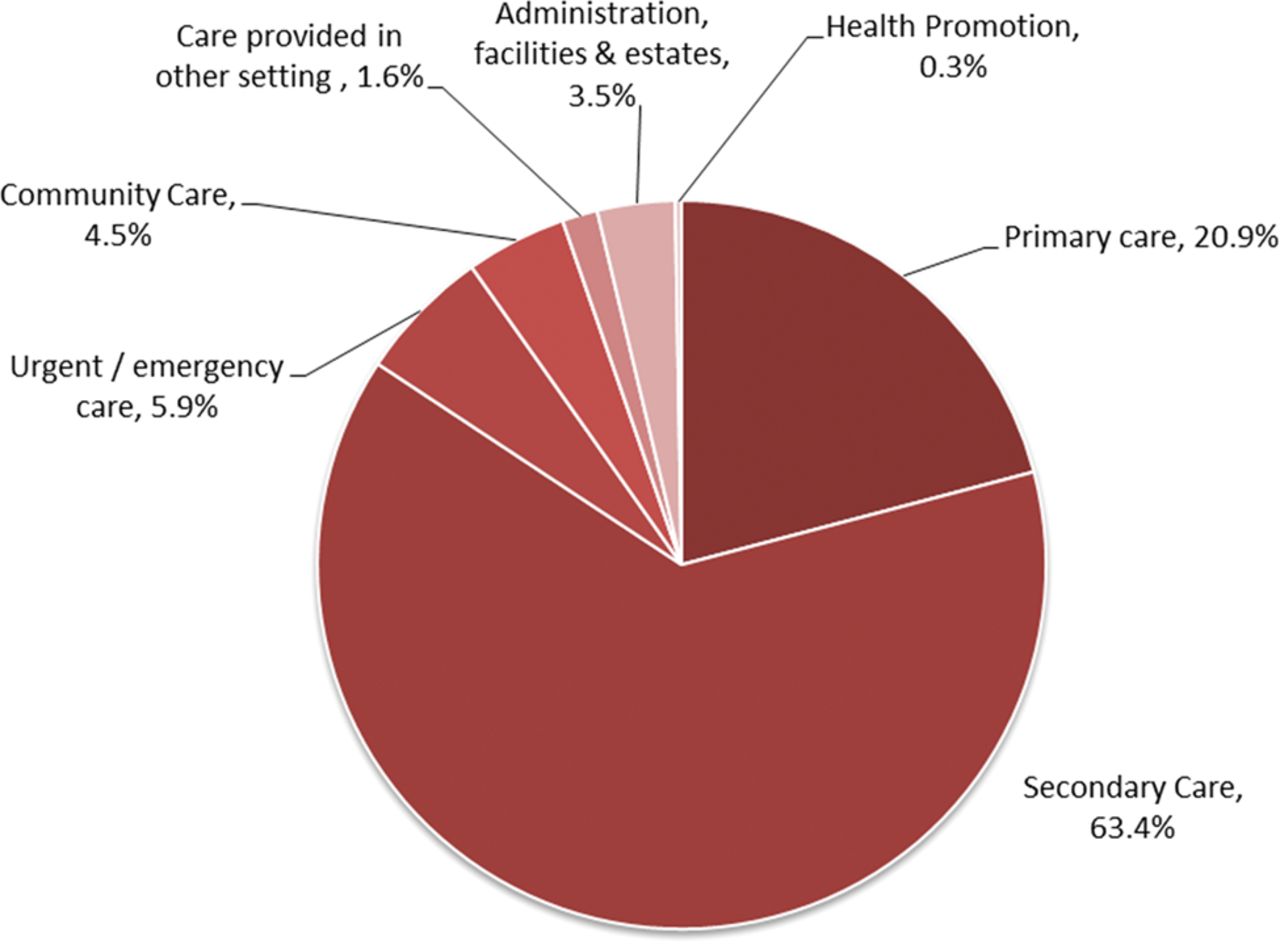
Cost data are not available for the UK as a whole; therefore, we present England data here. More than £6.8 billion was spent on treating CVD within the NHS in England in 2012/2013. The highest expenditure was on secondary care with £4373 million spent on secondary care for CVD in England. Within secondary care, emergency admissions had the greatest expenditure. Within primary care, the second highest setting for expenditure, the majority of costs were due to prescribing (£1387.5 million). Economic cost data for Wales, Scotland and Northern Ireland come from different sources (see online supplementary tables) and so may not be comparable. In 2012/2013 in Wales, a total of £442.3 million was spent on CVD, in Northern Ireland, £393 million was spent and in Scotland it is estimated that >£750 million was spent on treatment of CVD (figure 5).
Percentage of National Health Service (NHS) expenditure on cardiovascular disease by care setting, England 2012/2013. Expenditure data included are taken from the 2012–2013 programme budgeting returns. Programme budgeting returns are based on a subset of primary care trust (PCT) accounts data and represent a subset of overall NHS expenditure data. Estimates of expenditure are calculated using price paid for specific activities and services purchased from healthcare providers. PCTs follow standard guidance, procedures and mappings when calculating programme budgeting data. Adapted from NHS England—Analytical services—Programme Budgeting Team (2014) 2012/2013 Programme Budgeting Benchmarking Tool. http://www.england.nhs.uk/resources/resources-for-ccgs/prog-budgeting/ (accessed February 2014).
Summary and discussion
Although CVD is no longer the biggest cause of death overall in the UK, it is still the largest cause of death for women. Overall figures also mask substantial regional inequalities in mortality from CVD, with the highest CVD death rates occurring in Scotland and the North of England. Improved survival also means that there is a high prevalence of CVD conditions such as MI and angina; again, prevalence is higher in the North of England. There are also a large number of hospitalisations and operations resulting from CVD, which are in conjunction with an increase in the number of prescriptions dispensed for CVD conditions.
Cancer has overtaken CVD to become the main cause of death in a number of European countries, for example, in Belgium, Denmark and France,2 indicating that the UK is one of many countries undergoing this change. The decrease in mortality from CVD in the UK is partially due to improved case fatality rates after MIs over the last decade and partially due to a decline in incidence.3 Although the data we present here shows large increases in treatment over the past decade, Unal et al10 estimated that between 1981 and 2000, 58% of the decline in deaths from CHD was due to improvements in risk factors, such as smoking, and 48% was due to treatments.
Accurate incidence data is difficult to obtain, but conditions such as MI can be measured using HES or general practice data linked to mortality, or through disease registries such as the Myocardial Ischaemia National Audit Project. These sources provide information on both new cases presenting to the health service and on those who die before reaching hospital. We have not presented incidence data in this review, but there is published evidence that the incidence of some CVDs is declining over time. Measured using HES linked to mortality, the incidence of MI has declined in many developed countries, including England, since the 1970s.3 ,11 ,12 Measured using general practice data, between 1999 and 2008, the incidence of stroke in the UK dropped by 30%.13 However, it has been demonstrated that only using one source of incidence data can underestimate MI by 25–50%.14
Despite the substantial shift towards PCIs in the past years, CABG procedures remain as one of the main surgical treatments for certain more complex conditions.15 For example, it is recommended that CABGs remain as the standard revascularisation care for patients with complex coronary lesions or severe left main coronary disease. Where patients are eligible for both CABG and PCI, the National Institute for Health and Care Excellence reports that although CABG is still effective it is not cost-effective when compared with PCI and so the latter procedure should be performed.16
While we aimed to use high-quality nationally representative data sources, all have their limitations. Mortality and HES cover the entire population; however, data from the CPRD database came from about 9% of the population. It is possible therefore that CPRD data are not nationally representative; however, the fact that QOF prevalence data (which covers virtually all general practices) supports CPRD prevalence estimates lends some credibility to the representativeness of the CPRD database.
Conclusion
CVD remains a substantial burden to the UK, both in terms of health and economic costs. Despite significant declines in incidence and mortality, CVD is still the biggest cause of mortality in women. The improvements in survival mean that there is now a high prevalence of people living with CVD, and consequently high numbers of prescriptions for secondary prevention. The most recent HSE reports that lipid-lowering drugs are the most prescribed medicine for men, and the second most prescribed for women.17 This review highlights the stark regional inequalities in the mortality and prevalence of CVD. Prevention measures to improve diet, physical activity, binge drinking and tobacco use are necessary to tackle both these regional inequalities and premature mortality from CVD.
Supplementary materials
Supplementary Data
This web only file has been produced by the BMJ Publishing Group from an electronic file supplied by the author(s) and has not been edited for content.
- Data supplement 1 - Online supplement
Press release
Files in this Data Supplement:
Footnotes
Contributors PB wrote the paper and produced tables and figures. KW, JW and NT produced tables and figures for the paper. MR, along with all other authors, contributed to the development of the paper and provided critical review of the manuscript.
Funding All authors were funded by the British Heart Foundation (grant URN = 006/P&C/CORE/2013/OXFSTATS).
Competing interests None declared.
Provenance and peer review Not commissioned; externally peer reviewed.