Article Text

Statistics from Altmetric.com
Aortic valve stenosis (AS), at the simplest level, is mechanical obstruction to left ventricular (LV) outflow with severity best described by the high velocity or pressure gradient across the valve or the small valve opening area. More recently, the importance of adverse left ventricular (LV) changes in patients with aortic valve disease has led to a new classification of AS to include measures of LV function and volume flow rate as follows: (1) high gradient severe AS with a transvalvular velocity ≥4 m/s or mean gradient ≥40 mm Hg, (2) low-flow low-gradient severe AS with reduced ejection fraction (<50%), and (3) low-flow low-gradient severe AS with normal ejection fraction and a stroke volume index ≤35 ml/m2.
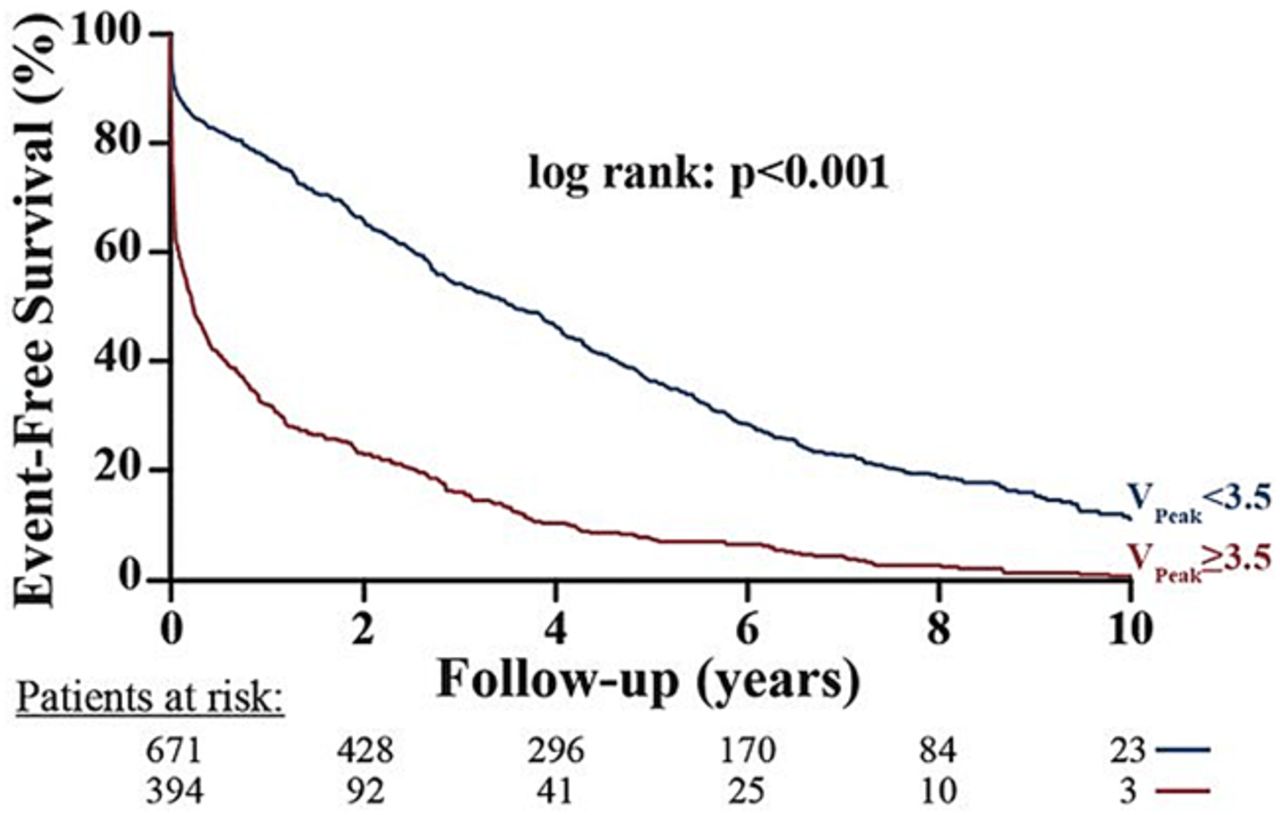
In this issue of Heart, Capoulade and colleagues (see page 934) examined the differential value of measures of AS severity versus LV function for prediction of valve-related events and for all cause mortality in a consecutive series of 1065 patients with AS undergoing echocardiography. At baseline, 53% had severe AS, 17% had a low LV ejection fraction and 34% had a low stroke volume index. The findings confirm previous studies showing that parameters of AS severity, including maximum velocity, mean gradient and valve area, are the strongest predictors of valve related events (figure 1). However, the only multivariate predictors of all cause mortality were LV ejection fraction and stroke volume index (figure 2).

Event-free survival as a function of aortic stenosis severity parameters. This figure shows the event-free survival curves for the composite of aortic valve replacement or death. The groups are dichotomised according to cut-point values of peak aortic jet velocity (VPeak obtained by the receiver operating characteristic curve analyses and rounded to the nearest unit or decimal: VPeak ≥ vs <3.5 m/s. The numbers at the bottom of the graph represent the number of patients at risk at each follow time.

Overall survival as a function of left ventricular ejection fraction (LVEF) and stroke volume index (SVi) all-cause mortality. The groups are dichotomised according to the cut-point values of LVEF and SVi obtained by the receiver operating characteristic curve analyses and rounded to the nearest unit or decimal: LVEF ≥ vs <55% and SVi > vs <35 mL/m2. The symbols indicate the significant differences between groups: *p<0.05 vs ‘LVEF <55% and SVi <35 mL/m2′; ¶p<0.05 vs ‘LVEF <55% and SVi >35 mL/m2’; §p<0.05 vs ‘LVEF ≥55% and SVi <35 mL/m2’. The numbers at the bottom of the graph represent the number of patients at risk at each follow time.
In the accompanying editorial (see page 902), Evangelista and Galian remain skeptical that echocardiographic measures of stroke volume index should be a key factor in clinical decision making. “We have come a long way since echocardiography was a shadow land; nonetheless, use of the dichotomic value of stroke volume index (35 mL/m2) using this vulnerable echocardiographic methodology for surgical treatment indication, in a given patient, generated a certain degree of unease”.
These comments reflect my own concerns that the reliability of echocardiography in clinical practice is less than perfect. My views are detailed in a (hopefully provocative) editorial on the current shortcoming and possible approaches for improving the clinical practice of echocardiography, not only by cardiologists but by all practitioners as this technology is disseminated across medicine (see page 899). “We need to move away from the concept of restricting cardiac imaging to a small group of highly skilled individuals towards a systems-based approach with cardiac imaging integral to standard medical care. This will require that we: (1) integrate imaging into educational curriculums right from the start of medical training, (2) set standards for the appropriate scope of practice, stratified by health care setting and provider training, (3) develop validated approaches for documenting competency of providers within each scope of practice, (4) use systems based approaches to prevent and identify errors, and (5) provide mechanism for continuous quality improvement”.
The transradial approach (TRA) for primary percutaneous coronary intervention(PCI) is a guideline recommendation in acute coronary syndromes and now accounts for about 75% of all primary PCIs in the UK. The TRA is associated with a lower mortality and adverse event rate compared to a transfemoral approach (TFA) but is limited by variability in operator experience and patient related factors. In a study of over 2000 patients undergoing PCI by Abdelaal and colleagues (see page 919), TRA failure occurred in 5% and was associated with higher one-year mortality (adjusted OR 2.2; 95% CI 1.2 to 3.9, p=0.011). These authors propose a 9-variable risk score for identifying patients at risk of TRA failure. This score (WRIST-CASE) is calculated by summing the value of 1 for each of 8 variables (age ≥75 years, weight ≤65 kg, creatinine >133 µmol/L, hypertension, prior PCI, cardiogenic shock, balloon pump and physician with a ≥10% TFA rate), a value of −1 for a physician with a TFA rate ≤5% of cases, and a value of 5 for intubation (figure 3).
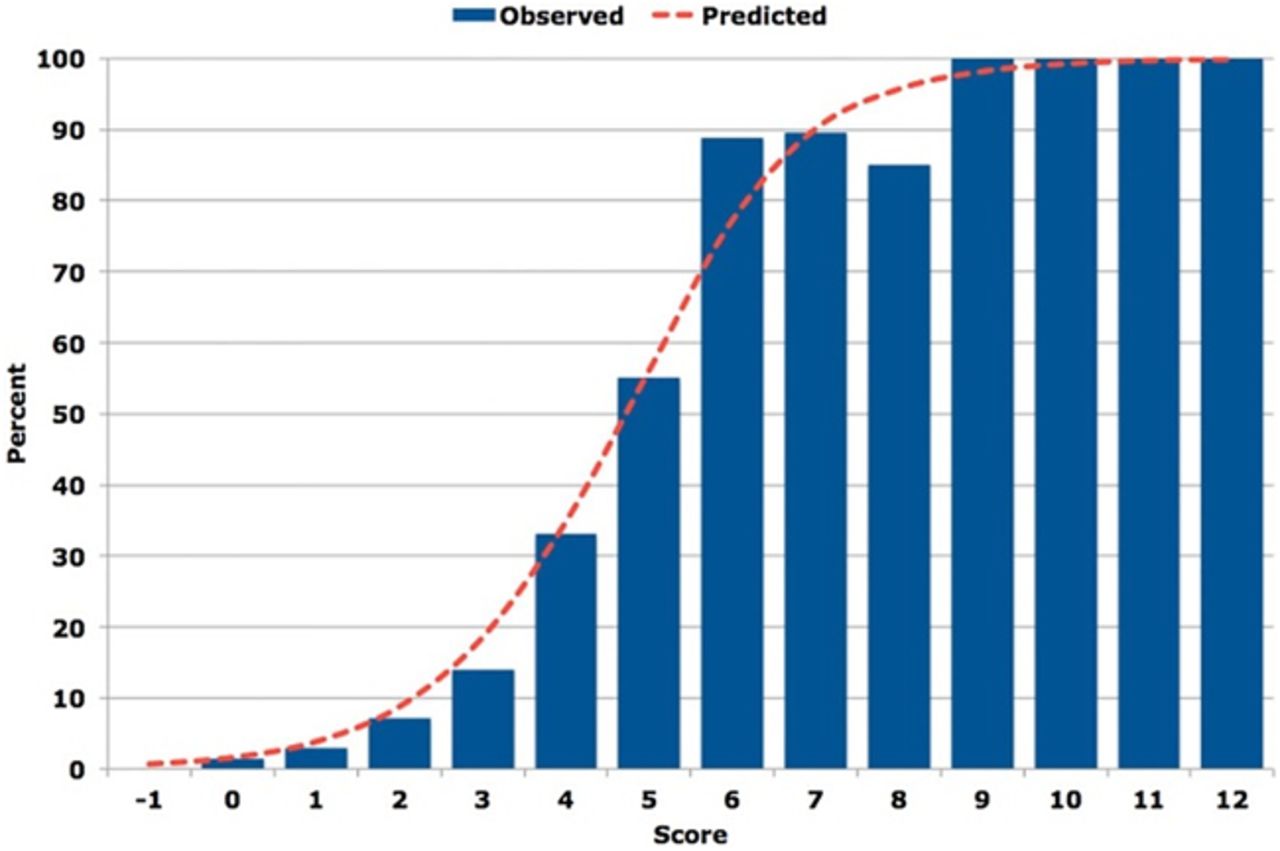
Observed versus predicted probability of TRA-PCI failure in STEMI according to risk score. WRIST-CASE risk score consisting of nine independent predictors of TRA-PCI failure in STEMI. The vertical blue bars represent the observed per cent of patients who failed TRA-PCI and the red line represents the predicted probability value of failure for TRA-PCI. TRA-PCI, transradial approach-percutaneous coronary intervention; STEMI, ST elevation myocardial infarction; WRIST-CASE, Weight, Radial proficiency, IABP (intra-aortic balloon pump), Shock, Tube, Creatinine, Age, prior Stent, and Elevated blood pressure.
An editorial by Gilchrist and Mamas (see page 897) puts this study in perspective with the comment: “The applicability of the ‘risk score’ for failure developed from this centre's experience to other institutions is unclear, particularly its applicability to cases undertaken in the non-primary PCI setting, where the clinical demographics of the patients will be very different.” In addition, they note: “Patients identified to be at highest risk for failure are also those patients who have most to gain from TRA site adoption, and this should result in all efforts to gain access via the radial artery rather than be used as an excuse to lightly go femoral”.
The Education in Heart article in this issue addresses the clinical use of non-vitamin-K oral anticoagulation medications for treatment of venous thromboembolism (see page 975). A flow chart providing guidance on choosing the best anticoagulation medication is particularly helpful (figure 4).

Decision-making tree for treatment of a venous thromboembolism (VTE). CrCl: creatine clearance; LMWH, low molecular weight heparin; NOAC, non-vitamin K antagonist oral anticoagulant.
This issue also includes two image challenge cases. The first asks you to interpret an abnormal chest radiograph (see page 918). The second (online only) requires you to identify the cause of an interesting finding on a spectral Doppler tracing.
Linked Articles
- Image challenge
- Coronary artery disease
- Valvular heart disease
- Editorial
- Editorial
- Editorial
- Education in Heart