Article Text

Abstract
Introduction It is well established that left ventricular (LV) adaption occurs in response to chronic physiological conditioning. There is also evidence highlighting functional differences in myocardial strain imaging between athletes from sporting disciplines. This difference may be a consequence of the vague classification of sport i.e. not taking into account relative static and dynamic components and/or merely a consequence of chamber enlargement. We sought to utilise a novel simultaneous assessment of longitudinal strain and LV volume in athletes classified in the 4 corners of Mitchell’s classification of sporting disciplines. The primary aim was to determine relative longitudinal strain throughout the cardiac cycle and its specific contribution to LV volume change in these athletes.
Methods 92 elite male athletes were studied and sub classified based on sporting discipline in accordance with the Mitchell’s classification. (Group IA low static-low dynamic n = 20, Group IC low static-high dynamic n = 25, Group IIIA high static-low dynamic n = 21, Group IIIC high static-high dynamic n = 26). Conventional echocardiography of the LV was undertaken. The raw temporal global longitudinal strain values were exported and divided into 5% time increments across the cardiac cycle. Concomitant LV volumes were traced at each 5% time increment to provide simultaneous strain-volume loops. The strain-volume relationship was assessed by applying a polynomial regression analysis for each systolic and diastolic curve to derive absolute values for% end diastolic volumes (EDV).
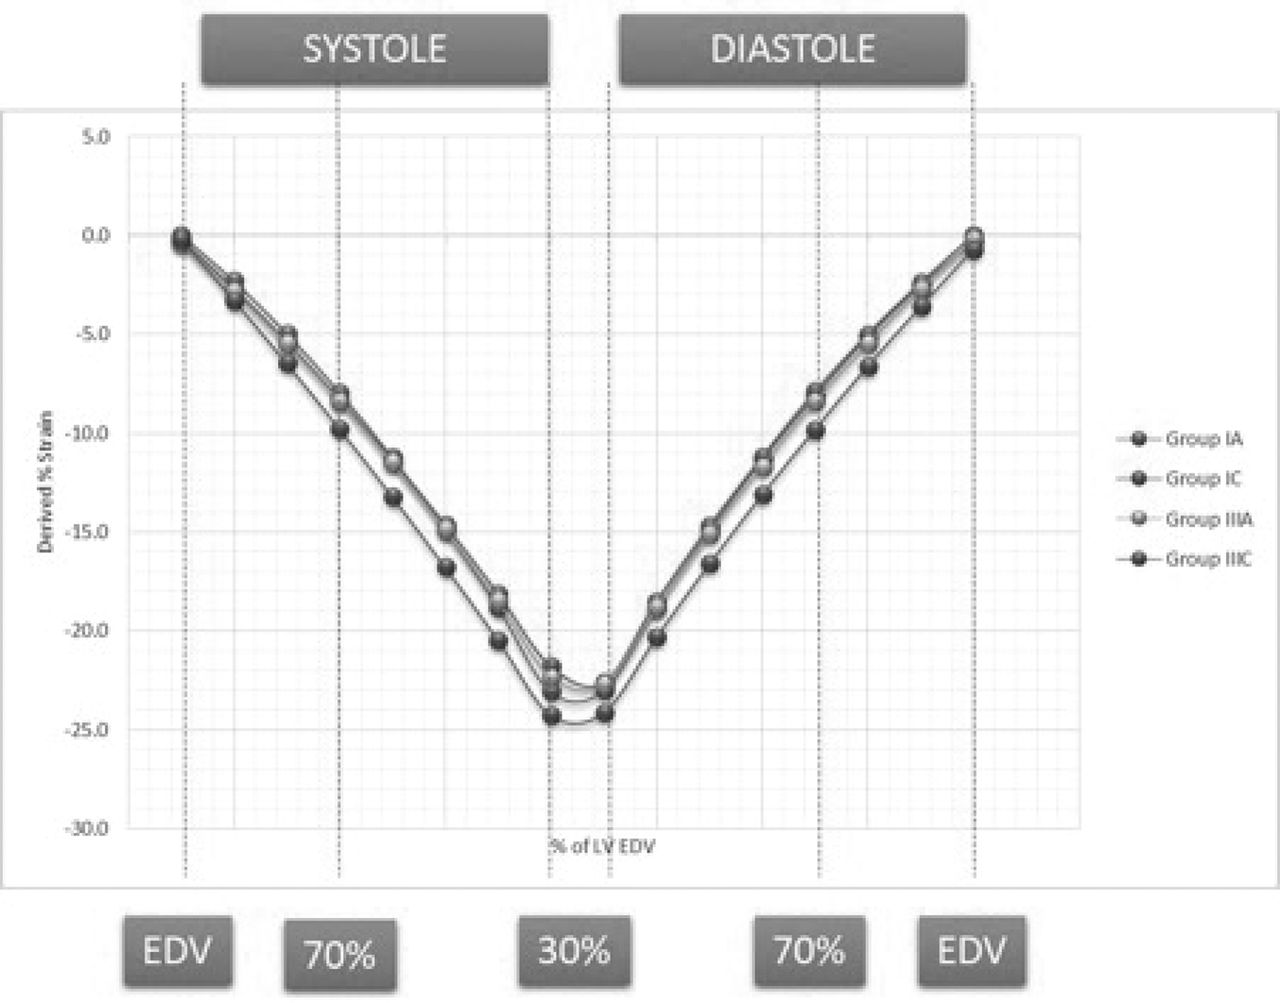
Results Conventional and peak strain indices are presented in table 1. Athletes in group IC and IIIC had larger LV end diastolic volumes (EDV) compared to athletes in groups IA and IIIA (50 ± 6 and 54 ± 8 ml/(m2)1.5 vs. 42 ± 7 and 43 ± 2 ml/(m2)1.5 respectively). Group IIIC also had significantly larger mean wall thickness (MWT) compared to all groups. Peak strain was variable between groups but once normalised for EDV all groups, with exception of IIIC, required similar strain to generate the same% reduction in EDV (see Figures 1 and 2). Conversely group IIIC required greater longitudinal strain for any given% volume which correlated to MWT (r = 0.4, p < 0.0001).
Echocardiographic Parameters

Temporal Assessment of Simultaneous Strain and Volume
Derived Strains for% EDV in the EF range 10 to 70%
Conclusion There are physiological differences between athletes with the largest LV demonstrated in athletes from group IIIC. These athletes also have greater resting longitudinal contribution to volume change which, in part, is related to an increased wall thickness. The variance in peak strain seen in the other athlete groups was solely related to chamber size with no intrinsic differences in contractility or relaxation.
- Athletes Heart
- Strain Imaging
- Echocardiography