Article Text

Abstract
Introduction Previous studies of the reproducibility of echocardiographic assessment of aortic stenosis have compared only a pair of observers. The aim of this study was to assess reproducibility across a large group of observers and compare the reproducibility of reading the peak versus the velocity time integral.
Methods 25 observers reviewed continuous wave (CW) aortic valve and pulsed wave (PW) LVOT Doppler traces from 20 sequential cases of aortic stenosis in random order. Each operator unknowingly measured the peak velocity and velocity time integral (VTI) twice for each case, with the traces stored for analysis. We undertook a mixed-model analysis of the sources of variance for peak and VTI measurements.
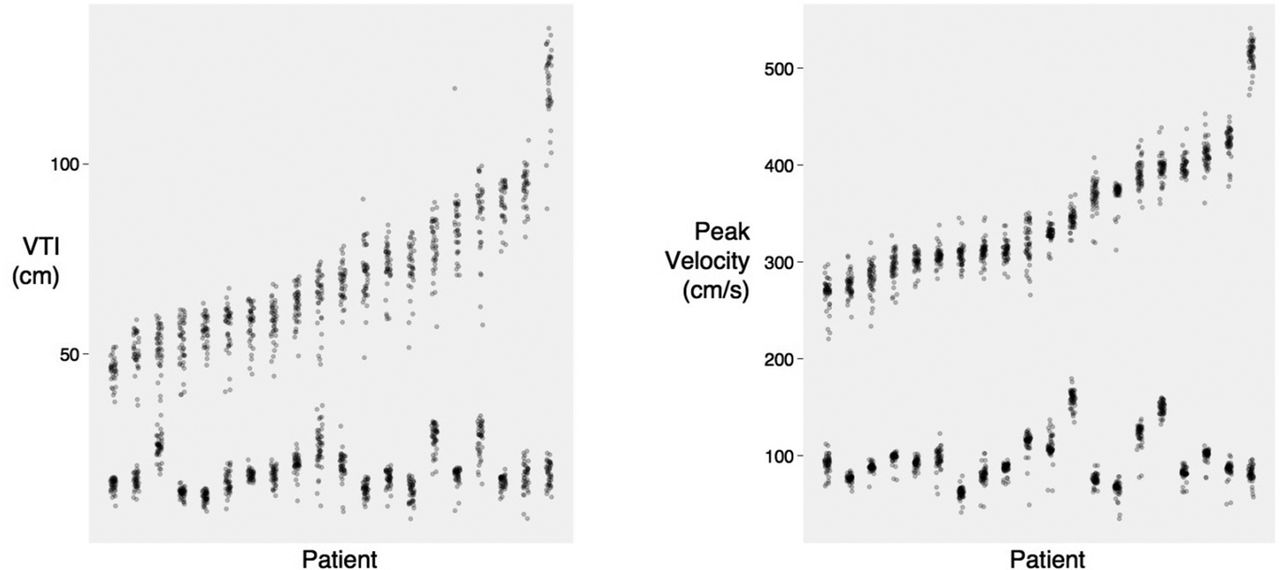
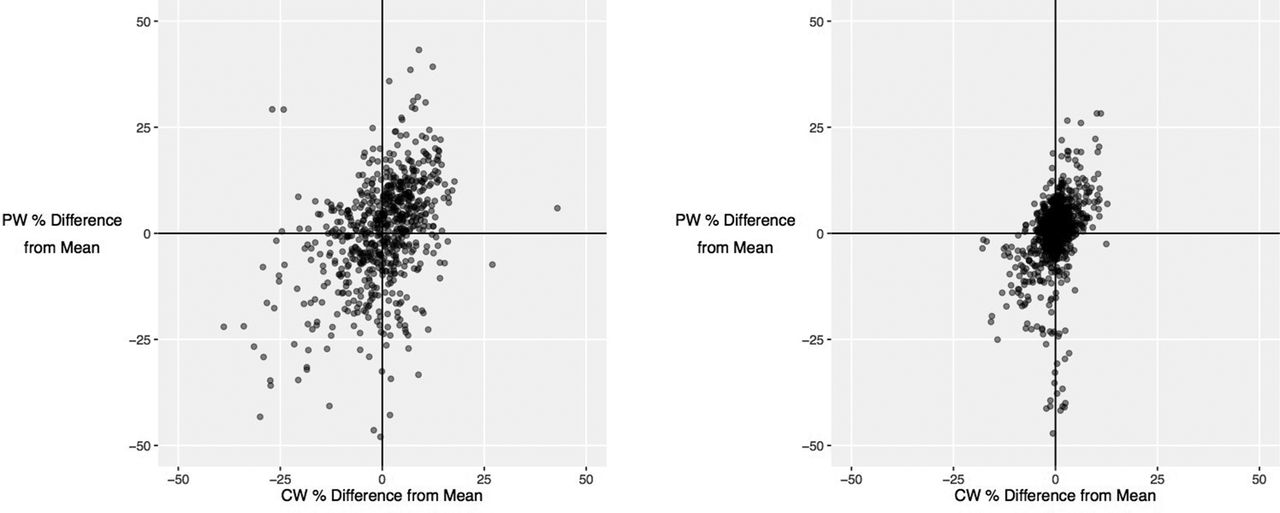
Results Measuring the peak is more reproducible than VTI for both PW (coefficient of variation 9.6% versus 15.9%, p<0.001) and CW traces (coefficient of variation 4.0% versus 9.6%, p<0.001), as shown in Figure 1. VTI is inferior because, compared to the middle, it is difficult to reproducibly trace the steep beginning (standard deviation 3.7x and 1.8x larger for CW and PW respectively) and end (standard deviation 2.4x and 1.5x larger for CW and PW respectively). Dimensionless index reduces the coefficient of variation (19% reduction for VTI, 11% reduction for peak) partly because it cancels correlated errors: an operator who over-measures a CW trace is likely to over-measure the matching PW trace (r=0.39, p<0.001 for VTI, r=0.41, p<0.001 for peak), as shown in Figure 2.
Conclusions It is more reproducible to measure the peak of a Doppler trace than the VTI, because it is difficult to trace the steep slopes at the beginning and end reproducibly. The difference is non-trivial: an average operator would be 95% confident detecting a 11.1% change in peak velocity but a much larger 27.4% change in VTI. A clinical trial of an intervention for aortic stenosis with a VTI endpoint would need to be 2.4 times larger than one with a peak velocity endpoint. Part of the benefit of dimensionless index in improving reproducibility arises because it cancels individual operators tendency to consistently over- or under-read traces.

Variation in velocity time integral (left panel) and peak (right panel) measurements. Each column represents a different case, ordered from the smallest average measurement on the left to the largest on the right. Each point represents an operator’s measurement for a case. The upper group are aortic valve CW measurements, the lower group are PW LVOT measurements.

Relationship between under-reading and over-reading for pulsed-wave and continuous wave traces from the same patient for VTI (left panel) and peak (right panel). Each point represents a case reviewed by a single operator. The tendency to over- or AV measurements is represented on the y-axis.
- Echocardiography
- valvular heart disease
- reproducibility