Article Text

Abstract
Objective To assess the overall effects by a meta-analysis.
Data sources Electronic searches on PubMed and Ovid Medline from their start to October 2009 were carried out.
Objective Cohort studies and secondary analysis of randomised controlled trials reporting the relative risk (RR) of recurrent cardiovascular events or death associated with C-reactive protein (CRP) obtained within 72 h from acute coronary syndromes (ACS) onset.
Data extraction Two epidemiologists independently abstracted information on study design, study and participant characteristics, level of CRP, outcomes, control for potential confounding factors and risk estimates using a standardised form.
Results A general variance-based method was used to pool the estimates of risk. Thirteen studies containing 1364 new cases identified from 9787 patients during the follow-up periods reported the risk estimates by CRP categories. Compared with the bottom CRP category (≤3 mg/l), the pooled RRs and their 95% CIs were 1.40 (1.18 to 1.67) for the middle (3.1∼10 mg/l) category and 2.18 (1.77 to 2.68) for the top (>10 mg/l) category of CRP values with a random-effects model, respectively. Another four and three studies reported the risk by unit of CRP or logarithmically transformed CRP. The pooled RRs (95% CI) were 1.49 (1.06 to 2.08) per 5 mg/l and 1.26 (0.95 to 1.69) per natural logarithm of CRP (mg/l), respectively.
Conclusions Greater early blood CRP moderately increases long-term risk of recurrent cardiovascular events or death, and may be a valuable prognostic predictor in patients after ACS.
- C-reactive protein
- acute coronary syndrome
- long-term outcome
- meta-analysis
- longitudinal studies
Statistics from Altmetric.com
Atherosclerosis is an inflammatory disease.1 Inflammation has a pivotal role in plaque destabilisation, which results in acute coronary artery syndrome.2 There is intense interest in the relationship between inflammation and cardiovascular diseases, especially acute cardiovascular events. Of all the inflammatory markers for cardiovascular diseases, C-reactive protein (CRP) is considered to be one of the most important markers and has been extensively studied in recent years. A meta-analysis of prospective studies of general populations reported that a higher CRP level was related to a 58% increase in the incidence of cardiovascular diseases,3 which indicated that CRP was a moderately valuable marker in predicting the development of cardiovascular diseases.
The use of CRP for prognosis is believed to be of value. Centers for Disease Control and Prevention (CDC) of America and the American Heart Association (AHA)4 recommended that CRP should be measured in patients with acute coronary syndromes (ACS) as an independent marker of prognosis. A large number of studies have examined the prognostic value of CRP in patients with acute cardiovascular events at baseline.5–24 Although most of them found a dose-dependent positive association between CRP and late adverse outcomes, the strength of the association varied with each study owing to different settings, populations and outcomes, etc. There is an increasing need to synthesise all the evidence. This meta-analysis aims to quantify the pooled long-term risk of adverse outcomes in patients with ACS using CRP obtained within 72 h from the onset of symptoms.
Methods
Search strategy and selection criteria
We conducted a computer search through PubMed and Ovid Medline (from their start to October 2009) for follow-up studies and randomised controlled trials (RCTs), with the languages limited to English and the subjects limited to adults. We used the terms related to cardiovascular diseases (sudden death, coronary, myocardial, stunning, infarction, ischaemia, cardiovascular, angina, cerebrovascular, stroke, cerebral haemorrhage), CRP (C-reactive protein, CRP, acute phase protein), follow-up studies (cohort, longitudinal, follow-up, prospective, retrospective) and randomised controlled trial (Random*, allocate*, blind*, assign*, interven*, trial*, controlled, RCT) in our core search. We also screened the related articles of each included study generated by PubMed and checked the references of all the included studies.
We included studies if they met all the following criteria: (a) all patients had ACS at baseline; (b) blood samples for CRP determination were obtained within 72 h from the onset of symptoms or on admission to hospital; (c) outcomes were death, heart failure and other non-fatal cardiovascular events such as re-infarction, postinfarction angina, recurrent ischaemia and need for revascularisation with either angioplasty or bypass surgery; (d) a follow-up duration of at least 1 month; (e) risk estimates with 95% confidence intervals were reported by at least three CRP categories, or unit of CRP or logarithmically transformed CRP. We excluded studies if they were not related to CRP and the outcomes of ACS. Case–control studies and cross-sectional studies were also excluded owing to the uncertainty of time relationship. Details are given in the online supplementary file. When articles were from the same author at the same setting with varied sample size and different follow-up duration, the article with larger sample size and longer follow-up duration was used in this meta-analysis.
Data extraction and quality assessment
Two epidemiologists (LH and YC) independently assessed the eligible studies, collected information and assessed the quality. We extracted information on the authors' names, year of publication, country of origin, study design, subject characteristics, sample size, inclusion and exclusion criteria, duration of follow-up, treatments, time at which blood samples were obtained, method of CRP determination, outcome measurements and their risk estimates, and adjusted covariates. We also tried to contact the authors to request the unpublished relevant information for the included articles. We assessed the quality of each study according to the rating scheme developed by Hayden et al.25 Thirty questions about six domains of potential bias were evaluated, including study participation, study attrition, prognostic factor measurement, outcome measurement, confounding measurement and adjustment, and analysis. Studies meeting four or more of the six criteria were considered to be high quality, otherwise they were classed as low quality. Discrepancies between the two reviewers were resolved by re-examination of the original articles by a third investigator and discussion between the authors.
Meta-analysis and statistical analysis
We conducted separate meta-analyses for the eligible studies reporting the risk estimates by CRP categories, unit CRP or natural logarithm of CRP. For the first type of studies, we converted categories of CRP concentration to three standardised categories according to the statement by the American CDC and AHA4: the bottom group (the referent, ≤3.0 mg/l), the middle group (3.1–10.0 mg/l) and the top group (>10.0 mg/l). The category-specific risk estimates of each study were assigned to the standardised categories according to the mid-point for closed categories and the median or the corresponding median previously defined—20% lower than the lowest cut-off point and 20% higher than the highest cut-off point for the open categories. One of the included studies reported the risk estimates by CRP quintiles.9 For this study, quartile 1 (lowest) was assigned to the referent group, quartiles 2 and 3 were assigned to the middle group and quartile 4 was assigned to the top group, respectively. We pooled the risk estimates and their 95% CIs if more than one group in a single study fell into the same standardised category. The pooled estimates were then used for the overall effect analysis. For the studies reporting the risk estimates by unit CRP (mg/l) or natural logarithm of CRP (mg/l), we pooled the standardised risk estimates (RR per 5 mg/l of CRP, or RR per 1 unit of natural logarithm of CRP (mg/l)). One eligible study was excluded owing to its unreasonably high CRP-associated RR (51.54 per 5 mg/l CRP).26
We assessed the statistical heterogeneity between studies by Q statistic. Inconsistency was quantified with the I2 statistic. A value of p<0.10 for Q tests or I2 ≥50% indicated significant heterogeneity between studies. We estimated the pooled risks and 95% CIs by the general variance-based method using a random-effects model.27 When no 95% CIs were presented, they were calculated using numbers of cases and total subjects or person-time. The 95% CIs were used to assess the variance and the relative weight of each study. Adjusted risk estimates, when available, were preferred. We used only the results with the longest follow-up period when multiple results were reported by different durations of follow-up. The combined multiple end points of adverse outcomes were considered to be the primary end points. We analysed the dose–response relationship using the method proposed by Greenland and coworkers.28 29 Study-specific slopes (linear trends) were computed from the natural log of the RRs across different exposure levels correlated with their corresponding CRP contents. Original dose groups were used in the dose–response relationship analysis.
We performed a sensitivity analysis for the main effect by excluding all the studies one by one. Subgroup analyses were performed to assess the source of heterogeneity by different end points (heart failure, cardiac death and all-cause death), time of collection of blood samples from the onset of symptoms (≤24 h or not), duration of follow-up (>1 y or not), study settings (Europe or not), mean age (≥65 years or not), confounder adjustments (adjusted or not), quality of the study (high quality or not) and the original study design (cohort study or trial).
Publication bias was assessed by the combination of a funnel plot, Egger's linear regression30 31 and fail-safe number. Publication bias was absent for p>0.1 in Egger's linear regression test and higher fail-safe number meant better reliability of the meta-analysis. A trim-and-fill method was used to adjust for publication bias in the overall effect estimation.32
STATA (version 10.0, Stata Corp) was used for the above analyses. The meta-analysis was conducted adhering to the MOOSE guidelines.33
Results
Study characteristics
Twenty studies with 17 422 patients with ACS were included in the analysis (figure 1). Table 1 summarises the characteristics of the included studies. Of these 20 studies, 145–13 15 18 20 21 24 were cohort studies, and six14 16 17 19 22 23 were secondary-analyses of randomised controlled trials. All blood samples were obtained within 72 h from the onset of symptoms or on admission to hospital. The mean age of participants at baseline ranged from 57 to 72.5 years. Mean duration of follow-up varied between 1 and 96 months. Twelve7–10 12 14–16 18 22–24 studies were from Europe, five5 6 11 17 19 were from America and three13 20 21 were from Asia.
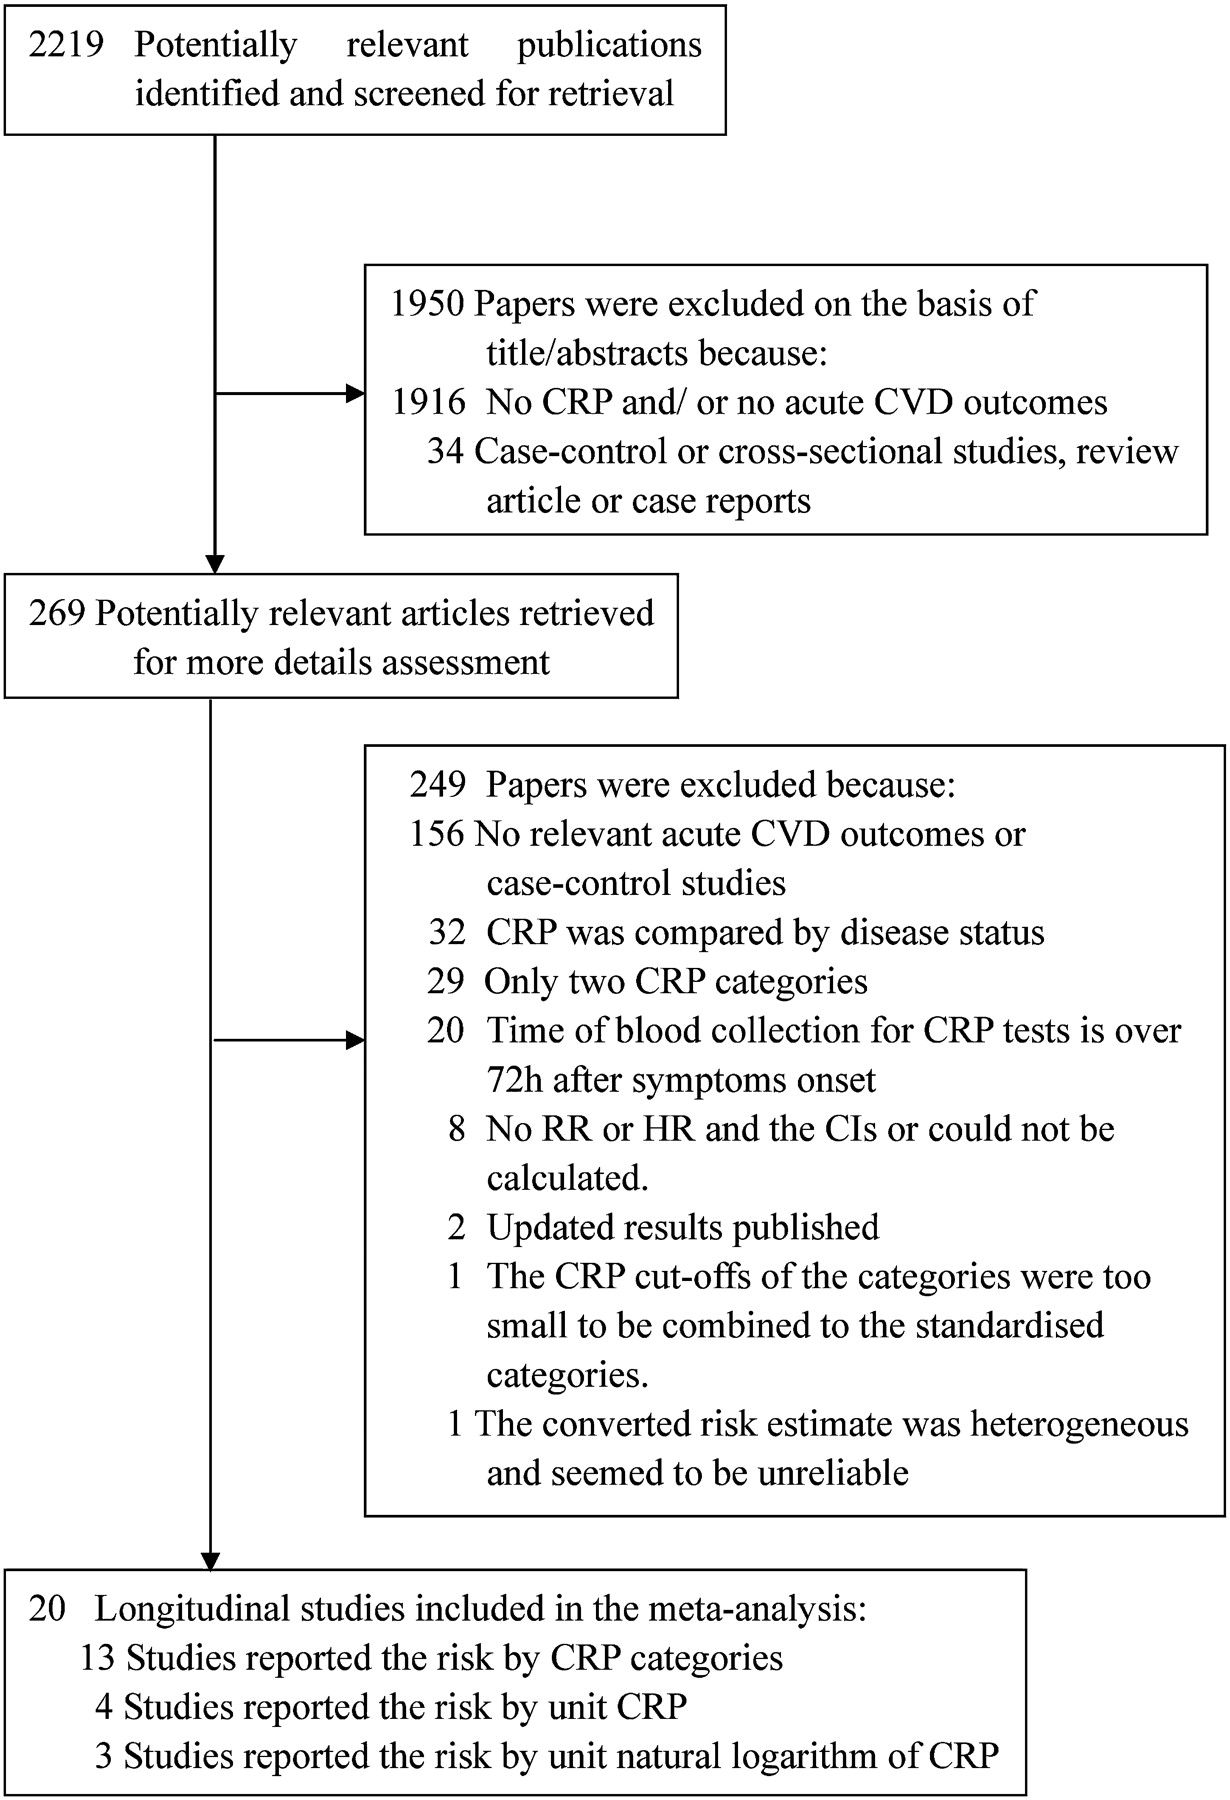
Flow diagram of search strategy and study selection. CRP, C-reactive protein; CVD, cardiovascular disease.
Characteristics of studies included in the meta-analysis
Data synthesis
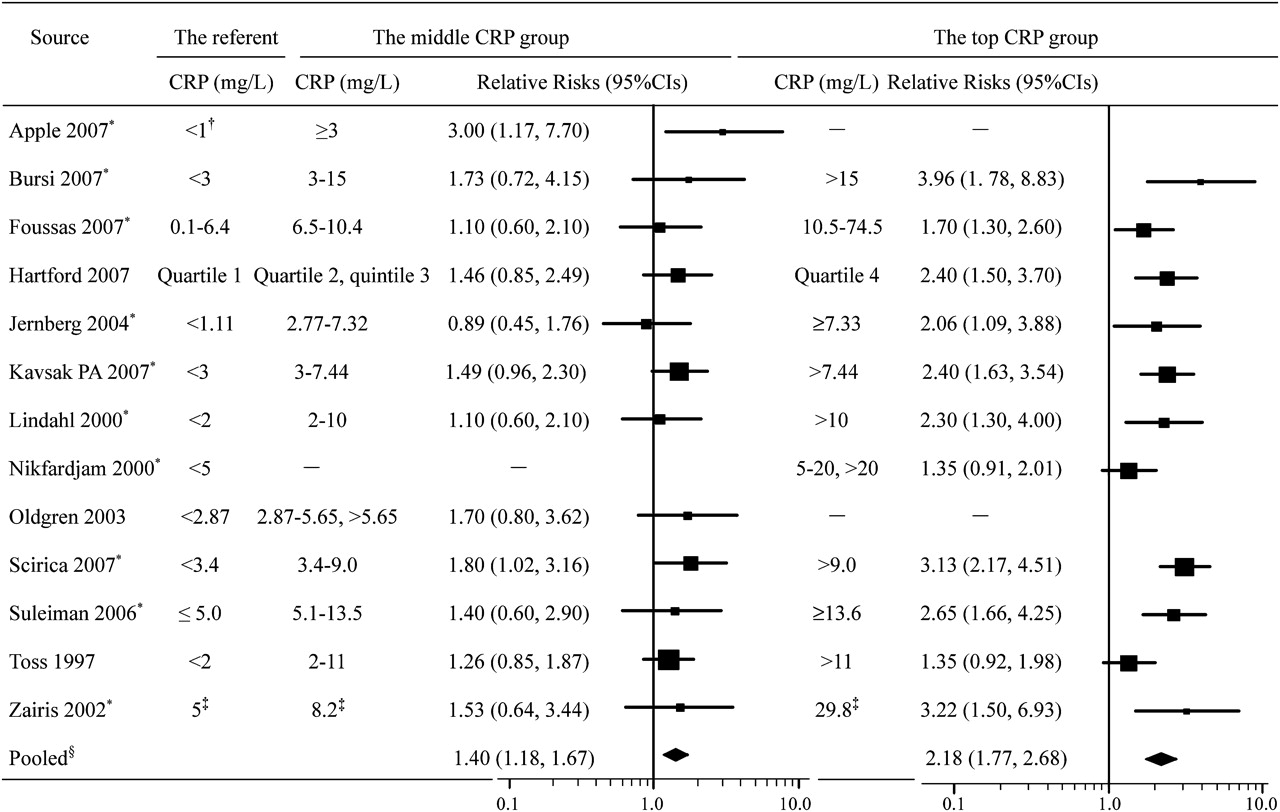
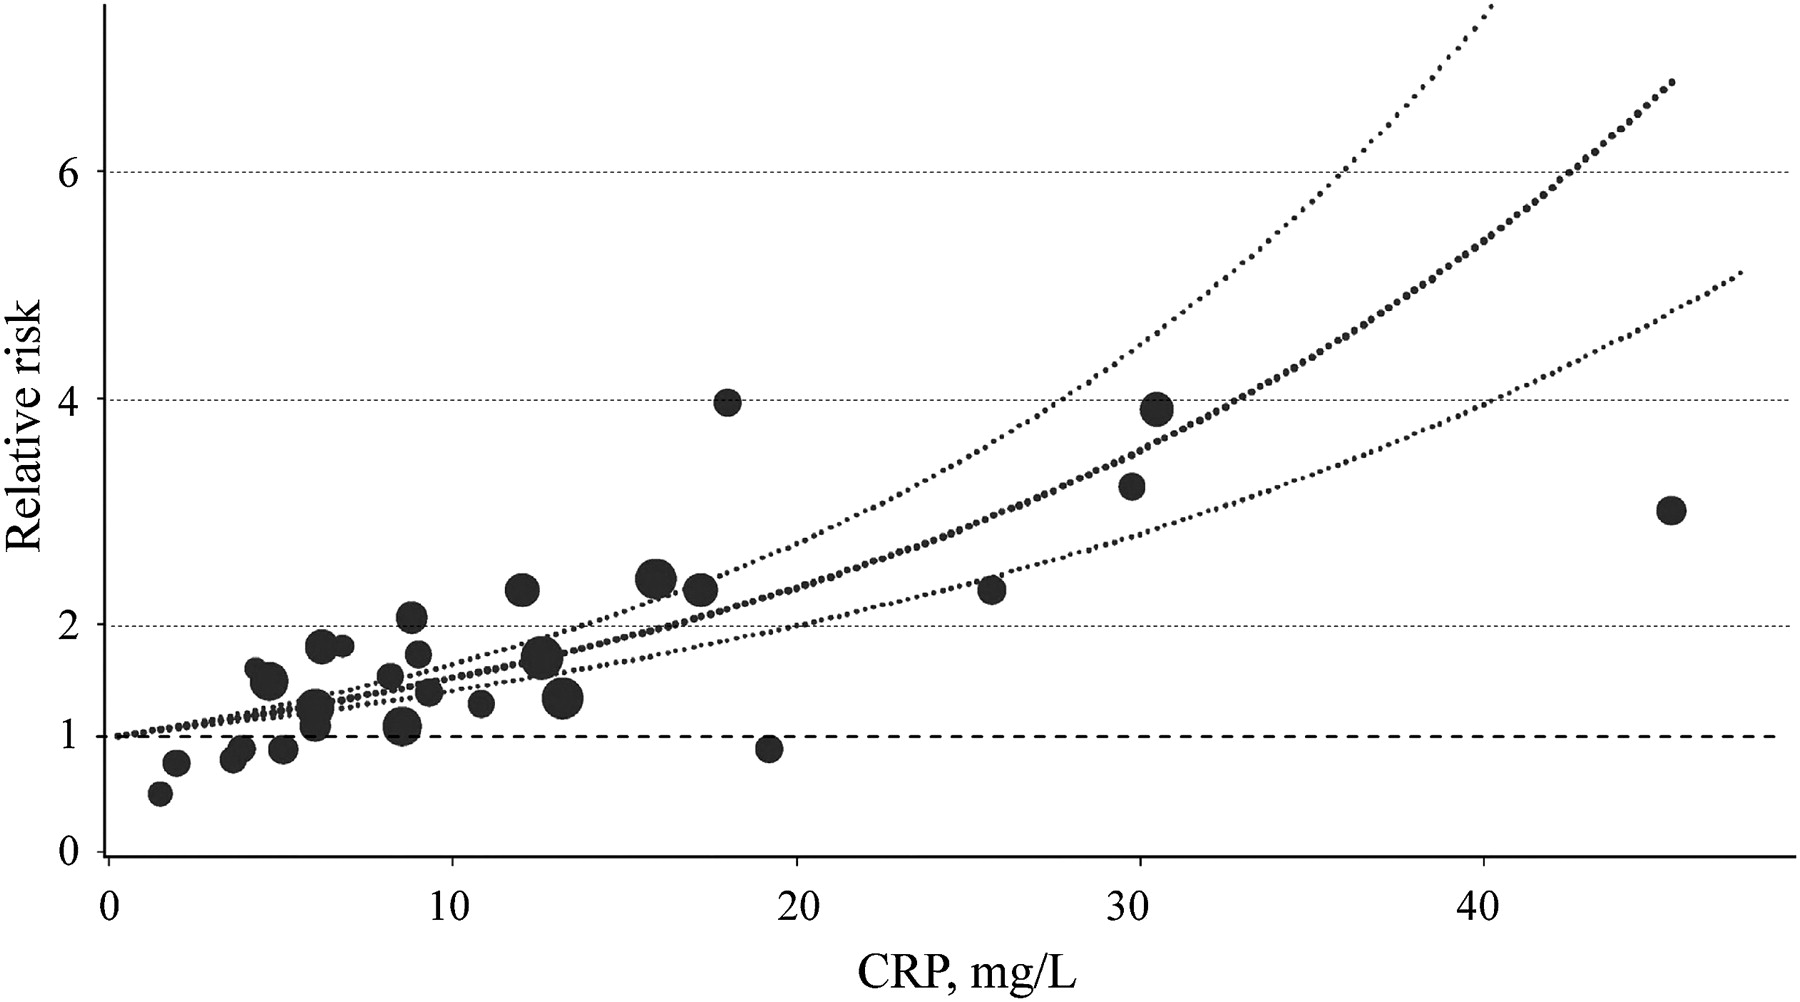
Of the 13 studies reporting the risk estimates by CRP categories, nine5–7 9–11 15 21 24 were cohort studies and 414 16 19 22 were secondary analyses of RCTs. A total of 1364 new cases of adverse outcomes identified from 9787 patients with ACS were included in pooling the overall effects. The p values for between-study heterogeneity were 0.80 and 0.02, and coefficients of inconsistency (I2) were 0% and 51.9% for the middle and top CRP category, respectively. As compared with the referent group (CRP ≤3 mg/l), the pooled RRs (95% CIs) of long-term adverse outcomes were 1.40 (1.18 to 1.67) (p<0.001) for the middle CRP category (3.1–10.0 mg/l) and 2.18 (1.77 to 2.68) (p<0.001) for the top CRP category (>10.0 mg/l) with the random-effects model, respectively (figure 2). Twelve studies were included in the dose–response meta-analysis of blood CRP levels and the outcomes. One study15 was excluded because the dose–response model could not be established when included. The estimated summary RR (95% CIs) for an increase of 5 mg/l CRP was 1.23 (1.19 to 1.28) (figure 3).Another four12 13 18 20 and three8 17 23 studies reported the risk estimates by each unit of CRP or logarithmically transformed CRP and the pooled RRs (95% CIs) were 1.49 (1.06 to 2.08) per 5 mg/l CRP and 1.26 (0.95 to 1.69) per unit increase of natural logarithmic CRP (mg/l), respectively (figure 4).

RR estimates from longitudinal studies of acute coronary syndromes. Error bars indicate 95% CIs. CRP, C-reactive protein. *The RRs were adjusted for potential confounding factors in original studies. †The middle category (1.0-2.9 mg/l) of this study was omitted because this small cut-off point was not able to be combined with the standardised category. ‡The median value of the tertile. §Random-effects model was used. The middle CRP group: p for heterogeneity=0.80, I2=0%; The top CRP group: p for heterogeneity=0.02, I2=51.9%.

Dose–response relationships between early C-reactive protein and risk of major adverse cardiovascular events. The dots represent the RRs corresponding to C-reactive protein concentration in each individual study. The area of the dots is inversely proportional to the logarithm of the RR variance. The three curves are the RR estimates and their 95% CIs according to the dose–response model of ‘ln(RR)=0.2105 (SE, 0.0199)×C-reactive protein (in 5 mg/l), p<0.001’. CRP, C-reactive protein.

Forest plot for C-reactive protein analysed as a continuous variable. Error bars indicate 95% CIs. CRP, C-reactive protein. *The RRs were adjusted for potential confounding factors. †p for heterogeneity <0.001, I2>90%.
Sensitivity and subgroup analyses
We conducted sensitivity and subgroup analyses for the pooled risks by CRP groups. The pooled RRs (95% CIs) ranged between 1.37 (1.14 to 1.63) and 1.45 (1.21 to 1.74) for the middle CRP category and between 2.06 (1.68 to 2.83) and 2.30 (1.88 to 2.80) for the top category when omitting all the studies one by one in sensitivity analyses. The p values for heterogeneity were both 1.00 for the two categories, which indicated that there were no statistically significant differences when any one of the included studies was excluded. We explored the prognostic value of CRP for different end points and the findings were not significantly different (table 2). The pooled risk estimate in European studies was significantly lower than that in non-European studies (RR=1.83 vs 2.81) in the top CRP group (p=0.01). The pooled estimate adjusted for potential confounding factors was smaller than that without adjustment from the same seven studies (RR=2.31 vs 3.53) (p=0.05). No significant heterogeneities were observed in subgroups stratified by time of blood collection, follow-up duration, age, study quality and original study design (p for group heterogeneity, 0.21–0.99) (table 2).
Pooled RRs for adverse cardiovascular outcomes by subgroups of study variable
Publication bias and data quality
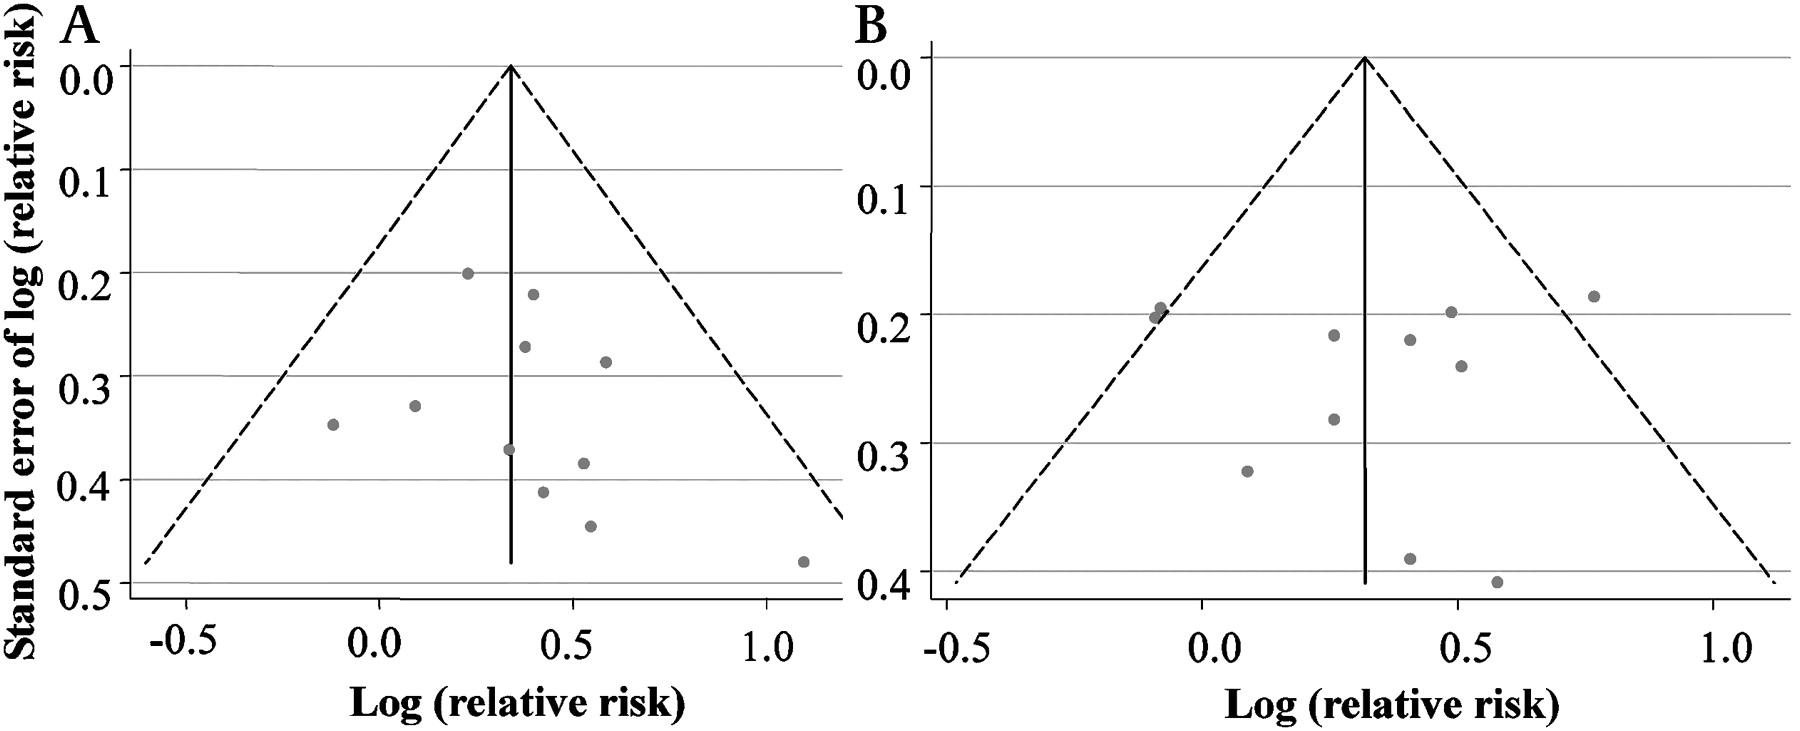
No significant publication bias was observed by reviewing the classic funnel plot and by using Egger-weighted regression method for either the middle group (p=0.35) or the top group (p=0.26) (figure 5). The publication bias adjusted estimates were 1.33 (1.12 to 1.56) for the middle group and 2.06 (1.68 to 2.52) for the top group. The corresponding fail-safe numbers for the middle and top CRP groups were 36 and 318, respectively.

Funnel plots for publication bias in overall effect estimation in the middle C-reactive protein group (A) and the top C-reactive protein group (B). Publication bias was not statistically significant for either the middle (p=0.35) or the top (p=0.26) C-reactive protein group by Egger weighted regression method.
The quality of the included studies was assessed by a qualitative method (table 1). Up to 11 studies (55%) met the criteria for sampling and more than half of the articles reported the necessary information about follow-up (65%) and outcome measurement (55%). Seven (35%) studies collected data of confounding factors sufficiently, six (30%) had reported reliable measurements of CRP and 12 (60%) analysed the data with an appropriate approach.
Discussion
Our meta-analysis has quantitatively assessed the relation between early blood CRP after ACS and risk of adverse outcomes in 20 longitudinal studies comprising 2789 cases from 17 422 patients. In our study, we found that patients with higher CRP levels of 3.1–10.0 and >10.0 (mg/l) after ACS were associated with 1.40-fold and 2.18-fold higher risks of adverse outcomes as compared with the referent (CRP ≤3.0 mg/l). This finding was consistent with the recommendation (class IIa, evidence B) by the American CDC and AHA.4
The publication bias diagnostics and sensitivity analysis confirmed the reliability and stability of this meta-analysis. Significant between-study heterogeneity was observed in the top CRP group (p=0.02). Subgroup analyses were used to explore potential heterogeneity sources. We found that the pooled risk was significantly higher in non-Europe region than those in Europe (p for group heterogeneity=0.01), which might be related to heredity, host susceptibility, environmental factors34 or random error since only three studies were conducted in non-European regions. Seven articles6 10 14 15 21 24 35 reported both non-adjusted and adjusted risks. Non-adjusted risk tended to be overestimated (adjusted vs non adjusted, p=0.05). There was no significant group heterogeneity stratified by age, duration of follow-up, outcome, time of CRP sample collection, study quality and original study design. As there was no standard tool for quality assessment for cohort studies, we used a qualitative checklist, which was introduced to assess the quality of prognosis studies in systematic reviews, to evaluate the study quality of the included studies.25 The pooled CRP-associated risks were not significantly affected by the study quality.
Our findings suggest that early CRP is a valuable predictor for adverse outcomes in patients with ACS. However, whether CRP is the best and most cost-effective measurement is still a matter of debate. White blood cell count, a much simpler and less expensive measurement, is an independent prognostic predictor of 12-month mortality after acute myocardial infarction (HR=1.48, 95% CI 1.08 to 2.04 per 1000 cells/μl).36 Berton et al37 reported that the RR (95% CI) of 1-year mortality in men with a heart rate of ≥80 (vs <80) beats/min on the first day of hospitalisation for acute myocardial infarction is 3.1 (1.4 to 7.0). Moreover, admission electrocardiogram, a widely available measurement, was also considered to be a good predictor of adverse outcomes of ACS.38–40 These studies suggested that many simple clinical measurements were good predictors of prognosis of ACS. But, it was uncertain which clinical measurement was the most valuable or most cost-effective in clinical use since no study had compared their independent prognostic value under the same conditions. Further studies are needed to compare the prognostic values of common clinical markers or joint multiple markers in the same study.
There are several possible explanations for the prognostic value of CRP in patients with ACS. It has been shown that CRP is related to the dysfunction of endothelial cells and the progression of atherosclerosis. Pasceri et al41 found that CRP induced a significant increment of adhesion molecule expression in human endothelial cells, indicating the direct proinflammatory effect of CRP. Second, CRP has a role in the progression of atherosclerosis by decreasing the production of nitric oxide and prostacyclin produced by endothelial cells.42 43 Moreover, CRP can amplify the immune response through complement activation,44 45 which has the effect of expanding the infarct size.46 An animal study showed directly harmful effects on ischaemic myocardium. A significantly enlarged infarct size was found when human CRP was injected into rats after ligation of the coronary artery.47 In addition, elevated CRP might independently affect the coagulation system and increase mortality.48 When an ACS occurs, serum CRP concentration apparently increases and reaches a peak at 72 h.49 50 CRP obtained within 72 h from the onset of symptoms is a reflection of the acute response of tissue injury. A higher level of CRP was related to more sever damage caused by the cardiovascular events and further damage caused by CRP itself.51 The early phase of the inflammatory response was also related to the ventricular function and remodelling,52 ischaemia and reperfusion injury,46 which can cause long-term events.
The strength of this meta-analysis is that we included a large number of patients in the overall analysis, which increases the power of testing and makes the results more reliable. Second, we only included longitudinal studies, which are better than case–control studies as there is less bias and a clearer time relationship. Third, 17 of these 20 eligible studies used the high-sensitivity method to determine the concentration of CRP precisely and this reduces the bias of misclassification. Furthermore, 16/20 studies included provided confounder-adjusted risks and their 95% CIs, which may eliminate the effect of confounders. We limited the studies to those in which CRP samples were obtained within 72 h since the onset of symptoms, so that misclassification bias due to CRP sample collection would be reduced. Finally, the results of both the funnel plot and the Egger-weighted regression method showed no significant publication bias.
Limitations
This study has several limitations. First, the meta-analysis included a limited number of eligible studies, which made it more difficult to detect the heterogeneity between studies. Next, varied end points were used in the included studies. However, we observed similar CRP-associated risks for the major end points, including heart failure, cardiac death and all-cause deaths. Third, seven articles reported the risks of CRP-associated end points by unit CRP or logarithmically transformed CRP. The results of these studies could not be pooled with those obtained by CRP categories. Fourth, some studies included in the overall effect did not adjust or fully adjust for some important confounders, such as measures of cardiac damage, treatments, diabetes, etc. Fifth, the cut-off point of each CRP quintile was not described in Hartford et al,9 which might increase the risk of misclassification. Finally, only articles published in English were included.
Conclusions
This meta-analysis found a moderately dose-dependent positive association between early blood CRP value and long-term risk of adverse outcomes in patients with ACS. Our findings suggest that early CRP is a valuable prognostic marker for patients with ACS.
References
Footnotes
* LH and XT contributed equally to this work.
Funding This study was supported by the 5010 Program for Clinical Researches by the Sun Yat-sen University, Guangzhou, P. R. China.
Competing interests None.
Provenance and peer review Not commissioned; externally peer reviewed.
Linked Articles
- Featured editorial