Article Text

Abstract
Background Post-procedural aortic regurgitation (AR) has been described in a large number of patients receiving transcatheter aortic valve implantation (TAVI).
Objective The aim of this study was to examine the intraoperative 2-dimensional (2D) and 3-dimensional (3D) echocardiographic features of the aortic valve associated with significant post-procedural paravalvular AR.
Methods A total of 135 patients (81±7 years) with severe symptomatic aortic stenosis, who underwent TAVI, were imaged with comprehensive 2D and 3D transoesophageal echocardiography before the procedure and peri-procedure. Various baseline and peri-procedural echocardiographic characteristics were tested to predict paravalvular AR post-TAVI: calcifications at the aortic valve commissures and leaflets, ‘aortic annulus eccentricity index’, ‘area cover index’, overlap between aortic prosthesis and anterior mitral leaflet. Post-procedural paravalvular AR≥2 was considered significant.
Results Successful TAVI was achieved in all patients. The incidence of paravalvular AR≥2 immediately after the procedure was 21% (28 patients). Commissural calcifications and, particularly, the calcification of the commissure between the right coronary and non-coronary cusps was significantly more frequent in presence of paravalvular AR; the area cover index pre-TAVI was significantly lower among patients with AR (11.1±11.8% vs 20.8±12.5%, p=0.0004). Multivariate analysis revealed that calcification of the commissure between the right coronary and non-coronary cusps (OR=2.66, 95% CI 1.39 to 5.12, p=0.001), and the area cover index pre-TAVI (OR=0.95, 95% CI 0.91 to 0.99, p=0.006) were the only independent predictors of significant paravalvular AR after TAVI.
Conclusions Intraoperative 2D and 3D transoesophageal echocardiography identified calcification of the commissure between the right coronary and non-coronary cusps and the area cover index as independent predictors of significant paravalvular AR following TAVI.
- Transcatheter aortic valve implantation
- aortic regurgitation
- echocardiography
- valvular disease
- imaging and diagnostics
- MRI
- 3-dimensional
- aortic valve disease
- interventional cardiology
- non-coronary intervention
- percutaneous valve therapy
- cardiac function
- echocardiography–paediatrics
- mitral valve
- aorta
- great vessels and trauma
- arrhythmias
- arrhythmic right ventricular dyplasia
- invasive electrophysiology
- rhythms
- radiofrequency catheter ablation
- cardiomyopathy
- diagnostic imaging
- echocardiography (three-dimensional)
- chronic heart failure
- RV function
Statistics from Altmetric.com
- Transcatheter aortic valve implantation
- aortic regurgitation
- echocardiography
- valvular disease
- imaging and diagnostics
- MRI
- 3-dimensional
- aortic valve disease
- interventional cardiology
- non-coronary intervention
- percutaneous valve therapy
- cardiac function
- echocardiography–paediatrics
- mitral valve
- aorta
- great vessels and trauma
- arrhythmias
- arrhythmic right ventricular dyplasia
- invasive electrophysiology
- rhythms
- radiofrequency catheter ablation
- cardiomyopathy
- diagnostic imaging
- echocardiography (three-dimensional)
- chronic heart failure
- RV function
Introduction
Over the last few years, transcatheter aortic valve implantation (TAVI) has been demonstrated to be a feasible and effective therapeutic alternative to traditional aortic valve replacement for high-risk surgical patients with symptomatic severe aortic stenosis.1–7 Single- and multi-center studies showed significant improvements after TAVI in symptoms and quality of life, together with excellent transvalvular haemodynamic characteristics, and good survival rates at 2 years follow-up.5 ,8 ,9
However, post-procedural aortic regurgitation (AR), mainly paravalvular, has been described in a relatively large number of patients after TAVI.1–3 ,5 ,7–10 The majority of patients with paravalvular AR after TAVI shows mild grade regurgitation and the incidence of moderate or severe paravalvular AR is low (7% at 1 year and 6.9% at 2 years in the PARTNER trial).6 However, understanding the mechanisms and potential determinants of paravalvular AR after TAVI is of importance to minimise the incidence of this complication and, therefore, its potential impact on left ventricular (LV) performance and clinical outcome.
Initial studies have proposed multi-detector CT as a valuable imaging tool to achieve an accurate characterisation of the aortic valve apparatus, and to ensure high procedural success rate.11 However, in clinical practice, transoesophageal echocardiography (TOE) is commonly the first imaging technique of choice to accurately characterise valvular morphology and geometry, both before and during the procedure, and to evaluate the results after TAVI. Therefore, the aim of this study was to identify potential predictors of significant paravalvular AR occurring immediately after TAVI, using intraoperative 2D and 3D TOE.
Methods
A total of 135 consecutive patients, who underwent TAVI with the Edwards-Sapien valve between November 2007 and January 2010 in two centres (Centro Cardiologico Monzino, IRCCS, Milan, Italy and Leiden University Medical Center, Leiden, The Netherlands), were included. TAVI was performed using the transfemoral or transapical approach, according to the peripheral artery anatomy. A 23 mm device was implanted when, as measured on 2D TOE images, the diameter of the aortic annulus (AoA) was >18 mm and ≤21 mm, and a 26 mm device was implanted when the diameter of the AoA was >21 mm and ≤25 mm.
Two-dimensional transthoracic echocardiography was performed before the procedure, and before discharge, to assess LV volumes and ejection fraction, as well as to measure transaortic pressure gradients and aortic valve area normalised for body surface area (AVAi) according to current recommendations.12 Aortic stenosis was defined as severe in the presence of a mean transaortic pressure gradient (MPG) >40 mmHg, or an AVAi <0,6 cm2/m2.13 ,14
All patients were imaged with comprehensive peri-procedural 2D and 3D TOE, in the operating room. TOE was performed using the iE33 ultrasound system (Philips Medical Systems, Andover, Massachusetts, USA) equipped with fully sampled matrix-array 3D probe (model X7-2t), and various baseline and procedural variables were evaluated to predict significant paravalvular AR. All the measurements, based on 2D and 3D TOE, were performed intraoperatively. Pre-procedural measurements were obtained before prosthesis deployment, blind to the outcome of the procedure.
2D transoesophageal echocardiography
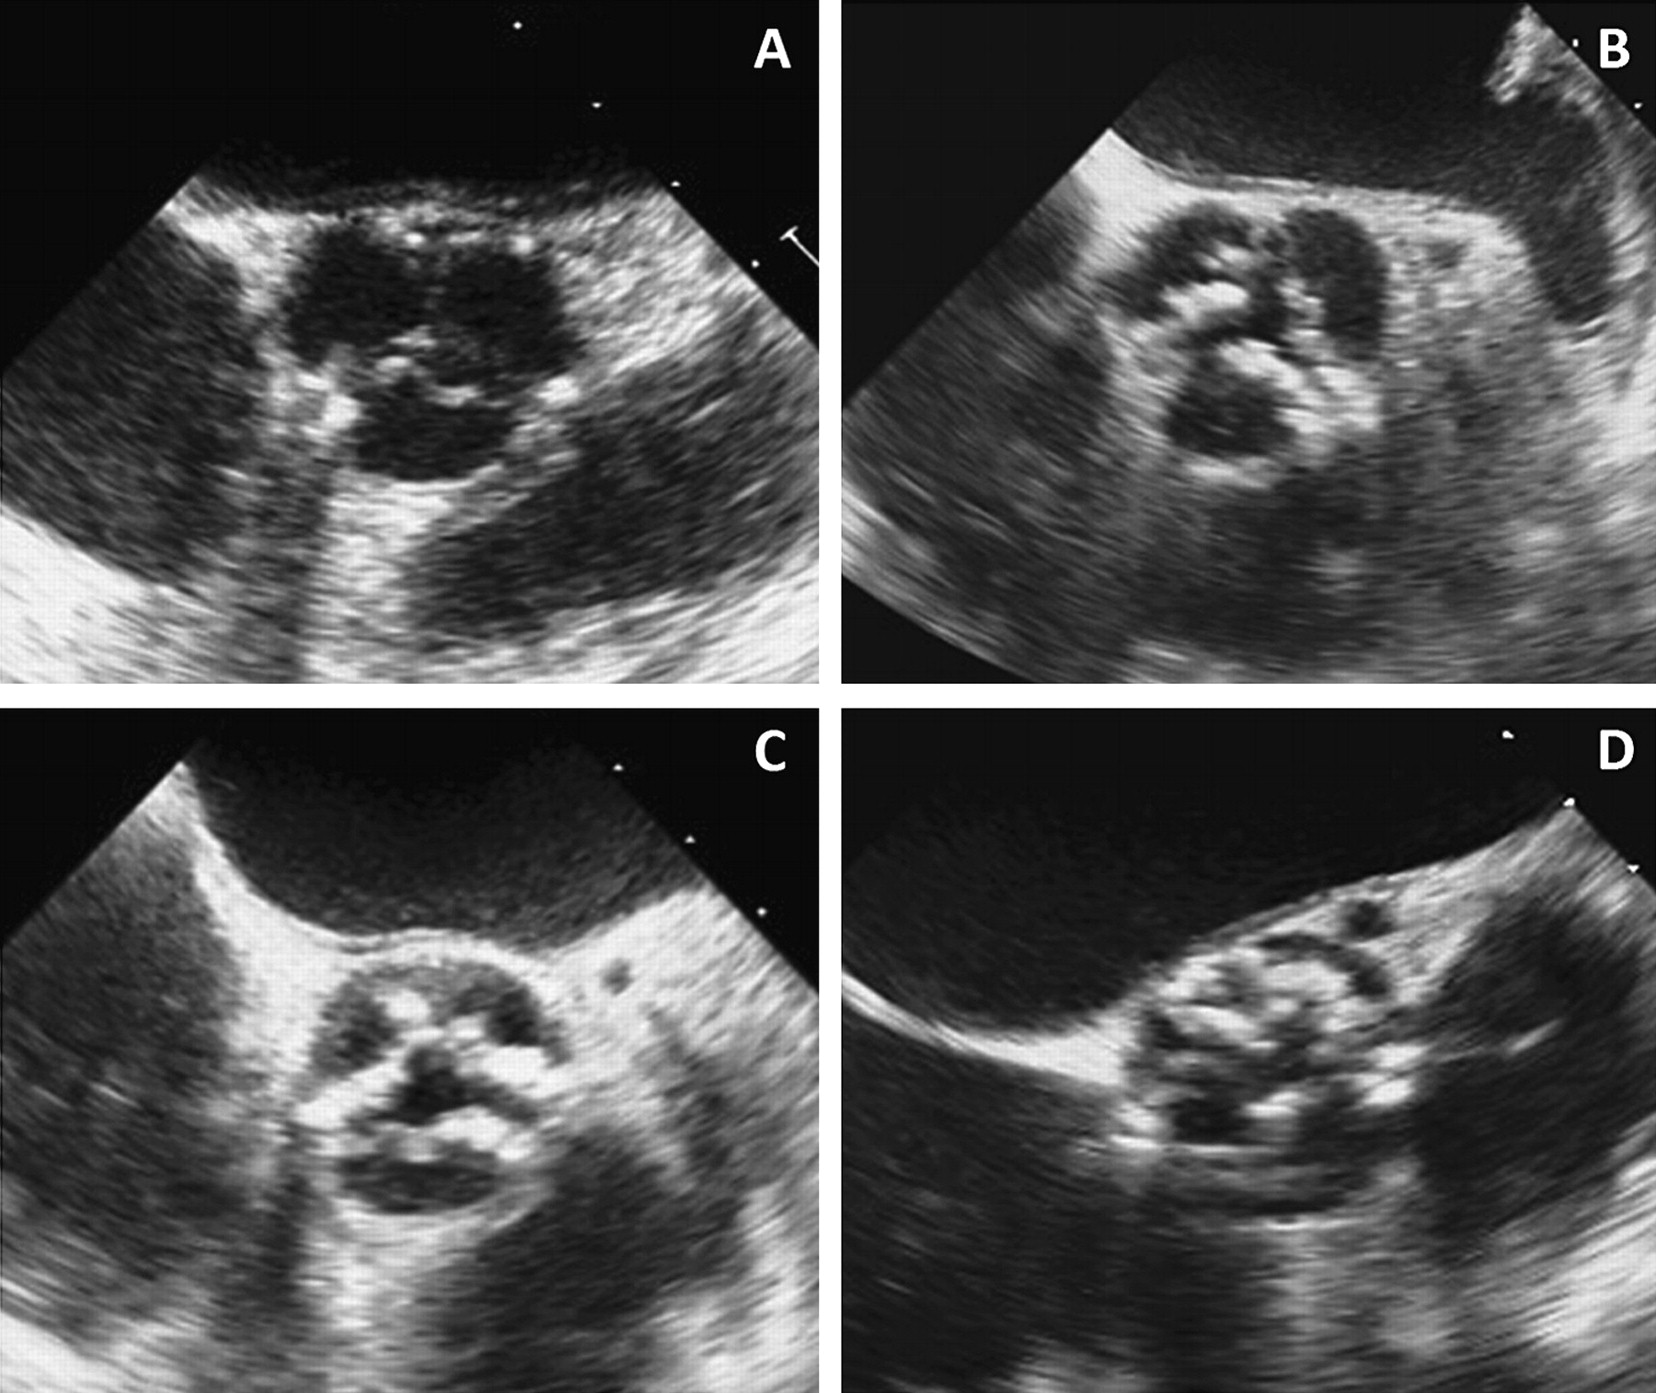
Two-dimensional measurements of the AoA were performed, as recommended,15 during early systole in the long-axis view at approximately the 120° angle, at the hinge points of the leaflets. The presence and the distribution of aortic valve calcifications was evaluated in the short-axis view of the valve at approximately the 30°–60° angle. The amount of aortic calcifications were assessed, separately for the commissural and for the central regions of the cusps, using a semi-quantitative score (0–4), as depicted in figure 1: 0= no calcifications; 1= (minimal), speckles; 2= (mild) single nodule; 3= (moderate) two or more nodules; 4= (severe) diffuse, confluent calcifications.16 A score was assigned to each cusp and commissure. An overall grade, ranging from 0 to 12, resulted from the sum of the three cusps and from the sum of the three commissures, respectively. Furthermore, whether the distribution of the calcifications was symmetric or not was noted.

Examples of different degrees of aortic valve calcification assessed using a semi-quantitative score: 1= minimal (panel A), 2= mild (panel B), 3= moderate (panel C), 4= severe calcifications (panel D).
Aortic valve regurgitation, if present before the procedure, was recorded and quantified according to standard echocardiographic colour-Doppler method (semi-quantitative score: 0–4).17
After TAVI, aortic prosthesis overlap with the anterior mitral leaflet was measured at the 2D long-axis view as the length between the junction point of the prosthesis with the right sinus of Valsalva and the ventricular free edge of the prosthesis.
The presence of post-procedural paravalvular AR was evaluated immediately after the device deployment, and after removal of the catheter and the guidewire. Post-procedural paravalvular AR was quantified according to standard echocardiographic colour-Doppler method using the jet width and extension, and graded as: 0 (absent), 1 (mild), 2 (mild to moderate), 3 (moderate to severe), 4 (severe). In the presence of multiple paravalvular AR jets visualised in the short- and long-axis TOE views, paraprosthetic AR was expressed as an overall grade. Paravalvular AR was considered significant if ≥2.
3D transoesophageal echocardiography
Measurements on 3D datasets were obtained using the QLAB 3DQ software (Philips Medical System) available on the echocardiographic system. Three-dimensional measurements of the AoA were performed during early systole in a true cross-sectional plane. In detail, 3D live and full volume images were acquired in order to obtain the visualisation of a magnified aortic root in the 30° short-axis or the 120° long-axis view. The 3D datasets were cropped using two orthogonal planes through the long-axis of the LV outflow tract. A third transverse plane was positioned parallel and immediately below the aortic valve. This ensured a true ‘en face’ view of the AoA, from which the shortest and the longest annulus diameters were measured. Annulus eccentricity was defined as 1−the ratio between the shortest and the longest annulus diameter, so that a perfect circle has an eccentricity index of zero, while a higher eccentricity index represents a more elliptical geometry. Moreover, in the same ‘en face’ view, the annulus area was measured by planimetry. The ‘area cover index’ was defined as the percentage difference between planimetered AoA area and the nominal prosthesis area (1−Annulus area/ Prosthesis nominal area). The nominal prosthesis area was calculated on the basis of the pre-specified diameter of the available prosthesis (23 or 26 mm) supplied by the manufacturer (415 mm2 for a prosthetic diameter of 23 mm, 531 mm2 for the 26 mm diameter prosthesis). This index indicates a correspondence between the two areas when it is close to 0. When the planimetered aortic annular area is smaller compared with the nominal prosthesis area, the cover index is higher. Figure 2 shows an example of the measurements of the native planimetered AoA in a 3D true cross-sectional plane.
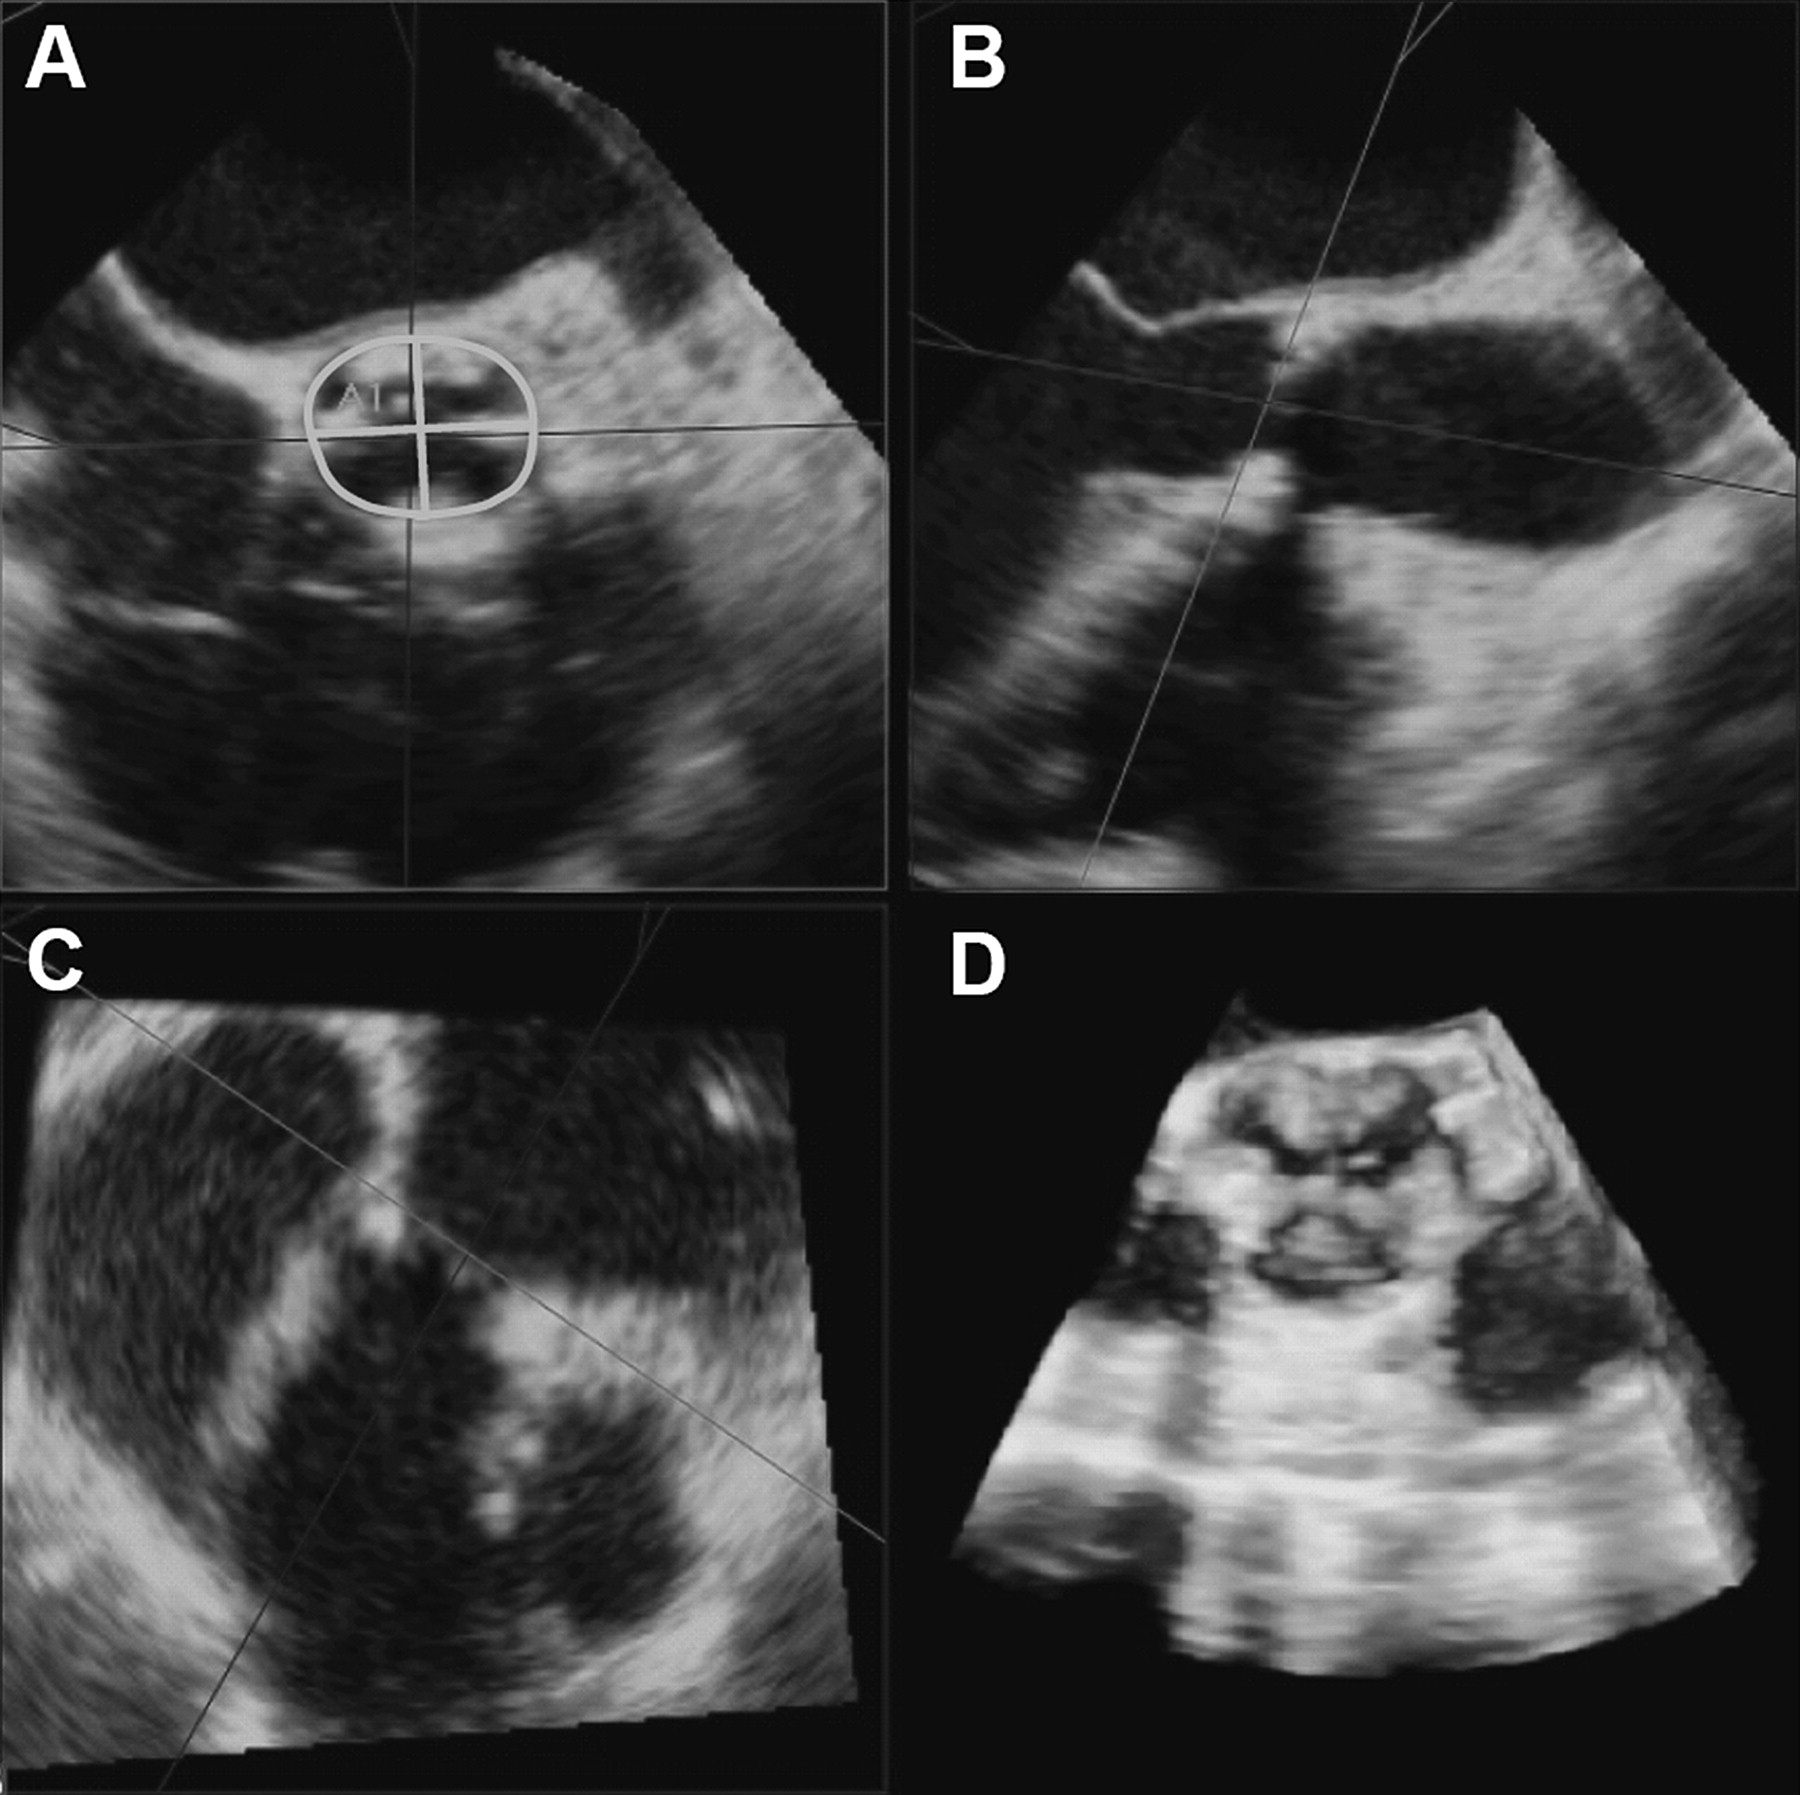
Measurements of the native planimetered aortic annulus in a 3D true cross-sectional rendering pre-transcatheter aortic valve implantation. Orthogonal diameters and planimetered area of the annulus (Panel A) are obtained through correct alignment based on 3D dataset.
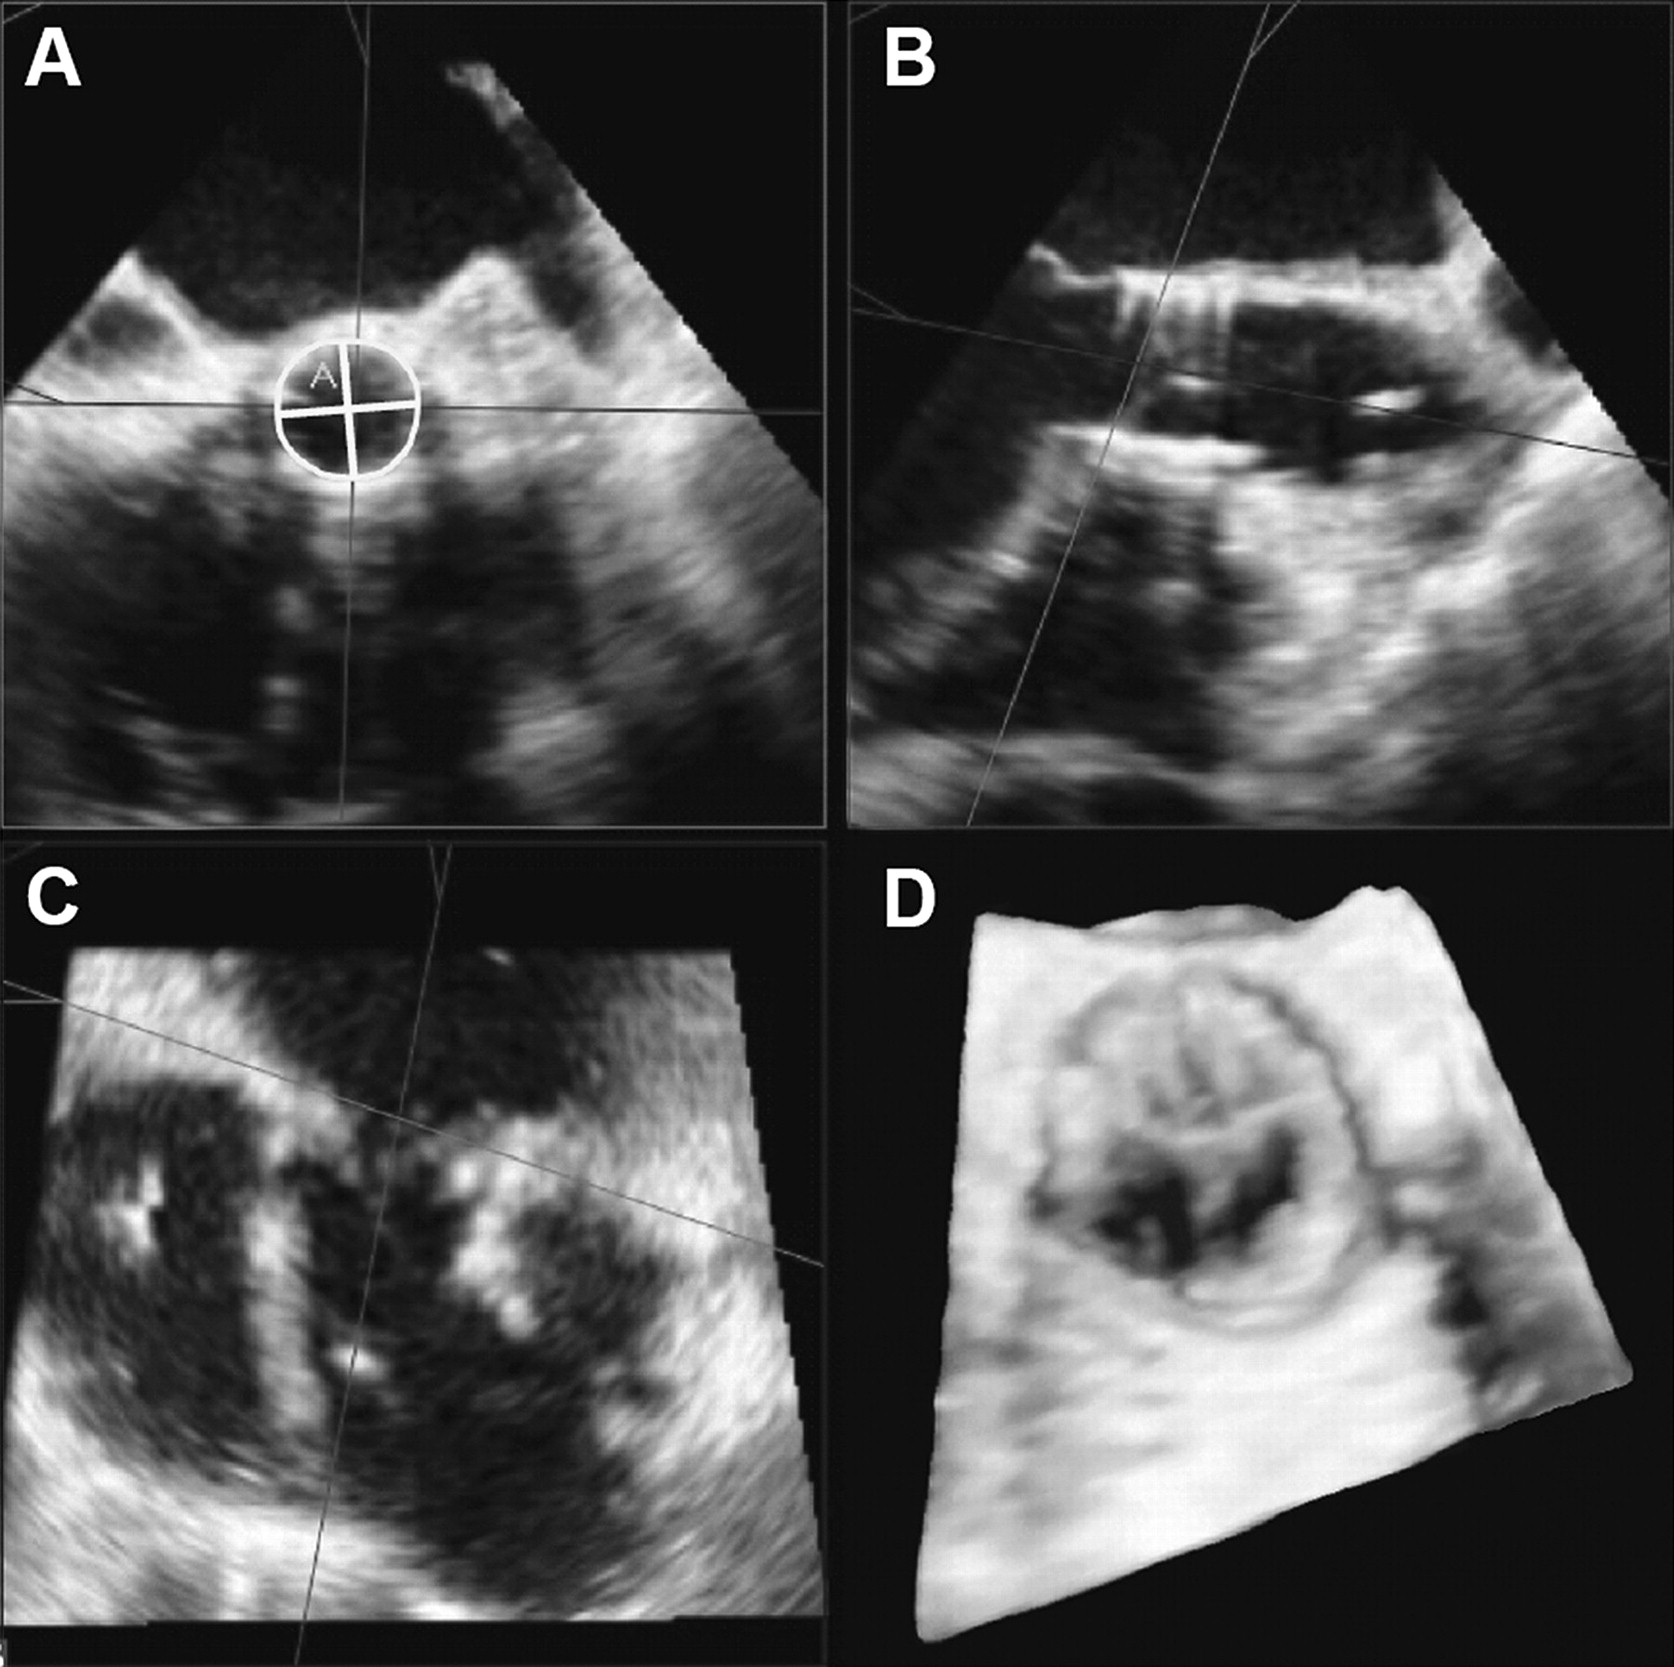
Moreover, immediately after the procedure in a 3D true cross-sectional plane of the aortic prosthesis at the level of the cusps, the device eccentricity index was calculated using the shortest and the longest diameter, and the planimetered prosthesis area was traced adopting the internal dimensions of the prosthetic valve (figure 3). In addition, the actual planimetered prosthesis area was compared both with the annulus planimetered area pre-TAVI (1-Planimetered Prosthesis/Planimetered Annulus) and with the prosthesis expected area calculated on the basis of the pre-specified diameter of the available prosthesis (1-Planimetered Prosthesis/Prosthesis Nominal Area); the percentage difference was then recorded.
3D aortic annulus after transcatheter aortic valve implantation. Annulus measurements were performed after transcatheter aortic valve implantation adopting the internal dimensions of the prosthetic valve and methods as in figure 1.
Statistical analysis
Continuous data are presented as mean ± SD and categorical variables as frequency or percentages, as appropriate. A normal distribution of continuous variables was assessed using the Kolmogorov-Smirnov test. Differences between patients with paravalvular AR<2 and patients with paravalvular AR≥2 were assessed with unpaired Student's t test or Mann–Whitney U test for continuous variables, as appropriate, and with χ2 test or Fisher's exact test for categorical variables. Several clinical and echocardiographic characteristics, pre-TAVI, were tested in a univariate logistic regression analysis in order to evaluate whether some characteristics before the procedure could help in predicting the development of significant AR after TAVI. Significant variables in univariate analysis were included in a multivariate logistic regression analysis with stepwise method for the identification of independent variables predicting paravalvular AR≥2. Goodness-of-fit was assessed using the Hosmer and Lemeshow test, in which a p value <0.05 indicated a lack of fit of the model. A p value <0.05 was considered statistically significant. All statistical analyses were performed using SPSS V.17.0 (SPSS Inc).
Measurements were performed by two different operators, one per each involved institution. The inter-observer variability has been assessed in terms of coefficient of variation (the ratio of SD of the differences to the mean value) and 95% limits of agreement at Bland-Altman analysis between repeated measurements on a randomly chosen subset of 25 patients.
Results
Successful TAVI, defined as correct positioning and successful device deployment within the aortic valve without periprocedural major adverse cardiovascular and cerebral events, was reached in all patients. Paravalvular AR immediately post-TAVI was graded: 0 in 42 patients, 1 in 65 patients, 2 in 25 patients, 3 in 2 patients and 4 in 1 patient. The incidence of paraprosthetic AR≥2 was 21% (28 patients) immediately after the procedure. Of note, of the three patients with AR≥3 immediately after the procedure, one patient (AR=4) underwent the implantation of a second device, while in the remaining two patients balloon inflation was repeated and the maximal expansion of the valve was reached, with a significant decrease of paraprosthetic AR.
AoA parameters were found to be highly reproducible on inter-observer variability (coefficient of variation: shorted diameter 4.9%, longest diameter 4.1%, planimetered area 8.8%). Moreover, the results of Bland-Altman analysis showed limited bias and narrow limits of agreement (shorted diameter: bias 0.9 mm, LOA: 2.7 mm, longest diameter bias 0.0 mm, LOA: 3.3 mm, AoA planimetered area bias 0.3 cm2, LOA: 1.0 cm2).
Baseline clinical and echocardiographic characteristics
Main clinical and echocardiographic characteristics of the overall patient population and for each group (according to the presence of post-TAVI paravalvular AR<2 and AR≥2) are listed in table 1. Clinical parameters did not show significant differences among the two groups. All patients had severe aortic stenosis (AVAi 0.38±0.10 cm2/m2, MPG 47±16 mmHg). The AR grade before TAVI was similar between the study groups. In addition, LV volumes and ejection fraction were not significantly different between the groups. The mean annulus eccentricity index pre-TAVI was 0.11±0.08, and the mean ‘area cover index’ was 18.5±13.0%. A trend towards a higher annulus eccentricity index was observed among patients with significant paravalvular AR, and the ‘area cover index’ was significantly lower among patients with significant paravalvular AR.
Baseline clinical and echocardiographic characteristics together with pre-procedural amount and distribution of aortic valve calcifications of the whole population, and separately for patients without and with significant paravalvular aortic regurgitation (AR)
The total amount of commissural calcifications, measured semi-quantitatively, was, respectively: 0–4 in 13%, 5–8 in 74%, 9–12 in 13% of the patients. The total amount of commissural calcifications was significantly higher among patients with significant paravalvular AR ≥2 (table 1). The commissure between the right coronary and non-coronary cusps was the most heavily calcified in 24% of cases, and was more frequently calcified among subjects with AR ≥2 (p<0.05). The amount of central calcifications was 0–4 in 16% of the patients, 5–8 in 62% of the cases and 9–12 in 22% of the aortic valves. In 24% of the aortic valves the non-coronary cusp was the most calcified, followed by the right coronary (14%) and left coronary cusp (9%). Twenty-two per cent showed a symmetric distribution of valve calcifications in all the three cusps (table 1).
Echocardiographic characteristics after TAVI
TAVI was performed through the transfemoral approach in 69 patients (51%), and through the transapical access in 66 patients (49%). Out of 135 patients, 47 patients (35%) received a 23 mm valve, while 88 patients (65%) received a 26 mm valve; there was no difference regarding valve size between the two groups with and without significant paravalvular AR. As shown in table 2, all patients showed improvements in transvalvular haemodynamics (AVAi 1.14±0.26 cm2/m2, MPG 11±4 mmHg).
Echocardiographic characteristics after TAVI
After TAVI, AoA eccentricity index decreased (0.06±0.05) (table 2). The mean prosthesis planimetered area post-TAVI was 323±52 mm2 in patients with a 23 mm device, and 385±50 mm2 in patients with a 26 mm device. The prosthesis planimetered area post-TAVI was 7.3±17.4% smaller than the native annulus area pre-TAVI; this percentage difference was similar among subjects with and without AR. The difference between the planimetered prosthesis area and the nominal prosthesis area was significantly lower in presence of paravalvular AR≥2, suggesting a certain degree of undersizing of the prosthesis despite proper expansion of the device. In addition, the length of aortic prosthesis overlap with anterior mitral leaflet was 5±2 mm, without any significant difference between the two groups.
Determinants of paravalvular AR
At the logistic regression analysis, the pre-TAVI univariate determinants of paravalvular AR≥2 post-TAVI were the degree of the commissural calcifications of the native valve, the calcification of the commissure between the right and the non-coronary cusps and the ‘area cover index’ pre-TAVI. Multivariate analysis revealed that calcification of the commissure between the right coronary and non-coronary cusps (OR=2.66, 95% CI, p=0.001), and the area cover index pre-TAVI (OR=0.95, 95% CI, p=0.006) were the only independent predictors of the presence of significant paravalvular AR (R2=0.52). The model displayed satisfactory goodness-of-fit (p=0.26).
Discussion
The main findings of the current study are the following: (1) 3D-TOE allows a complete and detailed evaluation of the anatomy of the aortic valve apparatus before the procedure, as well as of the prosthetic valve immediately after TAVI; (2) the degree of calcification, particularly of the commissure between the right coronary and non-coronary cusps, and ‘area cover index’ represent independent predictors of significant paravalvular AR.
Many trials have shown that TAVI is feasible and provides haemodynamic and clinical improvement in high-risk patients with symptomatic severe aortic stenosis.3 ,5 ,8–10 However, the development of post-procedural paravalvular AR is one of the most frequent complications after TAVI. Although previous studies showed that paravalvular AR was mild in the majority of cases,1 ,5 the long-term consequences of paravalvular leaks are not well established.18–21 Significant paravalvular AR post-TAVI may be due to several factors, including device malpositioning, erroneous device sizing and presence of severely calcified native valves.11 ,22 ,23 Therefore, the analysis of the mechanisms and the identification of potential determinants of significant paravalvular AR post-TAVI is important to prevent the occurrence of this complication.
Aortic valve calcifications
Incomplete device expansion due to aortic valve calcifications is believed to be one of the contributing factors to paravalvular AR post-TAVI.23 In fact, heavily calcified native aortic valves may not allow a perfect apposition of the device along the annulus circumference. This has been demonstrated in experimental series and in clinical series by using multi-detector CT.24–26 Delgado et al.11 found that patients with moderate AR post-TAVI showed more calcified native valves, as quantified by Agatston calcium score, in particular, at the level of the commissures. Koos et al24 emphasised that patients with severe aortic valve calcification had an increased risk of significant paravalvular AR as well as a trend of an increased need for second transcatheter manoeuvres (re-ballooning) after TAVI. Moreover, Zegdi et al,26 trying to define the precise characteristics of a self-expandable aortic stent deployment in humans, found that stent misdeployment, with a triangular or elliptical shape, occurred in one-third of cases of tricuspid valves; in these patients, a gap between the external surface of the stent and the inner surface of the native aortic valve was identified and located exclusively at the level of the commissures; this may occur when part of the stent frame lies on top of a large calcification. Our results, based on intraoperative 3D TOE, confirm these previous findings, showing that the calcifications of the commissure between the right coronary and non-coronary cusps are related to significant post-procedural paravalvular AR.
Area cover index
Current recommendations include echocardiography as a valuable method to size the AoA diameter and to select the correct prosthesis size.8 Although caution was recommended regarding the underestimation of the annular cross-sectional area, due to its elliptical geometry, no suggestions were provided to overcome this problem. 3D TOE, as previously reported by Ng et al,27 allows a direct tracing the planimetered area of the AoA without geometric assumptions: despite a 3D underestimation of annulus area compared with the same measurement performed with CT, considered as the gold standard, a good correlation with narrow limits of agreement was found between the two methods.
Considering the fact that the 3D echocardiographic measurement of the AoA is feasible and accurate, we tried to identify a relationship between the planimetered annular area, the nominal prosthesis expected area and the presence of post-TAVI paravalvular AR. The area cover index pre-TAVI was significantly lower among patients with significant post-procedural paravalvular AR, suggesting that a certain degree of prosthesis oversizing is needed to ensure a good procedural result. Similarly, Detaint et al28 found a significant relationship between large annulus size and the occurrence of significant paravalvular AR; to appraise the congruence between annulus and device they used a ‘cover index’ that compared 2D echocardiographic AoA diameter and prosthesis diameter and found a significant relationship between low cover index and AR.
In addition, the multivariate logistic regression analysis performed in this study demonstrated that calcification of the commissure between the right coronary and non-coronary cusps and a low ‘area cover index’ pre-TAVI were also independent and reliable predictors of post-procedural significant paravalvular AR. Therefore, important morphological aspects, related to the severity, as well as the localisation of valvular calcification, may play a role in the development of paravalvular AR, leading to an abnormal deployment of the prosthesis in terms of irregular shape or inadequate adhesion of the prosthesis itself to the native valve. Moreover, a low ‘area cover index’ predicts the development of significant post-procedural paravalvular AR suggesting that this index could be utilised as an additional parameter when choosing the prosthetic size in all those patients with borderline 2D TOE annulus size. The ‘area cover index’ and the availability of larger prostheses may reduce the incidence of significant paravalvular AR, avoiding prosthetic undersizing and simultaneously allowing a better fit.
Evaluation of prosthesis deployment with 3D TOE
To date, few studies have evaluated the deployment characteristics of the transcatheter bioprosthesis.11 ,27 ,28 In this field, 3D TOE may provide a good visualisation of the device, allowing the assessment of the quality of its expansion and its positioning with respect to near structures. Our data demonstrated that a 3D TOE morphological evaluation of the device post-TAVI was feasible in 135 patients in a routine clinical setting, allowing the assessment of several parameters. Among our 135 patients, the mean prosthesis planimetered area post-TAVI was 323±52 mm2, and 385±50 mm2 in patients with a 23 mm and 26 mm device, respectively. The prosthesis planimetered area post-TAVI was approximately 7.3±17.4% smaller than the native annulus area pre-TAVI in the whole population (and with no differences between patients with and without significant paravalvular AR), suggesting a satisfactory prosthesis deployment. Despite the successful deployment, the prosthesis planimetered area remained smaller than the annulus area pre-TAVI, mainly because the actual dimension of the device expansion is limited by the annular stiffness and the severity of cusps and commissural calcifications. Moreover, the implanted prosthesis does not reach in vivo the expected nominal area as previously described.29 In the current study, the difference between planimetered and nominal prosthesis area was significantly lower in patients with paravalvular AR ≥2 compared with patients without regurgitation, suggesting a proper deployment of a relatively undersized device.
Study limitations
This study considers only the balloon-expandable valve. However, the aim of this study was not to compare the echocardiographic predictors of AR in different devices. In addition, the precise quantification of AR following TAVI is still problematic and relies only on colour-Doppler imaging; further studies are needed to clarify this topic. Furthermore, only a limited number of variables, pre-procedure, were tested in the regression analysis, given the relatively few cases with significant AR. In the present series, patients with paravalvular AR have asymmetrically calcified valves with a high frequency of calcification of the commissure between the right coronary and non-coronary cusps. However, the relatively limited number of patients with significant paravalvalvular AR preclude us from observing significant differences in terms of other locations of calcifications.
Finally, a limitation of this study could be the absence of a comparison between 3D TOE AoA measurements and respective values obtained in the same subjects from other 3D radiologic techniques, such as CT. However, the assessment of the accuracy of 3D TOE imaging versus other techniques was beyond the scope of this study, which was based on the most widely available imaging approach, also feasible in the operating theatre.
Conclusions
This study suggests that intraoperative 2D and 3D TOE may allow the identification of predictors of significant paravalvular AR following successful TAVI. In particular, the presence of heavily calcified commissure between the right coronary and non-coronary cusps, and the measurement of ‘area cover index’ should be considered during patient selection for TAVI in order to minimise the development of significant paravalvular AR after the procedure.
References
Footnotes
Funding SHE is financially supported by the Ministry of Health Training Scholarship, Singapore. VD receives consultancy fees from St Jude Medical. The Department of Cardiology of Leiden University Medical Center receives research grant from Edwards Lifesciences, St Jude Medical, Biotronik, Medtronic, Boston Scientific, Lantheus Medical Imaging, St Jude Medical and GE Healthcare.
Competing interests None to declare.
Ethics approval A written consent to the study was obtained from each participant. The adopted protocol did not differ from the standard clinical protocols of each involved institution.
Provenance and peer review Not commissioned; internally peer reviewed.