Article Text

Abstract
Objective To assess prevalence, incidence, prognosis and progression of degenerative valvular aortic stenosis (AS).
Setting The Tromsø Study and the University Hospital of North Norway.
Design Population based prospective study.
Population Over a 14 year span we performed three repeated echocardiographic examinations (1994, 2001 and 2008) of a random sample of initially 3273 participants. Data from the only hospital serving this population were included.
Results There were 164 subjects with AS. Prevalence consistently increased with age, average values being 0.2% in the 50–59 year cohort, 1.3% in the 60–69 year cohort, 3.9% in the 70–79 year cohort and 9.8% in the 80–89 year cohort. The incidence rate in the study was 4.9‰/year. The mean annual increase in mean transvalvular pressure gradient was 3.2 mm Hg. The increase was lower in mild AS than in more severe disease, disclosing a non-linear development of the gradient, but with large individual variations. Mortality was not significantly increased in the asymptomatic AS-group (HR=1.28), nor in those who received aortic valve replacement (n=34, HR=0.93), compared with the general population.
Conclusion This is the first study to document the incidence and prognosis of AS in a general population with surgery as a treatment option. It reveals an accelerated progression of the aortic mean gradient as the disease advances. The prognosis of AS seems to be comparable with the normal population in the asymptomatic stage and after successful surgery, indicating that the follow-up and timing of surgery has been adequate for this patient group.
- Aortic Valve Disease
- Epidemiology
- Echocardiography
- Public Health
- Cardiac Function
- Cardiac Remodelling
- Diastolic Dysfunction
- Haemodynamics
- Systolic Dysfunction
Statistics from Altmetric.com
- Aortic Valve Disease
- Epidemiology
- Echocardiography
- Public Health
- Cardiac Function
- Cardiac Remodelling
- Diastolic Dysfunction
- Haemodynamics
- Systolic Dysfunction
Introduction
Calcific aortic valve disease refers to a pathological process of lipid infiltration, inflammation and calcification of the aortic valve leaflets.1 It constitutes a spectrum of disease from aortic sclerosis to severe aortic stenosis. Calcific aortic valve disease is the most common cause of aortic stenosis (AS) among adults in the western world, and includes both bicuspid and tricuspid valves.2 ,3 Prevalence increases with age,4–6 and severe AS, if left untreated, is fatal a few years from symptom onset.7–9 No medical treatment has been shown to attenuate the progressive valve calcification, nor improve survival.10–14 The treatment of choice has been aortic valve replacement (AVR), and in recent years transcatheter aortic valve implantation (TAVI) has emerged as an option.15–18
Prevalence studies have been conducted previously, and several authors have investigated the prognosis and progression of clinical AS, but to our knowledge there are no population-based incidence studies or progression studies available.
Methods
Study population
The Tromsø Study was initiated in 1974 and is an ongoing population-based cohort study in the municipality of Tromsø, Norway.19 Tromsø is a city in Northern Norway with 67 000 inhabitants. The cohort consists of complete birth cohorts and random samples of other cohorts examined in 1974, 1979, 1986, 1994, 2001 and 2008 (T1-T6). A total of 40 051 citizens participated in at least one of the surveys, attendance rates being >75% in T1–T5 and 66% in T6. The study obtained information concerning cardiovascular diseases and risk factors through standardised questionnaires, physical examinations and laboratory tests.
In T4, subgroups of the participants were invited to a second visit with extended examinations, including echocardiography (figure 1). They represent a cohort within the cohort and have been the basis for invitations to second-visits in T5/T6. All subjects aged 55–74 as well as smaller (5%–8%) random samples of other age groups (25–84 years) were invited, with an attendance rate of 76%. The echocardiography subgroup consisted of 3273 subjects. Of these, 1950 were re-examined in T5. There were 1456 participants in T6, 1123 of them had been examined with echocardiography in T5 and 333 in T4. During follow-up, 236 had moved/emigrated and 805 had died. There were 953 subjects not attending echocardiographic screening in T5 and 891 in T6.
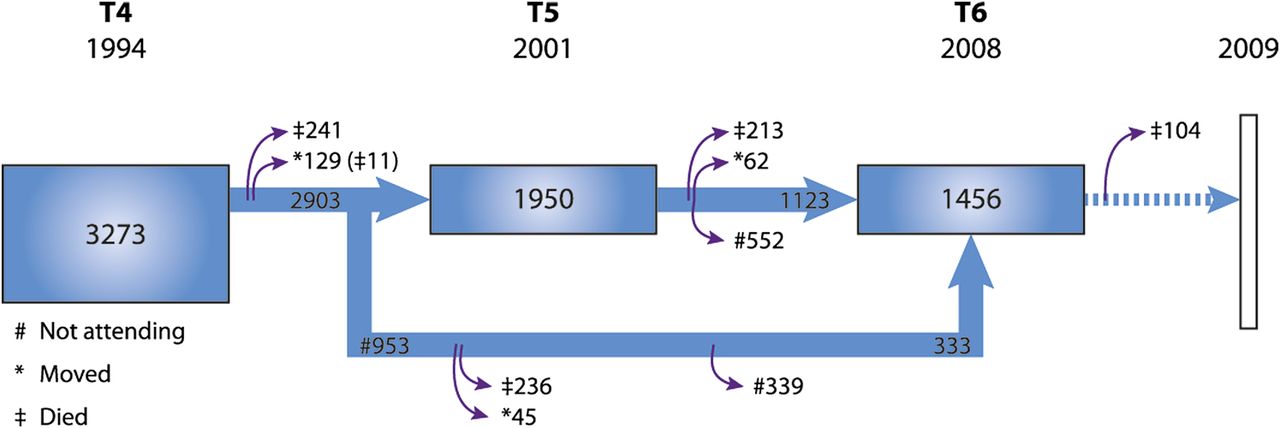
Flow chart of the cohort in the Tromsø Study who had an echocardiographic examination performed in 1994, 2001 and 2008. There was a follow-up registration of death for the cohort until 2009.
To compensate for the incomplete attendance we retrospectively integrated data collected from the only hospital serving the study population. We retrieved data from patient records both from those re-examined in T5 or T6 and those dying, emigrating or not attending further re-examinations after T4. Due to the scattered arctic population the distance to the closest hospital outside our region treating AS exceeds 1000 km, making it probable that the database was almost complete. Data registered were hospital diagnosis of AS, the first and last measured aortic mean gradient and examination dates. Decisions regarding treatment of symptomatic patients were also recorded, classified as either surgical or conservative treatment. The conservatively treated group consisted both of patients with comorbidity preventing them from choosing surgery (n=7) as well as patients refusing it (n=6).
We had vital data on all subjects from the National Death Registry until 2009.
Echocardiography
All echocardiographic examinations were performed according to the American Society of Echocardiography's Guidelines.20 In T4 we used a VingMed CFM 750 (VingMed Sound A/S Horten, Norway) with a 3.25 MHz mechanical and 2.5 MHz Doppler probe and in T5/T6 an Acuson Sequoia C256/C512 with a combined 3.5 MHz second harmonic ultrasound and 2.5 MHz Doppler probe (Acuson, Mountain View, California, USA) having a frame rate of 70 frames/s.
The screening included complete evaluation of cardiac anatomy and function. Two-dimensional assessment of the aortic valve was performed from the parasternal long axis, short axis and apical five-chamber view. Aortic valve morphology, diameter and cusp separation in short axis and aortic velocity time integral giving jet velocity, mean gradient and maximal gradient, were recorded. Aortic valve area was not calculated in any of the surveys. Those with any pathology were referred to the outpatient ward for further follow-up.
We defined AS to be present if the transvalvular mean gradient was ≥ 15 mm Hg and graded as follows: mild AS ≥15–29 mm Hg, moderate AS ≥30–49 mm Hg, severe AS ≥50 mm Hg. Those with mean gradients ≥15 due to aortic regurgitation alone or subaortic stenosis were not classified as AS (n=4 in T5, n=3 in T6).
The screening of aortic stenosis had some limitations in T4. Aortic jet velocity was not routinely measured in all subjects, only in those with any indication of pathology (turbulent flow or aortic valve separation <1 cm in parasternal short axis, M-mode).
Intraobserver and interobserver studies were performed both in T5 (n=40) and T6. The Bland Altman test of 42 participants in T6 showed mean interobserver differences (95% limits of agreement) in the mean aortic gradient of −0.06 mm Hg (−3.06 to 3.18). Intraobserver analysis gave a mean difference of −0.04 mm Hg (−1.86 to 1.78) and 0.30 mm Hg (−3.96 to 4.56).
Statistics
Prevalence
We performed prevalence calculations, first as point prevalence related to the surveys in T4, T5, T6 and as a weighted mean of all three studies combined (T4/5/6). The study population was divided into four age-cohorts. Those with prior AVR were included. Second we calculated prevalence numbers by adding information of prevalent AS from hospital data at the same time points as the surveys. Doing this, we followed the original study population (n=3273) at three time points, retracting the number of dead at each step from the denominator in the prevalence calculations.
Incidence
We used the following equation: Incidence rate/year = X/(N–½ C–½ X), when X= number of incident cases with AS, N= number in the study population and C= censored participants.
Mortality
Survival analysis was conducted using an extended Cox Proportional Hazards model with time-dependent variable for groups (AS/No AS), adjusting for age. Censoring occurred when participants moved, at the time of AVR, decision of conservative treatment or at the end of the study, not as a result of non-attendance. The same analysis was used comparing the AS subgroup treated with AVR versus those without AS. Here the time-dependent group variable changed at the time of surgery.
The analyses were carried out in SPSS, V.18.0. Significance was regarded as p<0.05.
Ethics
This study was approved by the Regional Ethical Committee. All participants gave written consent to scientific use of the health survey data and linkage to death and health registries. Our study complies with the Declaration of Helsinki.
Results
The mean age in the three echocardiography surveys was 60.0, 66.1 and 70.3 years, respectively. The proportion of women and men were equal. The mean age of the AS population in each survey was 68.4, 74.0 and 77.4 years (table 1).
Characteristics for the total cohort and the subgroup having aortic stenosis
In the three surveys there were 30, 59 and 52 participants with AS, most of them had mild or moderate disease (table 1).
When hospital data were added a total of 164 subjects had AS. Four had AVR prior to T4, 26 were detected in T4, making 134 of them incident cases discovered throughout the observation period. Of these, 49 were diagnosed at the hospital after initial screening in T4.
At the end of the study, AS stage status was: mild AS 70, moderate AS 34, severe AS 26 and AVR 34. Of these 54 had died. A left ventricular ejection fraction < 50% was seen in four participants with mild AS, in five with moderate AS and in 12 of those with severe AS.
The age at detection of AS was significantly different in women and men with a mean age of 76.1 years and 73.3 years, respectively (T-test p dif. value: 0.009). This is not found in the subanalysis of the 49 AS participants detected due to clinical signs and symptoms at the hospital, with women having a mean age of 77.8 years and men 76.8 years (T-test p dif.value 0.55). The gender difference in age at detection of AS in the population screening can mainly be explained by a higher death rate in men. In our population sample men had a mean lifetime of 74.6 years versus women 76.4 years.
Prevalence
The results of the prevalence calculations both for the surveys and after inclusion of hospital data are displayed in table 2. At all three time points we consistently found an increase in prevalence with age, weighted mean values in the combined survey ‘T4/5/6 and hospital data’ being 0.2% (95% CI 0% to 0.4%) in the 50–59 year cohort, 1.3% (95% CI 0.9% to 1.7%) in the 60–69 year cohort, 3.9% (95% CI 3.2% to 4.6%) in the 70–79 year cohort and 9.8% (95% CI 7.8% to 11.8%) in the 80–89 year cohort (figure 2). Thus, the prevalence increases exponentially with age. In figure 2 we have also indicated the numbers of those who had undergone AVR in the different age cohorts as of 2008.
Prevalence numbers (%) are calculated for four age cohorts in T4, T5 and T6, and also as a weighted mean of all three surveys. Those with prior AVR were included. We also calculated prevalence numbers by adding information of prevalent AS from hospital data at the same time points as the surveys. Doing this, we followed the original study population (n=3273) at three time points, retracting the number of dead at each step from the denominator in the prevalence calculations

Prevalence of aortic stenosis. The figure shows weighted mean values in the combined survey of Tromsø 4, 5 and 6, with hospital data included. The surgery group is included in the main group.
There were no sex differences in point prevalence with increasing age. The sex difference in numbers with AS could be explained by differences in age distribution between men and women.
Incidence
Following the initial study population (n=3273) we found 49 incident cases in T5. In T4–T5 (1994–2001) the incidence rate was 2.7‰/year (95% CI ±0.75‰). The subjects (1950) followed from T5–T6 (2001–2008) had 24 incident cases and thus an incidence rate of 2.2‰/year (95% CI ±0.89‰). For the total survey period T4–T6 (1994–2008) we added 13 new cases from T4–T6 who had bypassed T5. Summarised, this gave 86 cases of AS identified at surveys with an incidence rate of 3.1‰/year (95% CI ±0.65‰).
When data from the hospital were added, the number of incident cases with AS in the T4–T5 period increased to 63 and in T5–T6 to 64, with an increase in incidence rates to 3.5‰ (95% CI ±0.85‰) and 4.3‰ (95% CI ±1.0‰), respectively.
Throughout the study period T4–T6 the summarised number of incident cases was 134. The dataset for the whole period, including those detected at the hospital only, thus gave an incidence rate of 4.9‰/year (95% CI ±0.81‰).
Progression
A subgroup of 118 participants with AS had two or more measurements of the mean gradient at any occasion (study and/or hospital registered measurements). They had a mean follow-up time of 6.4 years (range 1–14 years). The mean progression/year was 3.2 mm Hg, with a wide SD of 2.36 and a range from −1.0–13.0. Subdividing them we found that the asymptomatic AS group (n=88) had a progression of 2.6 mm Hg/year, those who later underwent surgery 4.9 mm Hg/year and the conservative treatment group 4.5 mm Hg/year.
The progression rate in participants with an initial gradient ≥30 mm Hg was 4.5 mm Hg/year, exceeding the rate of 3.0 mm Hg/year in those with a gradient <30 mm Hg (p<0.05). Summarised, these results demonstrate a more rapid progression with advancing valve calcification.
Forty-three AS participants had the aortic mean gradient measured both in T5 and T6. Five underwent surgery during the follow-up period, leaving 38 subjects for repeated measurement analysis. As figure 3 shows, there is a wide variation in the progression rate, with a tendency for higher rates in those with higher gradients at baseline.

Progression of aortic stenosis. The figure shows the progression of the mean gradient (mm Hg) in a subgroup of 38 participants with measurements in both T5 and T6, delineating a large individual variability in disease progression and trend towards an increasing progression rate in the more advanced disease stages.
Mortality
The number of deaths among the 3273 participants followed from 1994 was 805 (24.6%) until December 2009.
The cohort was divided into four groups (number of dead): no AS 3009 (751), asymptomatic AS 117 (41), AS with surgery 34 (6) and AS with conservative treatment 13 (7). In the surgical group 28 were treated due to valve disease (25 AVR/3 TAVI), whereas five participants had bypass surgery as the primary indication and additional AVR due to mild/moderate AS. In one case AVR was performed because of endocarditis/moderate AS. When comparing the AS-group with the no-AS group at a given time point there was no significant difference in age adjusted survival, HR=1.28 (95% CI 0.94 to 1.76). Subanalysis showed no significant difference in mortality between mild, moderate or severe asymptomatic AS. Analysis of the AS surgery group versus those without AS also gave no significant difference in age adjusted survival, HR=0.93 (95% CI 0.42 to 2.08).
When evaluating causes of death an age adjusted logistic regression analysis disclosed an increased risk of cardiovascular death in the AS group (57.4%) compared to the normal population (37.1%) with a HR of 2.14 (95% CI 1.21 to 3.76).
Discussion
Much of current knowledge concerning AS is based on hospital series. Since the disease progresses over years with a long asymptomatic phase, such data can never give a full picture of the prevalence and development of AS. Therefore, population based data are necessary. In this study we provide such data.
The wide time span enabled us to follow this slowly progressive disease over 14 years, adding knowledge to standard clinical descriptions of the condition. We believe this is the first epidemiological study to provide incidence data and progression data based on representative population samples. In addition it is the first epidemiological study on AS to give mortality data in the era of surgical treatment.
Our data delineate AS as a progressive disease accelerating both with age and degree. Prevalence increases exponentially with age. There was no evidence of increased mortality compared to the normal population, neither in the asymptomatic group nor in those successfully operated.
It is recommended to use AS jet velocity, mean transaortic gradient and the valve area for clinical evaluation of AS severity.21 We used the mean gradient as the primary measure. It is easy to obtain, though malalignment of the jet and ultrasound beam, neglect of an elevated proximal velocity and the phenomenon of pressure recovery are known sources of error. The presence of aortic regurgitation may increase the mean gradient, though rarely significantly unless it is severe. Systolic left ventricular dysfunction can give low gradients despite a severe AS. These factors were considered when we graded participants with AS, but none changed classification due to this. We cannot rule out the possibility of minor stage misclassification related to a reduced ventricular function.
Aortic valve area was not used in our study as it is more prone to errors of measurement and inaccuracy.21–23
Despite a regular screening program 49 of 160 new cases (30.6%) with AS were not discovered through screening. Many of the non-attendees at T5/T6 who later were diagnosed with AS at the hospital, had mean aortic gradients between 10 and 15 mm Hg/aortic sclerosis when last attending the study. This implies that a screening program aimed at identifying AS patients for clinical purposes must have shorter intervals and a higher attendance rate than in our study.
The prevalence numbers confirm the data from previous cross-sectional population studies, delineating AS as strongly associated with age.4–6
Incidence numbers increased during the study due to ageing of the population. The study period T5–T6 differs from the others with an incidence of only 2.2‰. The fraction of non-attendees in this period was 26%, 13% died and 4% moved. We believe this contributed to an under-estimation of incident cases, as demonstrated by the joined study/hospital data, giving a doubled incidence rate for that period.
Previous prospective natural history studies of AS patients have disclosed an overall annual progression rate in jet velocity of 0.3 m/s/yr and in mean gradient 7 mm Hg/yr.8 ,24 More recent data from medical trials of statin therapy for mild/moderate AS showed somewhat slower rates of progression with an increase in mean gradient of 3–4 mm Hg/yr.10 ,11 These figures are compatible with our results, showing a mean gradient increase of 3.2 mm Hg/yr.
In addition, our progression analysis reveals a non-linear development of the disease, being more rapid with increasing mean gradient. One could explain this by assuming there is a constant calcification process over time. A given narrowing of an already small valve area has a greater influence on the jet velocity/gradient than the same degree of narrowing by calcification in a valve with only slight/moderate area reduction. Regardless of the initial gradient participants did however show a large inter-individual variability in disease progression. Our data implies that previous progression rate should be implemented as a factor when considering future visit intervals for each patient.
In 1968 Ross and Braunwald published an important paper showing a dramatic increase in the mortality of patients with AS after symptom onset.7 This contributed to a worldwide policy of selecting AS patients to surgery based on symptoms. At that time rheumatic disease was still prevalent, the mean age at death was 63 years and echocardiography was not implemented in the evaluation of the disease. The study therefore does not represent the epidemiology of AS today, being dominated by octogenarians with degenerative AS.
One previous population-based study evaluating mortality reported a markedly increased risk of death in those with severe AS (relative risk (RR)=3.93).25 No participants underwent valve surgery, which makes the study less representative in view of today's active treatment strategy. Pellikka et al performed a follow-up study of 622 asymptomatic AS patients recruited from an echocardiography database.26 Comparing them with a matched general population a non-significant trend towards increased all-cause mortality after 2 years of follow-up was observed. Consistently, our population based mortality data showed no significantly increased mortality in the asymptomatic AS group (HR = 1.28) or in those treated with AVR.
Our population-based mortality data show no significantly increased mortality in the asymptomatic AS group or in those treated with AVR compared with the general population, indicating that the AS-patient group has received qualified follow-up and appropriate timing of the surgical interventions. The screening with secondary follow-up may of course have contributed to this low death rate. Our subanalysis showed no significant difference in mortality between mild, moderate or severe asymptomatic AS. This finding could be limited by misclassification related to low-flow participants.27 ,28 As expected, the conservatively treated subgroup had the worst survival outcome, although some survived for several years after onset of symptoms (mean 2.3 years, range 0.1–5.6 years).
Limitations
The limitations of the study are closely related to its strengths. In a voluntary population-based screening program everybody will not attend all screenings. The high age of the population makes the results more relevant, but a high drop-out rate must be expected due to disease and death from various causes. We believe, however, that this limitation to a large extent was compensated for by the inclusion of probably almost complete hospital information from the same population.
As described, some mild cases of AS may have been overlooked in T4. This is consistent with the finding of lower prevalence numbers for T4 compared to T5 and T6. On the other hand, the trend of increasing prevalence of AS with age was present also in T4. The aortic mean gradient was not measured from multiple windows, thus some cases of AS may have been more severe than recorded.
Conclusions
The study describes the evolving epidemiology of aortic stenosis. It reveals an exponential increase in the prevalence of AS with age and an incidence of 4.9‰/year in a general population. The analysis of disease progression may be interpreted as expressing a steady calcification rate, resulting in an increasing gradient progression rate as the disease advances. The large variability in progression rate demands follow-up routines that are individually adjusted as described in current guidelines. Mortality data gave survival estimates comparable with those of the normal population.
Acknowledgments
The authors thank Tom Wilsgård for statistical support.
References
Footnotes
-
Contributors All authors have read and approved the manuscript. They have also sufficiently contributed to conception and design of the study, analysis and interpretation of the data, drafting of the manuscript or revising it to justify authorship.
-
Funding This study was supported by the Northern Norway Regional Health Authorities (PhD grant number SFP-727-08).
-
Competing interests None.
-
Ethics approval Ethics approval was provided by The Regional Committee for Medical and Health Research Ethics, Northern Norway. rek-nord{at}fagmed.uit.no
-
Provenance and peer review Not commissioned; externally peer reviewed.