Article Text

Abstract
Objective To assess the seasonality of cardiovascular risk factors (CVRF) in a large set of population-based studies.
Methods Cross-sectional data from 24 population-based studies from 15 countries, with a total sample size of 237 979 subjects. CVRFs included Body Mass Index (BMI) and waist circumference; systolic (SBP) and diastolic (DBP) blood pressure; total, high (HDL) and low (LDL) density lipoprotein cholesterol; triglycerides and glucose levels. Within each study, all data were adjusted for age, gender and current smoking. For blood pressure, lipids and glucose levels, further adjustments on BMI and drug treatment were performed.
Results In the Northern and Southern Hemispheres, CVRFs levels tended to be higher in winter and lower in summer months. These patterns were observed for most studies. In the Northern Hemisphere, the estimated seasonal variations were 0.26 kg/m2 for BMI, 0.6 cm for waist circumference, 2.9 mm Hg for SBP, 1.4 mm Hg for DBP, 0.02 mmol/L for triglycerides, 0.10 mmol/L for total cholesterol, 0.01 mmol/L for HDL cholesterol, 0.11 mmol/L for LDL cholesterol, and 0.07 mmol/L for glycaemia. Similar results were obtained when the analysis was restricted to studies collecting fasting blood samples. Similar seasonal variations were found for most CVRFs in the Southern Hemisphere, with the exception of waist circumference, HDL, and LDL cholesterol.
Conclusions CVRFs show a seasonal pattern characterised by higher levels in winter, and lower levels in summer. This pattern could contribute to the seasonality of CV mortality.
Statistics from Altmetric.com
Introduction
Cardiovascular diseases (CVD) are the main cause of death worldwide, accounting for almost 32% of all deaths in women and 27% in men.1 Cardiovascular events have been shown to present a seasonal pattern, their rates being higher in winter than in other seasons.2 Several explanations have been put forward, from misclassification of CVD deaths3 to changes in air temperature.4 A study conducted in 15 European cities showed that a decrease in air temperature of 1°C could lead to a 1.72% increase in the number of CVD deaths.5 Seasonal patterns for cardiovascular risk factors (CVRF) have also been suggested for Body Mass Index (BMI),6 waist circumference,6 blood pressure,7 lipids,8 and glycaemia.9 However, most studies assessing the seasonality of CVRFs have been conducted in relatively small studies or focused on a single CVRF.
Thus, the aim of this study was to assess whether CVRFs present a seasonal pattern, and if so, if this pattern is reproducible between countries. We used data from over 230 000 subjects from 24 studies (Northern Hemisphere: 192 129, Southern Hemisphere: 45 850) to achieve this aim.
Methods
Studies included and data collection
Data from 24 population-based studies from 15 countries were included (Australia, Belgium, Czech Republic, Denmark, France, Italy, Lithuania, New Zealand, Northern Ireland, Norway, Portugal, Principality of Liechtenstein, Russia, Spain and Switzerland). The studies were initially gathered by the Prevention, Epidemiology and Population Science section of the European Association for Cardiovascular Prevention and Rehabilitation (EACPR), and other studies considered of interest were then invited. Twenty-one studies were from the Northern Hemisphere and three from the Southern Hemisphere. Information for the following CVRFs was collected: BMI; waist circumference; systolic (SBP) and diastolic blood pressure (DBP); total, high (HDL) and low (LDL) density lipoprotein cholesterol; triglycerides (log-transformed values) and blood glucose. Only data with the following criteria were considered: adult (≥18 years) participants, objectively measured (non-self-reported) data, and data collection at least during an entire year. Missing data for a single month was not considered as an exclusion criterion for a study.
Each study provided monthly adjusted means and their associated SEs for the CVRFs available. Within each study, BMI and waist were adjusted for age (continuous), gender and current smoking (yes/no). For blood pressure, lipids and glucose levels, further adjustments on BMI and drug treatment (yes/no) were performed. A description of the studies is provided in online supplementary table S1.
Statistical analyses
Statistical analyses were performed using R Development Core Team (2011).10 To assess seasonality of CVRFs, weighted fixed-effects models including cosinor were used for testing a sinusoidal pattern, that is, a function assuming a cyclical and symmetrical behaviour of CVRFs over time and over their estimated mean.11 Due to the opposite seasons in both Hemispheres, specific models according to Northern or Southern Hemisphere were applied. For each hemisphere, a joint model including the study indicator variable besides sine and cosine functions was adjusted where CVRF is the vector of the reported means,
  is the estimated mean,
  and
and  are, respectively, the associated coefficients of sine and cosine functions,
  is the time period, corresponding to the monthly data,
  is the number of time periods described by the sinusoidal curve to assess yearly seasonality with one minimum value (nadir) and one maximum value (peak) per year, and
  is the associated coefficient of the indicator variable for the study i, assuming that there are n studies. The amplitude, that is, the distance from the mean to the peak or nadir, was estimated as
  ; and therefore, the seasonal variation, that is, the maximal difference between peak and nadir, was 2*amplitude. The month of the two extreme values, nadir and peak in (0,T) were estimated by solving
  . If
. If  : t indicates the month of the first extreme (the peak if
  , the nadir otherwise) and t+T/2 the month of the second one (the nadir if
  , the peak otherwise). If
  , the month of the first extreme is found at t+T/2, and the month of the second one at t+T. The percentage of the between-month variance explained by the sinusoidal curve was estimated using the adjusted R2 measure.
A simulated effect attributable to seasonal variations in CVRFs was modelled by calculating the 10-year risk of dying from CV for the age range 40 years to 65 years using Stata V.12.1 (Stata Corp, College Station, Texas, USA). Simulations were conducted using the SCORE model for low-risk countries12 for countries in the Northern Hemisphere, and using the recalibrated Australian SCORE equation13 for countries in the Southern Hemisphere (see online supplementary appendix 2). Briefly, the absolute difference on 10-year risk of dying from CV disease between the peak and the nadir months for participants aged between 40 years and 65 years was modelled by introducing in the SCORE equation the seasonal variation of each CVRF. Within each hemisphere, the simulations were conducted taking into account gender, smoking status and age group, and using seasonal variation of systolic blood pressure and total cholesterol.
Results
Characteristics of participants
The characteristics of the participants in the different studies are summarised in online supplementary table S1. There were 192 129 participants in the Northern Hemisphere and 45 850 in the Southern Hemisphere. Age ranged from 18 years to 99 years, most studies presenting a mean age between 50 years and 60 years. Women represented half or more of the participants, with the exception of BELSTRESS and the Workforce Diabetes Survey where this percentage was considerably lower; the PRIME Belfast study included only men. Finally, the percentage of current smokers varied between 15% and 70% in men and between 8% and 58% in women.
Seasonality analyses
Seasonal analyses were carried out using data adjusted for age, gender and current smoking (yes/no). For blood pressure, lipids and glucose levels, further adjustment on BMI and drug treatment (yes/no) was performed. Table 1 summarises the estimated seasonal variation, nadir and peak when a seasonal pattern was observed for a given CVRF, and adjusted R2. The graphical representation of seasonal variations for anthropometric data, lipid parameters and glycaemia levels is shown in online supplementary figures S1 and S2.
Seasonal variation estimates of cardiovascular risk factors
For anthropometric variables, BMI displayed a seasonal pattern over time. The estimated seasonal variations were 0.26 kg/m2 and 0.52 kg/m2 for the Northern and the Southern Hemispheres, respectively, with corresponding nadirs occurring in July and December. For waist circumference, a seasonal variation was observed in the Northern Hemisphere only, with an estimated variation of 0.57 cm, and the nadir occurring in July. In the Northern Hemisphere, the sinusoidal curve explained over 95% of the total variance for BMI and waist, while in the Southern Hemisphere, this percentage was slightly lower, 78% for BMI and 82% for waist.
SBP as well as DBP showed a seasonal pattern (figure 1). For SBP, the estimated seasonal variations were approximately 2.9 mm Hg and 3.4 mm Hg in the Northern and the Southern Hemispheres, respectively, with nadirs occurring in June and January, respectively. For DBP, the estimated seasonal variations were 1.4 mm Hg and 0.9 mm Hg in the Northern and the Southern Hemispheres, respectively, the nadirs occurring in June and November, respectively. In the Northern Hemisphere, the sinusoidal curve explained 95% and 96% of the total variance for SBP and DBP, while in the Southern Hemisphere this percentage was 98% for SBP and 59% for DBP.

Seasonal variation in blood pressure estimated using weighted fixed-effects models including cosinor function, with one peak and one nadir for a time period of 12 months. Each study is represented as a line: dot lines and diamonds for studies in the Northern Hemisphere, and solid lines and circles for studies in the Southern Hemisphere.
Most lipid parameters showed a seasonal pattern. For triglycerides, the estimated seasonal variations were 0.02 mmol/L and 0.07 mmol/L in the Northern and the Southern Hemispheres, respectively, the nadirs occurring in April and July, respectively. In the Northern Hemisphere, for total HDL and LDL cholesterol levels, the estimated seasonal variations were 0.10 mmol/L, 0.01 mmol/L and 0.11 mmol/L, respectively, with nadirs occurring in summer months. In the Southern Hemisphere, only total cholesterol levels showed a seasonal pattern, with estimated seasonal variation of 0.21 mmol/L and the nadir occurring in October. In the Northern Hemisphere, the sinusoidal curve explained between 91% and 93% of the total variance of lipids, while in the Southern Hemisphere the percentages varied from 64% to 89%.
Glycaemia levels also showed a seasonal pattern. The estimated seasonal variations were 0.07 mmol/L and 0.17 mmol/L in the Northern and the Southern Hemispheres, respectively, the nadirs occurring in August and October, respectively. In the Northern Hemisphere, the sinusoidal curve explained 98% of the total variance of glycaemia, while in the Southern Hemisphere this percentage was lower at 67%.
Sensitivity analyses
As lipids and plasma glucose vary according to fasting status, a sensitivity analysis was performed on the 16 studies (14 in the Northern Hemisphere and 2 in the Southern Hemisphere) that collected blood samples in the fasting state. The results are summarised in table 2. Lipid as well as glucose levels showed a seasonal pattern, with estimated seasonal variation of 0.03 mmol/L for triglycerides, 0.13 mmol/L for total cholesterol, 0.02 mmol/L for HDL cholesterol, 0.12 mmol/L for LDL cholesterol and 0.08 mmol/L for glucose. Most nadirs occurred between June and July, with the exception of triglycerides, where the nadir occurred in March. Finally, the proportion of the total variance explained by the sinusoidal curve was higher than 80% for all markers studied. Graphical representation of seasonal variations for lipid parameters and glycaemia levels is shown in online supplementary figures S3 and S4.
Seasonal variation estimates of lipids and glycaemia, restricted to studies that collected fasting blood samples
Estimated impact on cardiovascular mortality
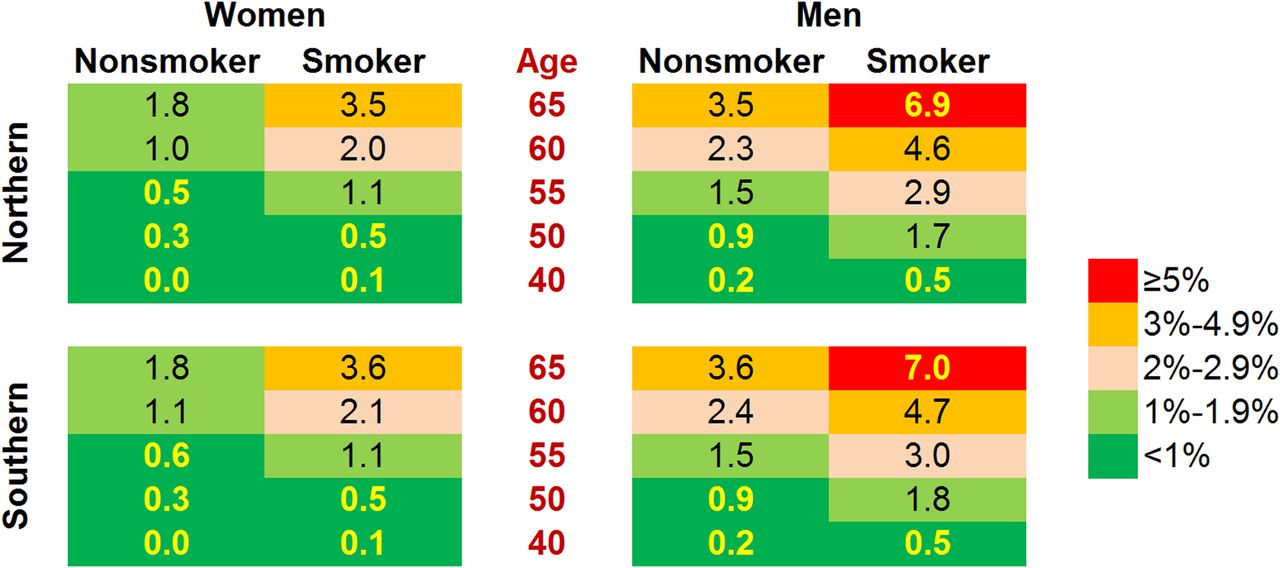
The results of the simulation of the absolute difference in 10-year risk of dying from CV disease in the peak relative to the nadir month are summarised in figure 2. Briefly, the excess risk increased with age, smoking status and male sex. For a 65-year-old man living in the Northern Hemisphere and who smoked, the excess 10-year risk of dying from CV disease in winter relative to summer was as high as 6.9%, while for a non-smoking woman aged 40 years, the excess risk was less than 0.1% (figure 2).
Effect of seasonal variation in cardiovascular risk factors on 10-year risk of dying from cardiovascular disease. The chart shows the absolute risk difference on 10-year risk of dying from CV disease between the peak and the nadir months for each hemisphere and for different gender, age and smoking combinations. Simulations were performed using the SCORE equation for low-risk countries for countries in the Northern Hemisphere, and using the recalibrated Australian SCORE equation for countries in the Southern Hemisphere.
Discussion
To our knowledge, this is the largest and most comprehensive study ever conducted to assess the seasonality of CVRFs. Our results strongly suggest that CVRFs present a seasonal pattern with lower levels in summer and higher levels in winter, suggesting that at least part of the patterning might be due to changes in air/outdoor temperature. Another possible explanation would be differences in exposure to sunlight, leading to differences in vitamin D levels and, thus, in CVRFs14; still, the effect of sunlight exposure on CVRFs has been questioned.15 Other factors such as increased levels of air pollution can also play a role. Higher concentrations of some pollutants have been associated with colder periods, and the relationship between an increased level of air pollution and cardiovascular disease has previously been established.16 Changes associated with winter/cold seasons, such as social withdrawal, the consumption of a diet with higher fat content and decreased levels of physical activity 17 can also partially contribute to the seasonal pattern. This patterning cannot be attributed to the seasonal variation of BMI, as all analyses were conducted using BMI-adjusted data. Indeed, CVRFs can be mediated by BMI, as evidenced by the complete remission or considerable improvement of high blood pressure, cholesterol or glucose levels following weight loss after caloric reduction or bariatric surgery.18 ,19 Hence, adjustment on BMI was deemed necessary prior to analysing the seasonality of the other CVRFs.
This is also the first study which includes observations from both hemispheres. As winter in the Northern Hemisphere corresponds to summer in the Southern Hemisphere, this should lead to a mirror image of seasonal variations, which was actually observed in the present study.
Anthropometry
BMI and waist circumference showed a small seasonal variation, a finding already reported in the literature.6 The most likely explanation is changes in physical activity20 or dietary intake21 during the warmer months. For instance, whereas total energy intake does not change between winter and summer, diet composition does, with a higher intake of fat-rich foods in winter.22
Blood pressure
Blood pressure values were higher in winter than in summer; this finding has been repeatedly reported.23 ,24 The seasonal variations for SBP were approximately 2.9 mm Hg and 3.4 mm Hg in the Northern and the Southern Hemispheres, respectively. The most likely explanation is changes in lifestyle or in temperature. Temperature shifts lead to arteriolar vasoconstriction, decreased sweating and increased salt load.24 ,25 Seasonal variation in the concentration of air pollutants might also influence blood pressure levels through the modulation of the autonomic nervous system, the activation of the renin-angiotensin system and the increase in endothelin.26 The higher consumption of vegetables and fruits in summer21 could also intervene via an increase in potassium intake.27 Finally, the reduced synthesis of vitamin D in winter could increase blood pressure levels, as vitamin D has been shown to inhibit the renin-angiotension system25; however, this hypothesis has been challenged.15
Interestingly, the seasonal variations observed in our study are comparable and even slightly higher than those reported for genetic scores for blood pressure,28 suggesting that season might exert a similar or even greater effect on average blood pressure levels than currently known genetic markers. Our results also suggest that studies assessing small effects on blood pressure (such as genome-wide association studies) should take into account the effect of season on their analysis.
Lipids
Seasonality was observed for triglycerides, total HDL and LDL cholesterol levels in the Northern Hemisphere. These findings are in agreement with several studies8 ,27 and partly with others29 where seasonality was found in men only. Possible explanations include a higher intake of fat in winter22 and an increased consumption of vegetables and fruits in summer27 although no significant changes in dietary intake have been reported by others.8 Seasonal variations in plasma volume (haemodilution in summer and haemoconcentration in winter) have also been suggested.8
Seasonal variation of lipid levels had already been acknowledged in the European guidelines for management of dyslipidemias 30 and could be of clinical importance in clinical trials or epidemiological studies. For instance, in the PROVE-IT trial, achievement of the LDL-goal was significantly higher in summer than in winter.31 Similarly, epidemiological studies conducted during the cold months might report higher levels of CVRFs than in warm months. Thus, it would be of interest that epidemiological studies be conducted throughout a whole year or, alternatively, that the exact timing of the study be reported.
Glycaemia
Seasonality of glucose levels has been reported among diabetic patients, with a peak in winter and a nadir in summer.32 A similar pattern has been observed for glycosylated haemoglobin among non-diabetic subjects.33 In this study, a slight seasonal variation in glycaemia was observed, and the estimated variation was not modified when the analysis was restricted to studies that collected blood samples in the fasting state (see online supplementary figure S2). Several explanations have been put forward, namely an increase in hyperglycaemic hormones,33 partly compensated by a parallel increase in insulin levels.9 Other possible explanations include changes in insulin sensitivity due to decreased temperatures in winter or increased physical activity in summer.33
Estimated impact on cardiovascular mortality
The seasonal variations in CVRFs led to significant differences in estimated 10-year risk of dying from CV disease according to season. In elderly subjects, this difference ranged between 1.8% and 9.9%. Although the increase in CVRFs in the colder months might not translate into a higher risk of CVD in the future at the individual level, it does have clinical and population consequences. For instance, at the clinical level, a subject screened in the colder months will have a higher calculated 10-year risk of CVD and, thus, a higher likelihood of receiving preventive advice or treatment than in the warmer months. At the population level, the higher risk of future CVD event in colder months could also translate into a higher immediate risk: higher BP levels in the colder months could promote the triggering of CVD, such as stroke or myocardial infarction. Although the calculations were performed mainly for illustrative purposes, they suggest that the seasonal variation of CVRFs could partly explain the seasonality of CVD deaths in most countries.34 ,35 Nevertheless, further studies are needed to better assess this point.
Strengths and weaknesses
To our knowledge, this is the largest and most comprehensive study ever conducted to assess the seasonality of CVRFs. Our results replicate between studies, and also between the Northern and the Southern Hemispheres.
This study has also some weaknesses worth acknowledging. First, only data from two countries of the Southern Hemisphere (Australia and New Zealand) were available. This led to smaller sample sizes, which might have prevented the assessment of seasonal patterns for some CVRFs in the Southern Hemisphere. Indeed, the percentage of the between-month variability explained by the sinusoidal curve was generally lower in the Southern Hemisphere than in the Northern Hemisphere. Nevertheless, only for DBP, HDL cholesterol and glycaemia, the percentage of variance explained by cosinor curve was lower than 70%. Second, the use of the cosinor model might be questionable, and a mixed-effects model might have been appropriate. However, preliminary results showed a similar seasonal pattern in most within-study analyses. Thus, no clear heterogeneity was found between studies, that is, studies with high values of CVRFs did not present a stronger seasonal pattern than studies with lower values. Further, the cosinor model can be described as a linear regression model using sine and cosine functions,36 which has several advantages: it allows us to correctly estimate seasonal variations, and it is more flexible than polynomial regression, such as quadratic or cubic polynomials. Still, in the context of linear regression, the cosinor model provides a straightforward estimation of the seasonal variation, nadir and peak, as well as a measure of the goodness-of-fit. Third, the SCORE equation for low-risk countries was used, and it is likely that using the high-risk equation would have led to bigger seasonal risk differences. Hence, our estimations can be considered as conservative. Finally, seasonality was assessed using one single measurement from each study participant, instead of multiple measurements performed over time in the same persons. However, the results were adjusted for the main confounders and it is unlikely that the same recruiting bias (ie, subjects with low levels of CVRFs being recruited only in summer) would appear in most studies.
Conclusion
Cardiovascular risk factors show a seasonal pattern characterised by higher levels in winter and lower levels in summer. This pattern could contribute to the seasonality of CV mortality.
Key messages
What is known on this subject?
-
Cardiovascular events have been shown to present a seasonal pattern, their rates being higher in winter than in other seasons. Seasonal patterns for cardiovascular risk factors (CVRFs) have also been suggested for Body Mass Index (BMI), waist circumference, blood pressure, lipids and glycaemia.
-
However, most studies assessing the seasonality of CVRFs have been conducted in relatively small studies or focused on a single CVRF.
What might this study add?
-
A seasonal pattern characterised by higher levels in winter and lower levels in summer of CVRF levels was demonstrated in 24 populations of both hemispheres using a common methodology.
-
The magnitude of the seasonal effect is comparable to the pooled effect of genetic markers.
-
The seasonal pattern of CVRFs could explain the seasonality of CV mortality.
How might this impact on clinical practice?
-
Interpretation of individual risk factors levels might be different depending on season: a low value in winter is definitely a low ‘yearly’ value, but a low value in summer does not mean a low value in winter.
References
Supplementary materials
Supplementary Data
This web only file has been produced by the BMJ Publishing Group from an electronic file supplied by the author(s) and has not been edited for content.
Files in this Data Supplement:
- Data supplement 1 - Online supplement
- Data supplement 2 - Online appendix 1
- Data supplement 3 - Online appendix 2
- Data supplement 4 - Online figures
Footnotes
-
The complete list of authors’ emails is provided in online supplementary appendix 1.
-
Contributors HM-S, CG and PM-V wrote the manuscript. HM-S was responsible for analysis and interpretation data. HM-S, SA, LA, MB, VB, EC, GdG, ADC, RE, JF, IG, JI, TJ, YN, MGO, LP, RR, JS, GS, DV, JV, HB, AB, DC, DDB, CD, J-MG, SG, GGG, LI, FK, RK, SM, JM, EP, JBR, RS, LAS, AT, GST, PV and PM-V were involved in acquisition of data. All authors critically revised the manuscript for important intellectual content. PMV supervised the study and is the guarantor.
-
Funding BELSTRESS was supported by grants from the Federal Office for Scientific, Technical, and Cultural Affairs (ST/02/007), the FWO-Vlaanderen, and the National Fund for Scientific Research (FNRS). The Bus Santé study is funded by the Geneva University Hospitals through the General Directorate of Health (Canton of Geneva). Idris Guessous is supported by a grant from the Swiss National Science Foundation (grant #33CM30-124087). The CoLaus/PsyCoLaus study was and is supported by research grants from GlaxoSmithKline, the Faculty of Biology and Medicine of Lausanne, Switzerland and three grants of the Swiss National Science Foundation (grants #3200B0–105993, #3200B0-118308, #33CSCO-122661 and FN 33CSC0-139468). The Copenhagen City Heart Study was mainly supported by the Danish Heart Foundation. The Dubbo Study was supported by the National Health & Medical Research Council of Australia. The Epiporto study was financed by the Fundação para a Ciência e a Tecnologia, Portugal [PTDC/SAU-ESA/108315/2008]. The GAPP study was supported by the Liechtenstein Government, the Swiss Heart Foundation, the Swiss Society of Hypertension, the University of Basel, the University Hospital Basel, the Hanela Foundation, Schiller AG and Novartis, Switzerland. David Conen was supported by a grant of the Swiss National Science Foundation (PP00P3_133681). The HAPIEE Project is supported by research grants from Wellcome Trust (grants #064947/Z/01/Z, # 081081/Z/06/Z), MacArthur Foundation ‘Health and Social Upheaval (a research network)’ and National Institute on Aging (grant #1R01 AG23522). The Health2006 study was financially supported by grants from the Velux Foundation; the Danish Medical Research Council, Danish Agency for Science, Technology and Innovation; the Aase and Ejner Danielsens Foundation; ALK-Abelló A/S (Hørsholm, Denmark), Timber Merchant Vilhelm Bangs Foundation, MEKOS Laboratories (Denmark) and Research Centre for Prevention and Health, the Capital Region of Denmark. The Melbourne Collaborative Cohort Study (MCCS) recruitment and ongoing maintenance is funded by Cancer Council Victoria. It is also supported by the Australian National Health and Medical Research Council (grants #209057, #251533 and #396414). The enrolment phase of the Moli-sani Project was supported by research grants from Pfizer Foundation (Rome, Italy) and the Italian Ministry of University and Research (MIUR, Rome, Italy)–Programma Triennale di Ricerca, Decreto no.1588. MONA LISA was funded by Institut de Veille Sanitaire (InVs), Institut National de la Santé et de la Recherche Médicale (INSERM), Agence Nationale de la Recherche (ANR) and Pfizer. The Osservatorio Epidemiologico Cardiovascolare (OEC) and the Osservatorio Epidemiologico Cardiovascolare/Health Examination Survey (OEC/HES) are part of the CUORE Project of the Istituto Superiore di Sanità, Rome; both surveys were supported partly from the Italian Ministry of Health, grants of the Centre of Disease Control, and partly from the Italian Association of Hospital Cardiologists (ANMCO). The PRIME study was supported by grants from the Institut National de la Santé et de la Recherche Médicale (INSERM) and the Merck, Sharpe and Dohme-Chibret Laboratory. The Belfast PRIME Study was funded by the ‘HSC Research and Development Office for Northern Ireland’. REGICOR Funding: Spanish Health Research Fund [FIS 94/0539, FIS PI020471]; Agency for Management of University and Research Grants [2005SGR00577], and Spain's Ministry of Science and Innovation through the Carlos III Health Institute & European Regional Development Funds (ERDF) [HERACLES Program RD12/0042]. The Workforce Diabetes Survey was supported by research grants from the Health Research Council of New Zealand.
-
Competing interests None.
-
Patient consent Obtained.
-
Ethics approval All studies were approved by the local or national ethics committees.
-
Provenance and peer review Not commissioned; externally peer reviewed.
-
Data sharing statement The dataset is available from the corresponding author at Pedro-Manuel.Marques-Vidal@chuv.ch.