Article Text

Abstract
Echocardiography is useful for risk stratification and assessment of prognosis after myocardial infarction, which is the focus of this review. Various traditional echocardiographic parameters have been shown to provide prognostic information, such as left ventricular volumes and ejection fraction, wall motion score index, mitral regurgitation and left atrial volume. The introduction of tissue Doppler imaging and speckle-tracking strain imaging has resulted in additional prognostic parameters, such as left ventricular strain (rate) and dyssynchrony. Also, (myocardial) contrast echocardiography provides valuable information, particularly about myocardial perfusion (as a marker of myocardial viability), which is strongly related to prognosis after myocardial infarction. Stress echocardiography provides information on ischaemia and viability, coronary flow reserve can be obtained by Doppler imaging of the coronary arteries, and finally, three-dimensional echocardiography provides optimal information on left ventricular volumes, function and sphericity, which are also important for long-term outcome.
Statistics from Altmetric.com
At present, two-dimensional (2D) echocardiography is a frequently used imaging modality in the management of patients with acute myocardial infarction (MI). It is a low-cost and safe modality, which can be easily applied at the bedside and is valuable for patient follow-up. Important benefit of echocardiography has been demonstrated in establishing the diagnosis, location and extent of MI, and in detection of mechanical complications after MI. In particular, echocardiography is useful for assessment of prognosis and risk stratification.
The main focus of this review is the value of transthoracic 2D echocardiography for prognosis after acute MI. A variety of prognostic parameters can be derived from routine and more sophisticated echocardiographic approaches, including tissue Doppler imaging (TDI) and speckle-tracking strain imaging (box 1). The use of contrast echocardiography for prognosis is also discussed extensively, followed by a brief discussion on the prognostic value of other echocardiographic techniques.
Box 1 Echocardiographic parameters related to prognosis after myocardial infarction
Traditional parameters
Left ventricular (LV) volumes
Left ventricular ejection fraction (LVEF)
Mitral regurgitation
Wall motion score index
Diastolic function
Left atrial volume
Right ventricular function
Novel parameters
Strain
Strain rate
LV dyssynchrony
Intravenous contrast
Endocardial border detection
Thrombus detection
Assessment of perfusion/viability
Stress echocardiography
Ischaemia
Contractile reserve
Coronary artery flow
Coronary flow reserve
Three-dimensional echocardiography
LV volumes, LVEF and sphericity indices
Traditional prognostic parameters
Left ventricular volumes and ejection fraction
Traditionally, left ventricular (LV) function has been described as an important predictor of outcome after acute MI. The prognostic importance of LV ejection fraction (LVEF) after MI, mostly assessed with contrast ventriculography, has been demonstrated in several large studies.1 In addition, the value of LVEF quantified by echocardiography for prognosis after MI was confirmed. Moller et al examined a group of 767 patients with acute MI and demonstrated that echocardiographically determined LVEF at 1 day after admission for acute MI was a powerful predictor of all-cause mortality during a median follow-up of 19 months.2
Although LVEF has commonly been used to describe LV function, the prognostic value of LVEF after MI has been questioned. Low LVEF may, on the one hand, be the result of reduced contractile function due to extensive myocardial damage or continuing ischaemia or, on the other, a result of LV dilatation caused by infarct expansion and stretching of the myocardial scar. Furthermore, assessment of LVEF early after MI can be misleading owing to the presence of myocardial stunning. It has been advocated that LV end-systolic volume (LVESV) or LV end-diastolic volume (LVEDV) may be more meaningful predictors of prognosis than LVEF. In a group of 605 patients with acute MI, White et al demonstrated that LVESV was the primary predictor of survival after MI (fig 1).3 It was observed that LVESV was superior to LVEF in patients with depressed LVEF (<50%) or small LVESV (<100 ml).

Relationship between LVESV and relative risk of cardiac death during follow-up. A significant relation is demonstrated between LVESV and cardiac death during follow-up after acute myocardial infarction. The fine lines indicate the 95% confidence limits of the relative risk. LVESV, left ventricular end-systolic volume; SD, standard deviation. Reprinted from White et al3 with permission.
Wall motion score index
It has been advocated that optimal assessment of LV function in patients after MI is performed by evaluating the segmental function of the left ventricle rather than evaluation of global LV function. A practical approach is to divide the ventricle into a number of segments and to evaluate wall motion in each segment. A regional score index, the wall motion score index (WMSI), can be derived and provides powerful prognostic information. After MI extensive regional wall motion abnormalities may be present but when compensated by regional hyperkinesis of the normal segments, LVEF will be (almost) normal; in these patients, WMSI could more correctly reflect the magnitude of myocardial damage.4
The prognostic value of WMSI after acute MI has been described in a few, relatively small studies. Galasko et al studied 120 consecutive patients with acute MI treated with thrombolysis.5 The authors demonstrated that WMSI independently predicted cardiac events during a mean follow-up of 13 months. Compared with LVEF, echocardiographic WMSI was described as a cheaper and more readily available technique, which is more discriminatory in cases of mild LV dysfunction following acute MI. In a study performed by Carluccio et al, 144 patients with a first acute MI treated with thrombolytic therapy were followed-up for a mean period of 18 months.6 Patients with cardiac events during follow-up had a higher WMSI at predischarge than patients without events. During multivariate analysis, a WMSI >1.50 was the most powerful predictor of a subsequent event (χ2 = 17.8, p<0.0001). Furthermore, Moller et al demonstrated in a larger population of patients with acute MI that WMSI was an independent predictor of death (hazard ratio 1.15 per 0.2 unit increase).2 In addition, WMSI also proved to be an independent predictor of hospitalisation for heart failure (hazard ratio 1.21 per 0.2 unit increase). In the same study, LVEF was shown to be a powerful predictor of all-cause mortality after MI, but did not provide incremental prognostic information over WMSI. Furthermore, LVEF was not predictive of hospitalisation for heart failure.
Mitral regurgitation
The presence of mitral regurgitation after acute MI is often asymptomatic, and systematic evaluation using echocardiography should be performed in patients after an MI. Standard colour Doppler imaging is a highly sensitive method to detect even mild degrees of mitral regurgitation. Furthermore, echocardiography permits accurate quantification of the severity of mitral regurgitation by measuring the effective regurgitant orifice area and the regurgitant volume using a Doppler technique.7
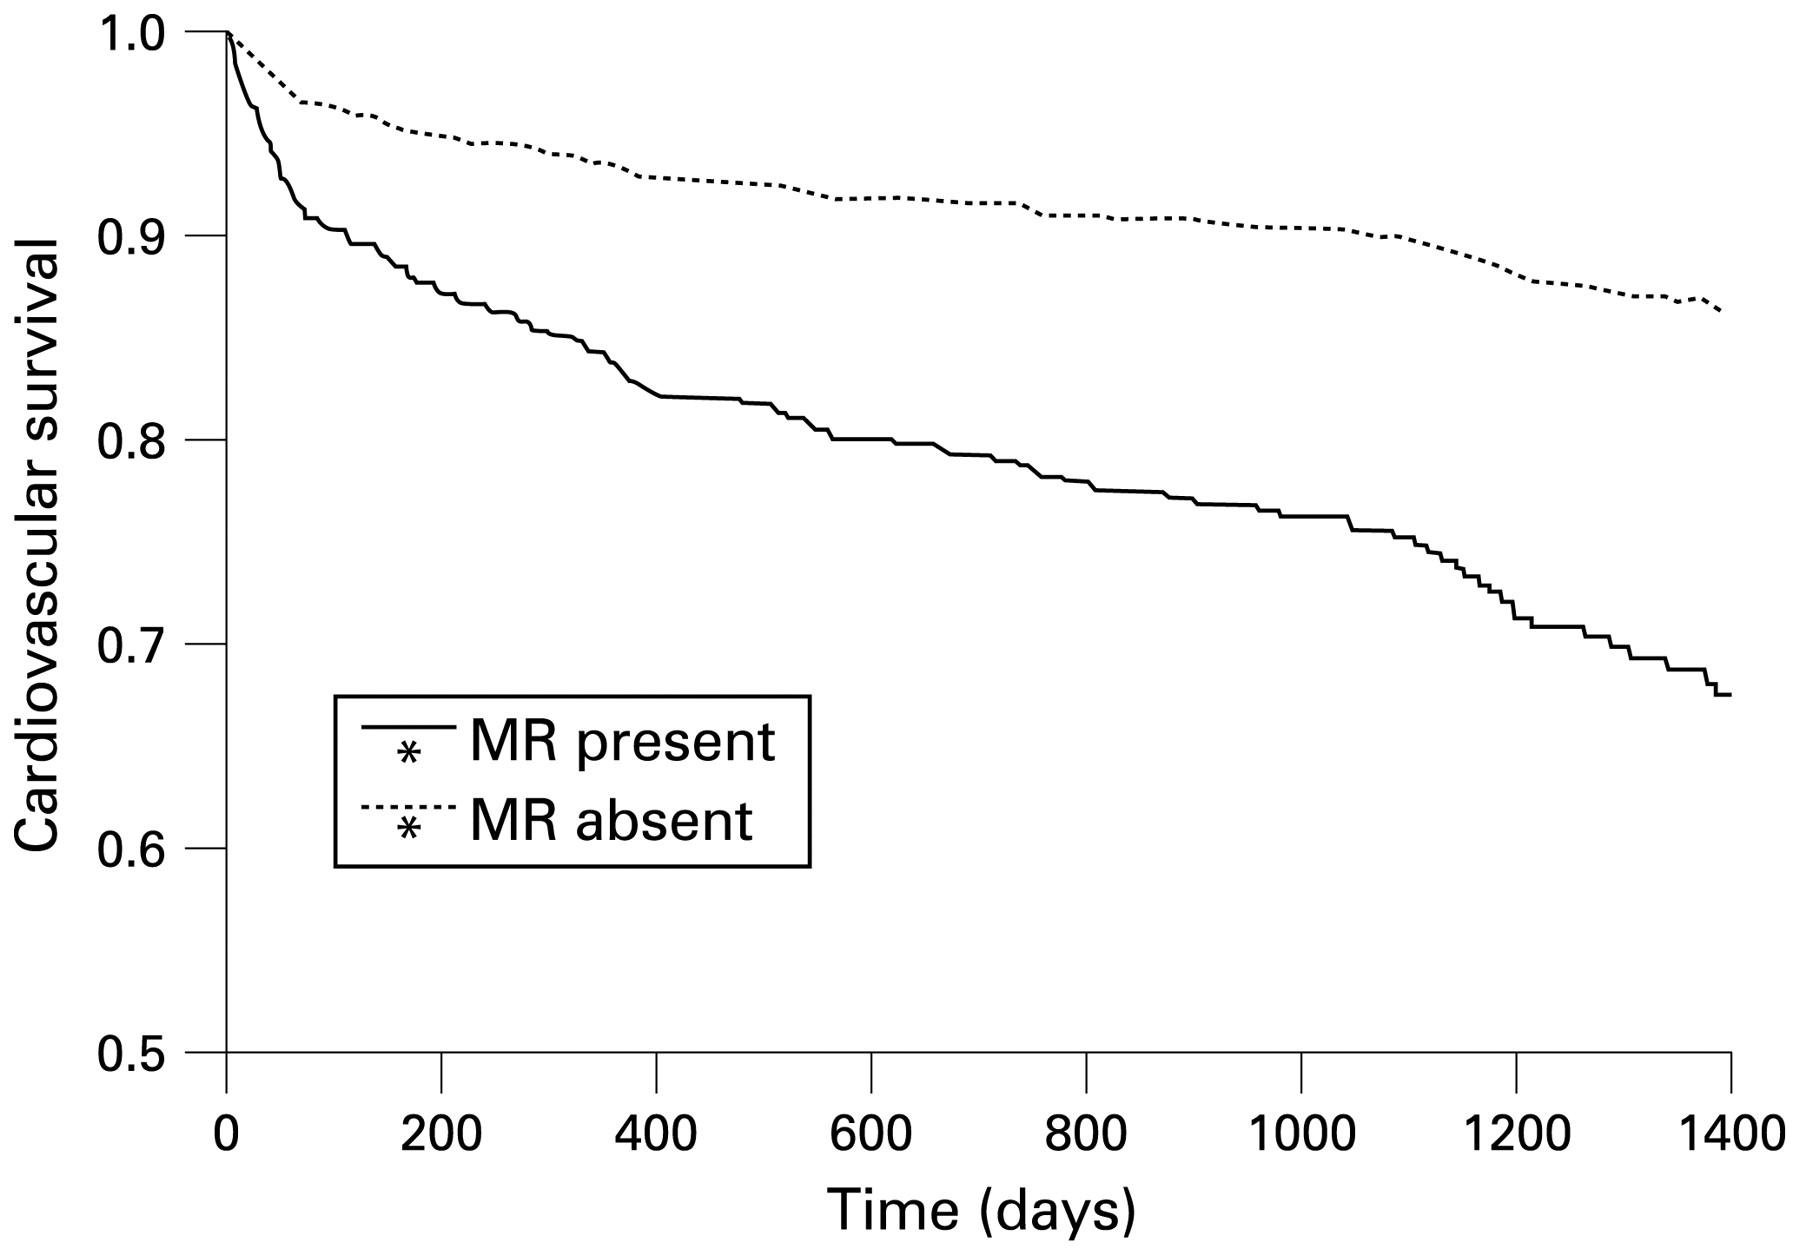
The incidence of acute mitral regurgitation is high among patients with acute MI and is an independent predictor of late cardiovascular and all-cause mortality. Lehmann et al studied 206 patients within 7 h after a first MI using contrast left ventriculography and demonstrated the presence of mitral regurgitation in 13% of patients.8 In a substudy from the Survival And Ventricular Enlargement (SAVE) investigators, Lamas et al studied a cohort of 727 patients who underwent left ventriculography up to 16 days after MI. Mitral regurgitation was present in 141 patients (19%). The presence of mitral regurgitation was related to the risk of occurrence of a cardiovascular event during 3.5 years of follow-up. Patients with mitral regurgitation had a higher cardiovascular mortality (29% vs 12%, p = 0.002; fig 2) and a higher prevalence of severe heart failure (24% vs 16%, p<0.05) than patients without mitral regurgitation. The presence of mitral regurgitation was shown to be an independent predictor of cardiovascular mortality with a relative risk of 2.00.9 In addition, Feinberg et al described the value of echocardiography for assessment of mitral regurgitation and demonstrated mild mitral regurgitation in 29% and moderate–severe mitral regurgitation in 6% of 417 patients with acute MI using colour Doppler echocardiography within 48 h of admission.10 Both mild mitral regurgitation and moderate–severe mitral regurgitation were independently associated with increased 1-year mortality with hazard ratios of 2.31 and 2.85, respectively. The prognostic value of mitral regurgitation assessed by echocardiography was further confirmed by Perez de Isla et al, who studied 300 consecutive patients admitted for non-ST-segment elevation MI (NSTEMI). During echocardiography in the first week after MI, mitral regurgitation was detected in 42%. Only mitral regurgitation was an independent predictor of long-term outcome during a mean follow-up of approximately 14 months.11

Kaplan–Meier curves of cardiovascular survival in patients with and without mitral regurgitation. After acute myocardial infarction, cardiovascular survival was significantly better in patients without mitral regurgitation (p = 0.0022). MR, mitral regurgitation. Reprinted from Lamas et al9 with permission.
Diastolic function
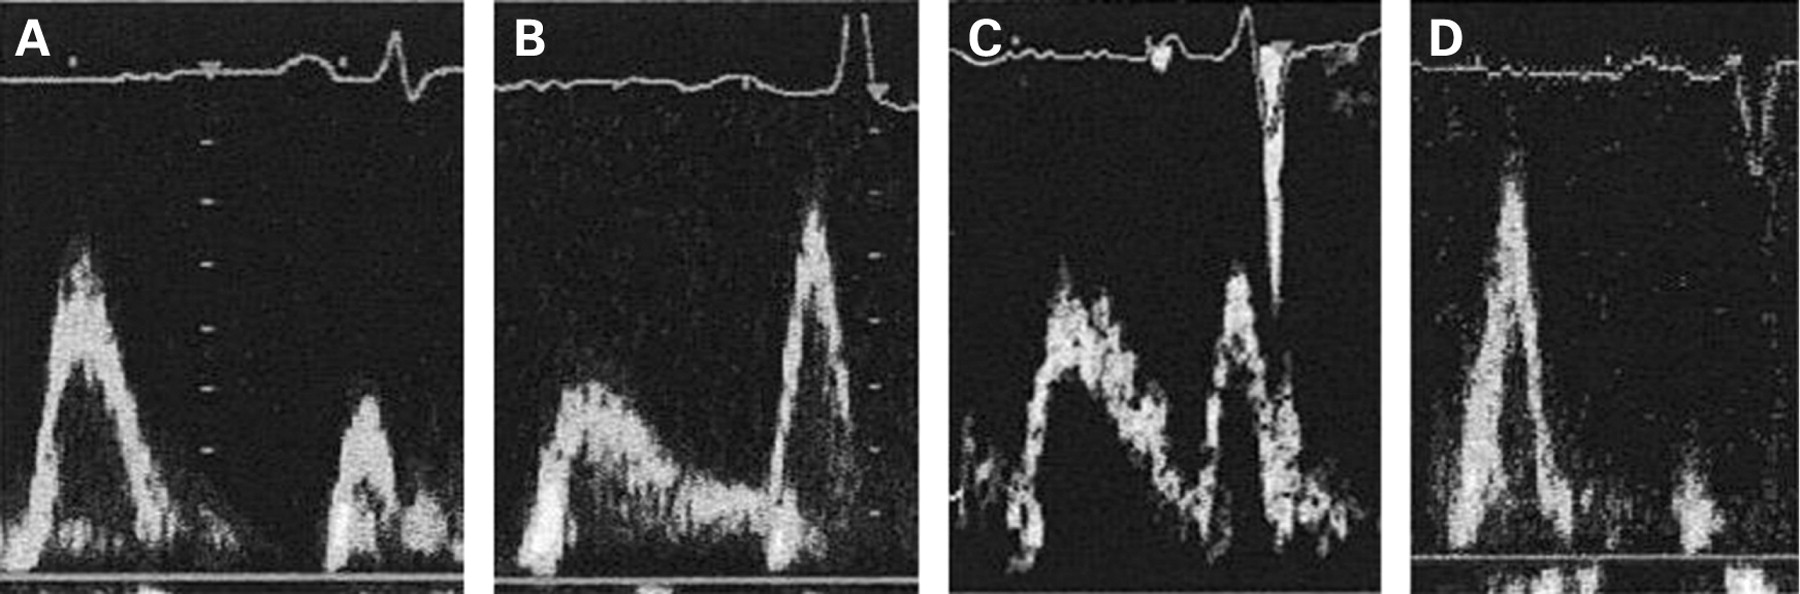
Since the availability of Doppler echocardiography, reliable measures of diastolic function in patients with acute MI can be obtained. Determination of the LV filling pattern provides important information about LV diastolic function in this patient group (fig 3).12 13 Specifically, a restrictive filling pattern was shown to be a powerful independent predictor of late LV dilatation and cardiovascular mortality in patients with acute MI.14 In a study by Nijland et al, a short deceleration time of the early filling wave (E wave) was described as the best predictor of cardiac death in hospital survivors after acute MI.15 A 1-year survival rate of 100% was seen in the patients without a restrictive filling pattern (peak velocity of early diastolic filling wave (E)/peak velocity of late filling wave (A) ratio ⩽1 or between 1 and 2 with a deceleration time >140 ms) as compared with only 50% in the restrictive group (E/A ratio ⩾2 or between 1 and 2 and deceleration time ⩽140 ms). Moreover, 3-year survival rates were 100% and 22%, respectively.

Pulsed-wave Doppler recordings of transmitral left ventricular filling. Diastolic (dys)function can be categorised using the ratio of the peak velocities of early (E wave) and late (A wave) diastolic filling (the E/A ratio), and the deceleration time of the E wave. Examples of the different grades of diastolic dysfunction, as assessed by pulsed-wave Doppler echocardiography, are shown. (A) Normal inflow pattern (E>A, normal deceleration time of E wave); (B) impaired relaxation (E<A, prolonged deceleration time of E wave); (C) pseudonormal filling pattern (E = A, normal deceleration time of E wave); ( D) restrictive filling pattern (E>>A, shortened deceleration time of E wave). Reprinted from Moller et al12 with permission.
In addition to this higher mortality, patients with a restrictive filling pattern have a higher risk for development of heart failure after MI. During a 1-year follow-up, Poulsen et al reported an incidence of heart failure during hospitalisation of 71%, with a hospital readmission rate for heart failure of 21% in patients with a restrictive LV filling pattern after MI.16 Conversely, no patient with normal LV filling at baseline had heart failure during hospitalisation or follow-up. In addition, Cerisano et al studied 104 patients and obtained echocardiograms 3 days after acute MI.17 Survival rate at a mean follow-up of 32 months was 79% in patients with a restrictive filling pattern (deceleration time ⩽130 ms) versus 97% in patients without a restrictive filling pattern (deceleration time >130 ms; p = 0.003). Multivariate analysis showed that, besides age, restrictive filling was an independent predictor of event-free survival.
In a recent meta-analysis of 12 prospective studies (including 3396 patients), the presence of a restrictive filling pattern after acute MI was an important independent predictor of mortality regardless of LVEF, LVESV and Killip heart failure class.18
Left atrial volume
Doppler variables reflecting diastolic function are influenced by several factors (importantly loading conditions) and may change rapidly after MI. In contrast, left atrial (LA) volume is less influenced by acute changes and reflects subacute or chronic diastolic function. The prognostic value of LA size and volume after MI has been examined in several studies. Moller et al assessed LA volume during admission for acute MI in 314 patients and corrected for body surface area (LA volume index).19 During a mean follow-up period of 15 months, 46 patients (15%) died. LA volume index was a powerful and independent predictor of mortality (hazard ratio 1.05 per 1 ml/m2 change). The importance of LA volume for clinical outcome after MI was confirmed by Beinart et al.20 In 395 consecutive patients with acute MI, the authors demonstrated that LA volume index, determined within the first 48 h of admission, was an independent predictor of 5-year mortality with incremental prognostic information over clinical and echocardiographic data (fig 4). Patients with LA volume index >32 ml/m2 had a significantly higher mortality than patients with LA volume index ⩽32 ml/m2 (34.5% vs 14.2%, respectively).
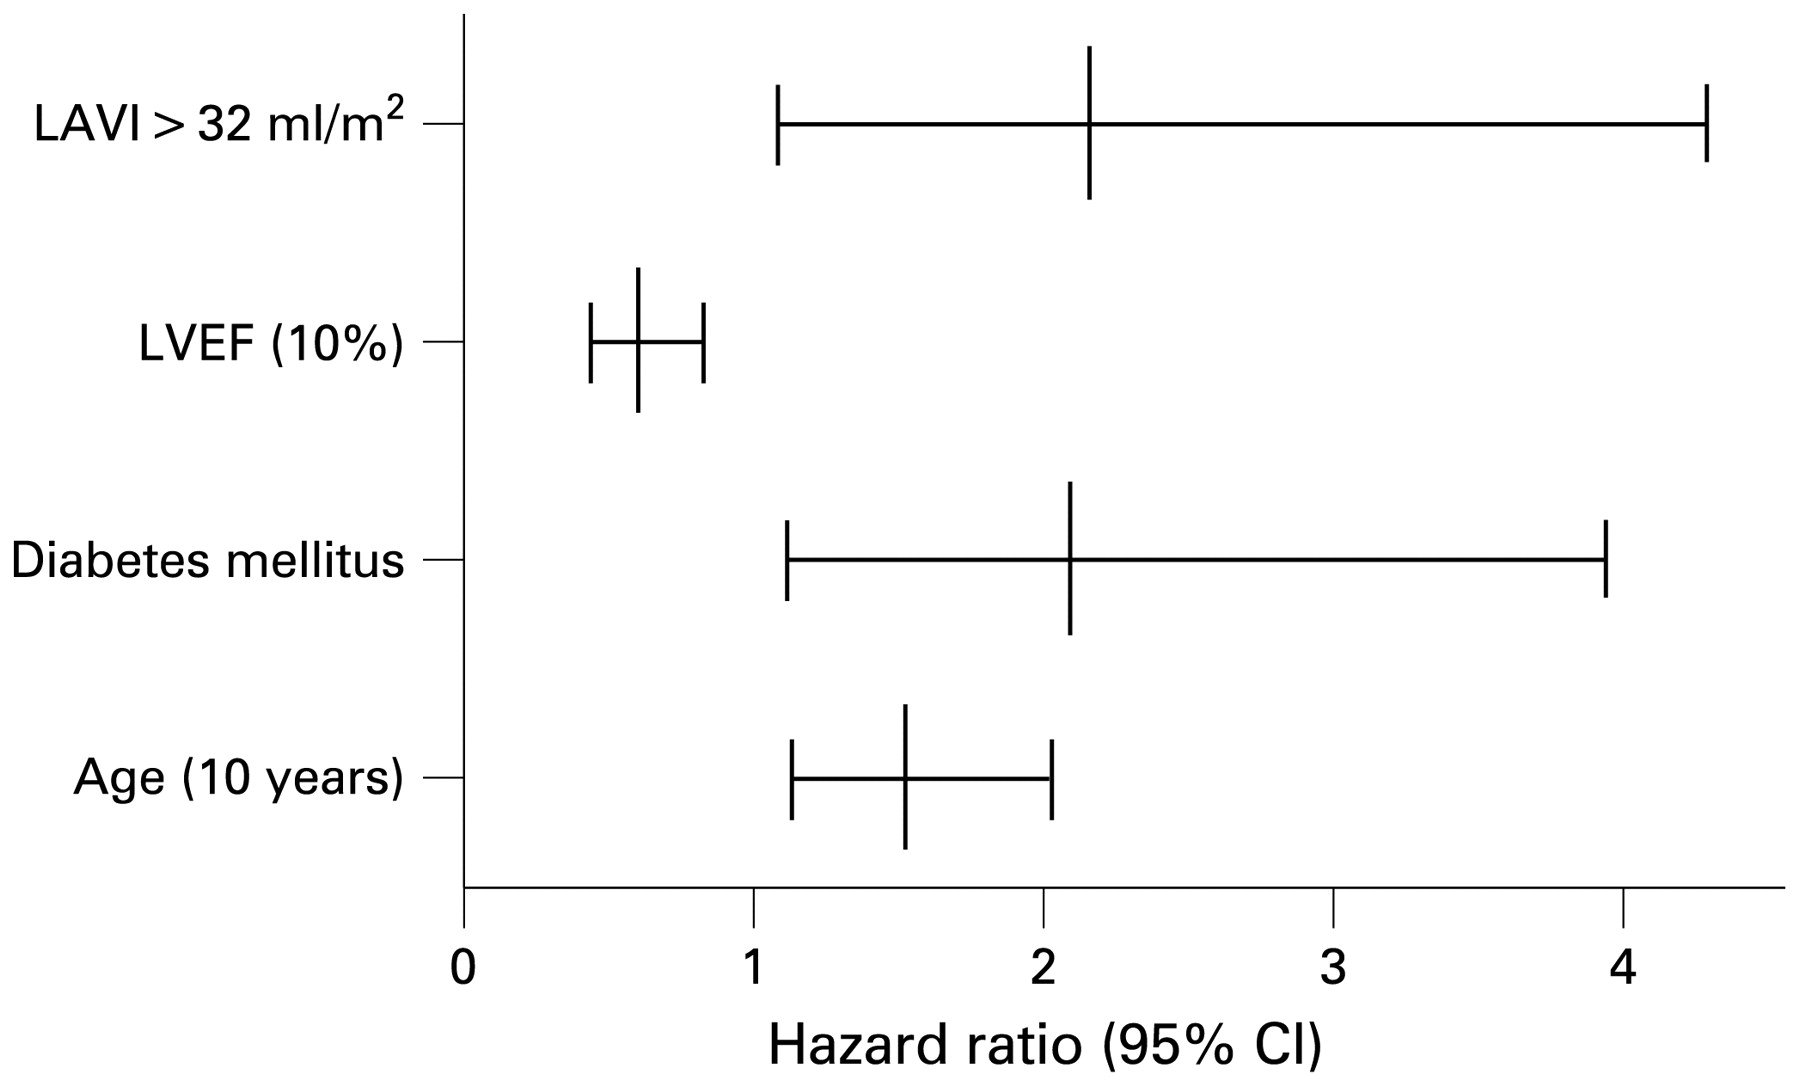
Overview of the independent predictors for 5-year mortality of patients with first MI (hazard ratio (95% confidence interval)). Besides the presence of diabetes, age and LVEF, LAVI is an independent predictor of mortality after acute MI. LAVI, left atrial volume index; LVEF, left ventricular ejection fraction; MI, myocardial infarction. Reprinted from Beinart et al20 with permission.
Right ventricular function
It is clear that the extent of LV dysfunction is associated with an adverse prognosis in survivors of acute MI. In contrast, the significance of right ventricular (RV) dysfunction after MI is less clear and data are scarce. In the SAVE echocardiographic substudy, Zornoff et al analysed 2D echocardiograms from 416 patients with LV dysfunction (LVEF ⩽40%) at a mean of 11 days after MI and related RV function to clinical outcome.21 On multivariate analysis, the percentage of change in RV cavity area from end diastole to end systole (the fractional area change) on the apical four-chamber view was an independent predictor of total mortality, cardiovascular mortality and heart failure.
In contrast, Gadsboll et al failed to show a relationship between RV function and 1-year mortality in 423 patients after acute MI, but many of the patients had normal LV function.22 Furthermore, in the Thrombolysis In Myocardial Infarction (TIMI)-II trial, in which all patients received reperfusion (n = 1110), RV wall abnormalities were seen in only 5% of patients after MI and were not associated with increased mortality during 1-year follow-up after hospital discharge.23 However, this population comprised only patients with an inferior MI. Obviously, more data on the precise value of RV dysfunction after MI are needed.
Novel prognostic parameters
More recently, the prognostic value of LV strain (reflecting tissue deformation) and strain rate (tissue deformation per time period) after MI have been evaluated. Strain and strain rate can be quantified using TDI or with the more recently introduced technique of speckle-tracking imaging. The TDI based measurements of strain and strain rate are relatively simple to perform. The technique of speckle-tracking imaging makes use of natural acoustic markers, or speckles, that are present on standard ultrasound tissue images. This novel technique can discriminate between active and passive myocardial contraction and is angle-independent as it does not use the Doppler technique (fig 5).24 25 Speckle-tracking imaging has recently been validated using microcrystals and magnetic resonance imaging (MRI).26 27 28

Bull’s-eye plot providing peak systolic longitudinal strain for all 17 LV segments of a patient with an acute MI (after 48 h). LV segments with normal strain are presented in dark grey and those segments with decreased strain are light coloured. In this patient, the left anterior descending coronary artery was the infarct-related artery. Decreased peak systolic longitudinal strain is observed in the anteroseptal LV segments (light grey) consistent with the region of infarction. In addition, global peak systolic longitudinal strain (GLPSS_Avg) was severely reduced (normal values range from −20.3% to −24.1%).24 25 LV, left ventricular; MI, myocardial infarction.
After MI, the extent of transmurality of infarcted tissue is a determinant of functional recovery of myocardium and contains prognostic importance. Traditionally, sophisticated imaging modalities such as delayed-enhancement MRI are used for assessment of the extent of transmurality. However, Vartdal et al demonstrated that strain can be a valuable predictor of the transmural extent of MI as well and may therefore be an important clinical tool for risk stratification in the acute phase of MI.29 The authors studied 30 patients with acute anterior MI who underwent longitudinal strain assessment with TDI at 1.5 h after revascularisation. After a 9-month follow-up period, MRI was performed to assess the precise extent of myocardial scar formation in 16 corresponding myocardial segments. To obtain a global LV strain value, the 16 segmental strain values were averaged. A good correlation was found between global strain and total infarct size (r = 0.77; fig 6). Multivariate analysis demonstrated that global peak LV strain was independently related to infarct size measured by MRI. Furthermore, a clear inverse relation was found between segmental strain and the transmural extent of scar tissue in individual segments (r = 0.67).

Relation between global strain (assessed by echocardiography) and infarct size (assessed with MRI). Infarct size assessed with MRI is inversely related to global strain assessed with echocardiography. MRI, magnetic resonance imaging. Reprinted from Vartdal et al29 with permission.
In another study, Zhang et al studied 47 patients with a first acute MI and 60 healthy controls.30 Within a few days after MI, all subjects underwent TDI with quantification of strain rate and contrast-enhanced MRI to determine the extent and transmurality of scar tissue. Peak systolic strain rate of the transmurally infarcted segments was significantly lower than with normal myocardium or with non-transmurally infarcted segments (fig 7). A cut-off value of peak systolic strain rate of −0.59/s detected transmural scar tissue with high sensitivity (90.9%) and specificity (96.4%), and peak systolic strain rate between −0.98/s and −1.26/s distinguished subendocardial scar tissue from normal myocardium with a sensitivity of 81.3% and a specificity of 83.3%. Accordingly, the authors concluded that peak myocardial deformation assessed by strain rate imaging can differentiate between transmural and non-transmural MI, and it permits non-invasive determination of transmurality of scar tissue after MI (reflecting the extent of non-viable myocardium).
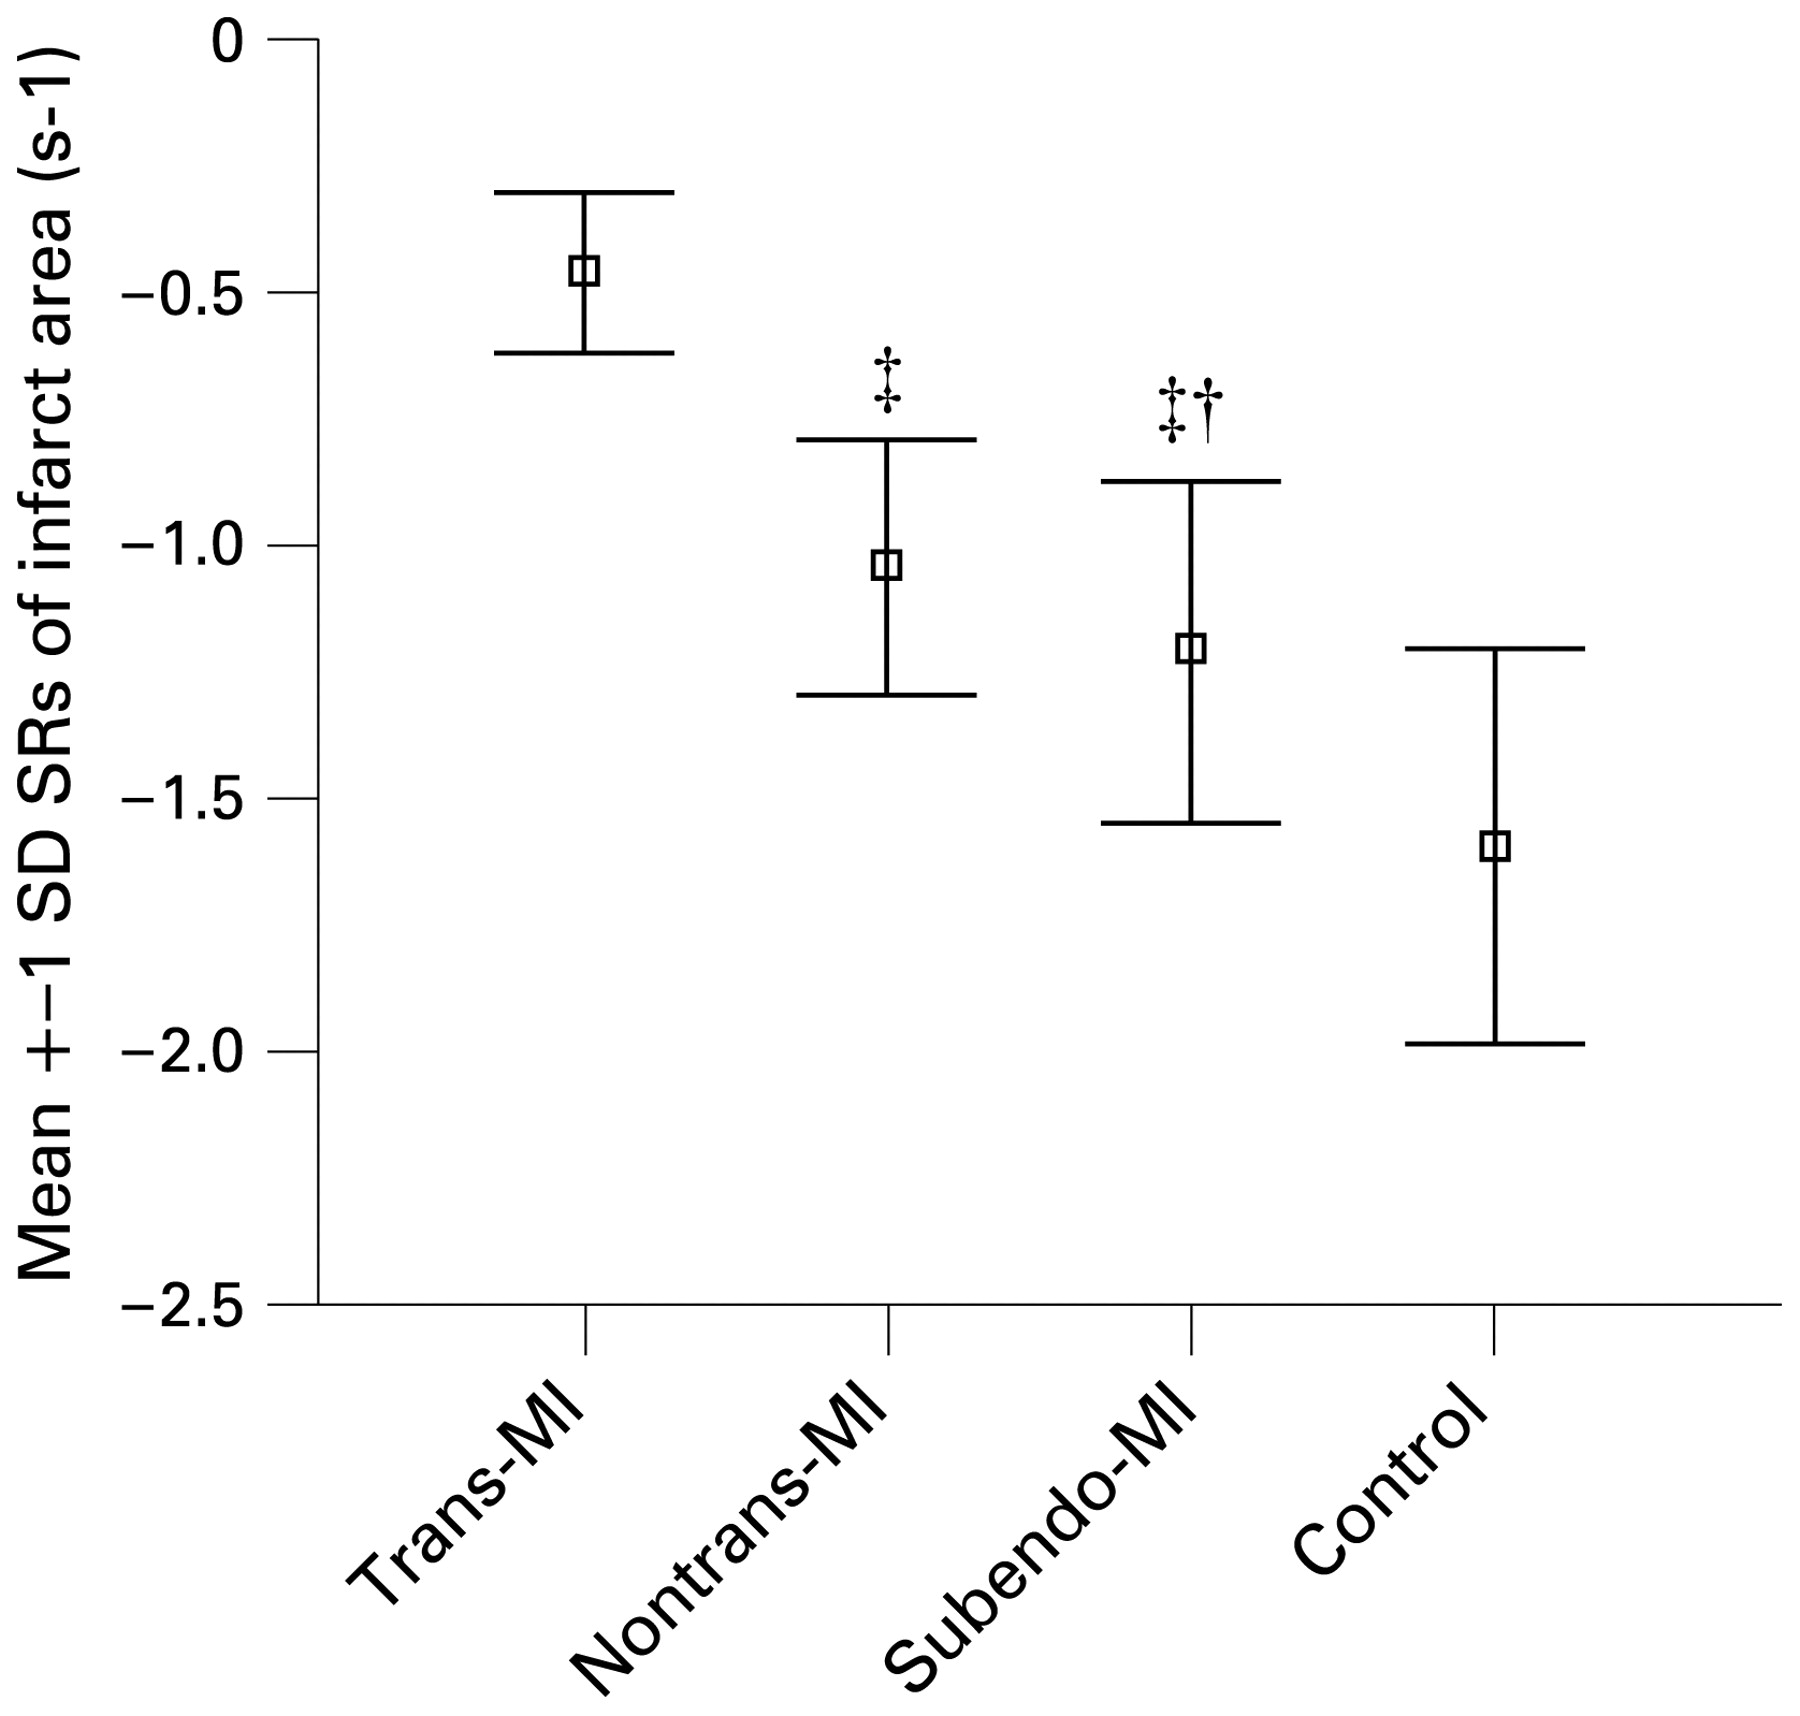
Mean peak systolic strain rate (SRs) in different infarcted segments. A relation was demonstrated between strain rate and the extent of MI. The lowest strain rate values were seen in patients with transmural MI. MI, myocardial infarction; trans-MI, transmural MI; subendo-MI; subendocardial MI. Reprinted from Zhang et al30 with permission.
Where the traditional prognostic parameters have been shown to be directly related to survival, strain and strain rate have mostly been associated with only surrogates of clinical outcome. However, Park et al studied 50 patients with acute anterior MI and primary reperfusion (percutaneous coronary intervention (PCI) in 44 patients and thrombolysis in six patients) and assessed longitudinal strain by both TDI and speckle-tracking imaging in seven LV segments related to the vascular territory of the left anterior descending coronary artery territory.31 A total of 22 patients showed LV remodelling (LV dilatation with an increase in LVEDV ⩾15% during follow-up); these patients had significantly lower baseline longitudinal strain, assessed by the two echocardiographic techniques. Both strain assessed by TDI and assessed by speckle-tracking imaging were independent predictors of LV remodelling (odds ratio 1.430 and 1.307, respectively) during 18 months’ follow-up. Importantly, in this relatively small study, both strain parameters were independently predictive of death or development of congestive heart failure during follow-up (odds ratio 1.436 and 1.455, respectively). Furthermore, Hung et al recently demonstrated in a group of more than 600 patients from the Valsartan In Acute Myocardial Infarction (VALIANT) trial that both strain and strain rate (by speckle-tracking imaging) were independent predictors for death. In particular, strain rate imaging provided incremental prognostic information beyond LVEF after acute MI.32
Left ventricular dyssynchrony
The clinical importance of LV remodelling—that is, an increase in LV volumes with a decrease in LVEF, after MI has already been emphasised by White et al.3 Patients who died during follow-up after MI had significantly larger LV volumes and lower LVEF than survivors. Furthermore, the authors identified LVESV as the primary predictor of survival after MI. Therefore, early identification of patients who will experience LV remodelling late after acute MI is important for risk stratification and optimisation of (medical) treatment.
Mollema et al recently studied 124 patients presenting with acute MI who underwent primary PCI. Within 48 h of intervention, 2D echocardiography was performed and LV dyssynchrony was quantified using colour-coded TDI. The authors observed that the presence of LV dyssynchrony at baseline (⩾65 ms) was strongly related (r = 0.73) to the extent of LV dilatation at 6 months of follow-up.33 In a subsequent study, the same authors introduced LV dyssynchrony, as assessed by speckle-tracking radial strain analysis, as an early predictor of LV remodelling (increase in LVESV ⩾15%) at 6-months’ follow-up after acute MI (fig 8).34 A total of 178 consecutive patients presenting with acute MI who underwent primary PCI were included. Within 48 h of intervention, 2D echocardiography was performed and LV dyssynchrony was quantified. Patients showing LV remodelling at 6-months’ follow-up (20%) had comparable baseline characteristics to those of patients without LV remodelling (80%), except for higher peak troponin T levels, peak creatine phosphokinase levels, WMSI, mitral inflow peak early velocity (E)/mitral annular peak early velocity (E’), or E/E’ ratio, and a greater extent of LV dyssynchrony. Multivariable analysis demonstrated that LV dyssynchrony was independently predictive for LV remodelling. Receiver operating characteristic curve analysis demonstrated that a cut-off value of 130 ms for LV dyssynchrony yields a sensitivity of 82% and a specificity of 95% to predict LV remodelling at 6-months’ follow-up (fig 9). Despite the lack of a survival analysis, the importance of LV dyssynchrony >130 ms within 48 h after admission for clinical outcome (LV remodelling) after acute MI was emphasised.
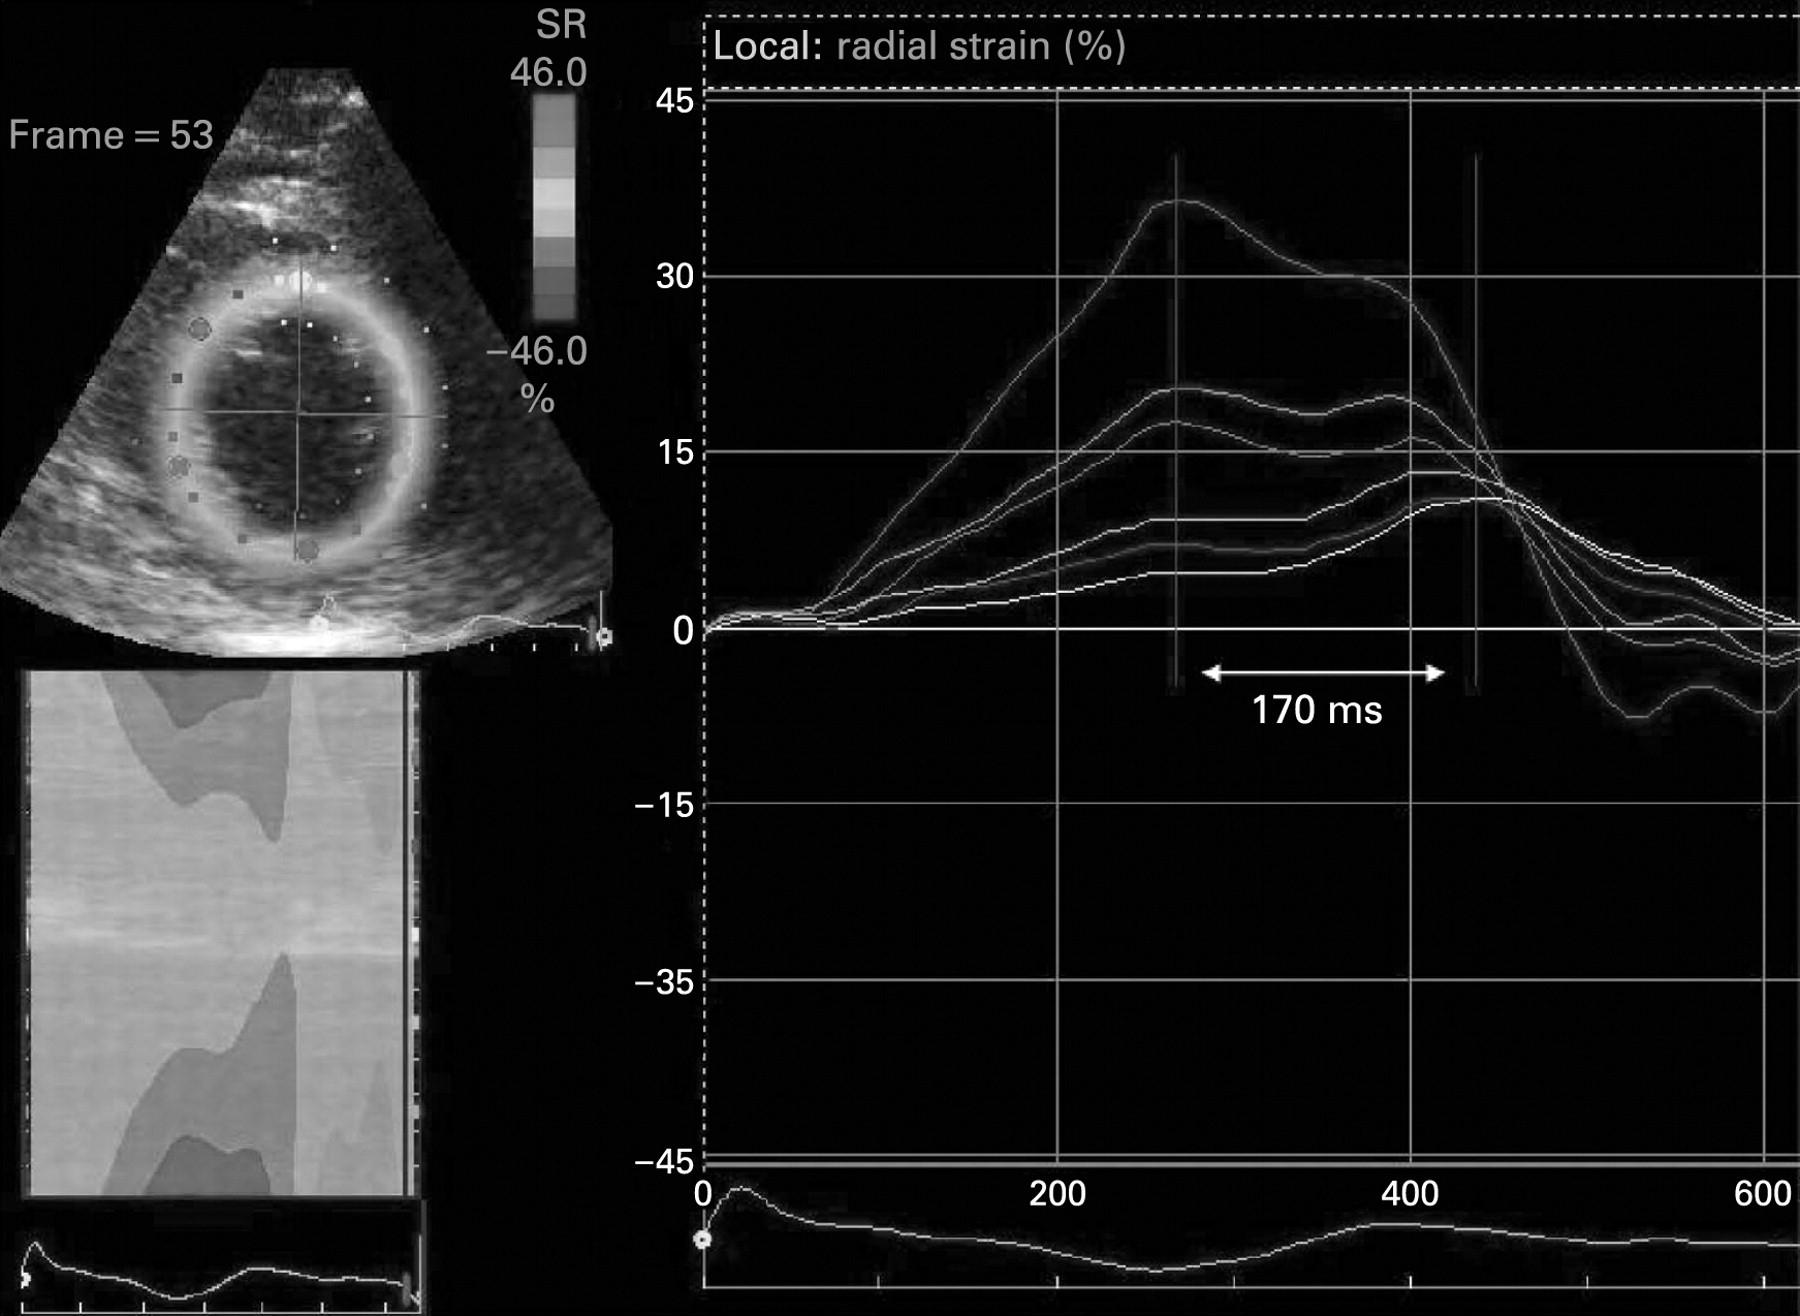
Time–radial strain curves of a patient at 2 days after acute MI with the left anterior descending coronary artery as the infarct-related artery. On the x axis the time is provided. The y axis provides the extent of radial strain for the individual segments. Most decreased radial strain was seen in the anteroseptal LV segments. In addition, substantial LV dyssynchrony was demonstrated with the anteroseptal segments as the latest activated segments. LV dyssynchrony was defined as the time difference between the first segments and last segments that reach peak radial strain. In this example, the extent of LV dyssynchrony was 170 ms for the earliest versus the latest activated segments. LV, left ventricular; MI, myocardial infarction.
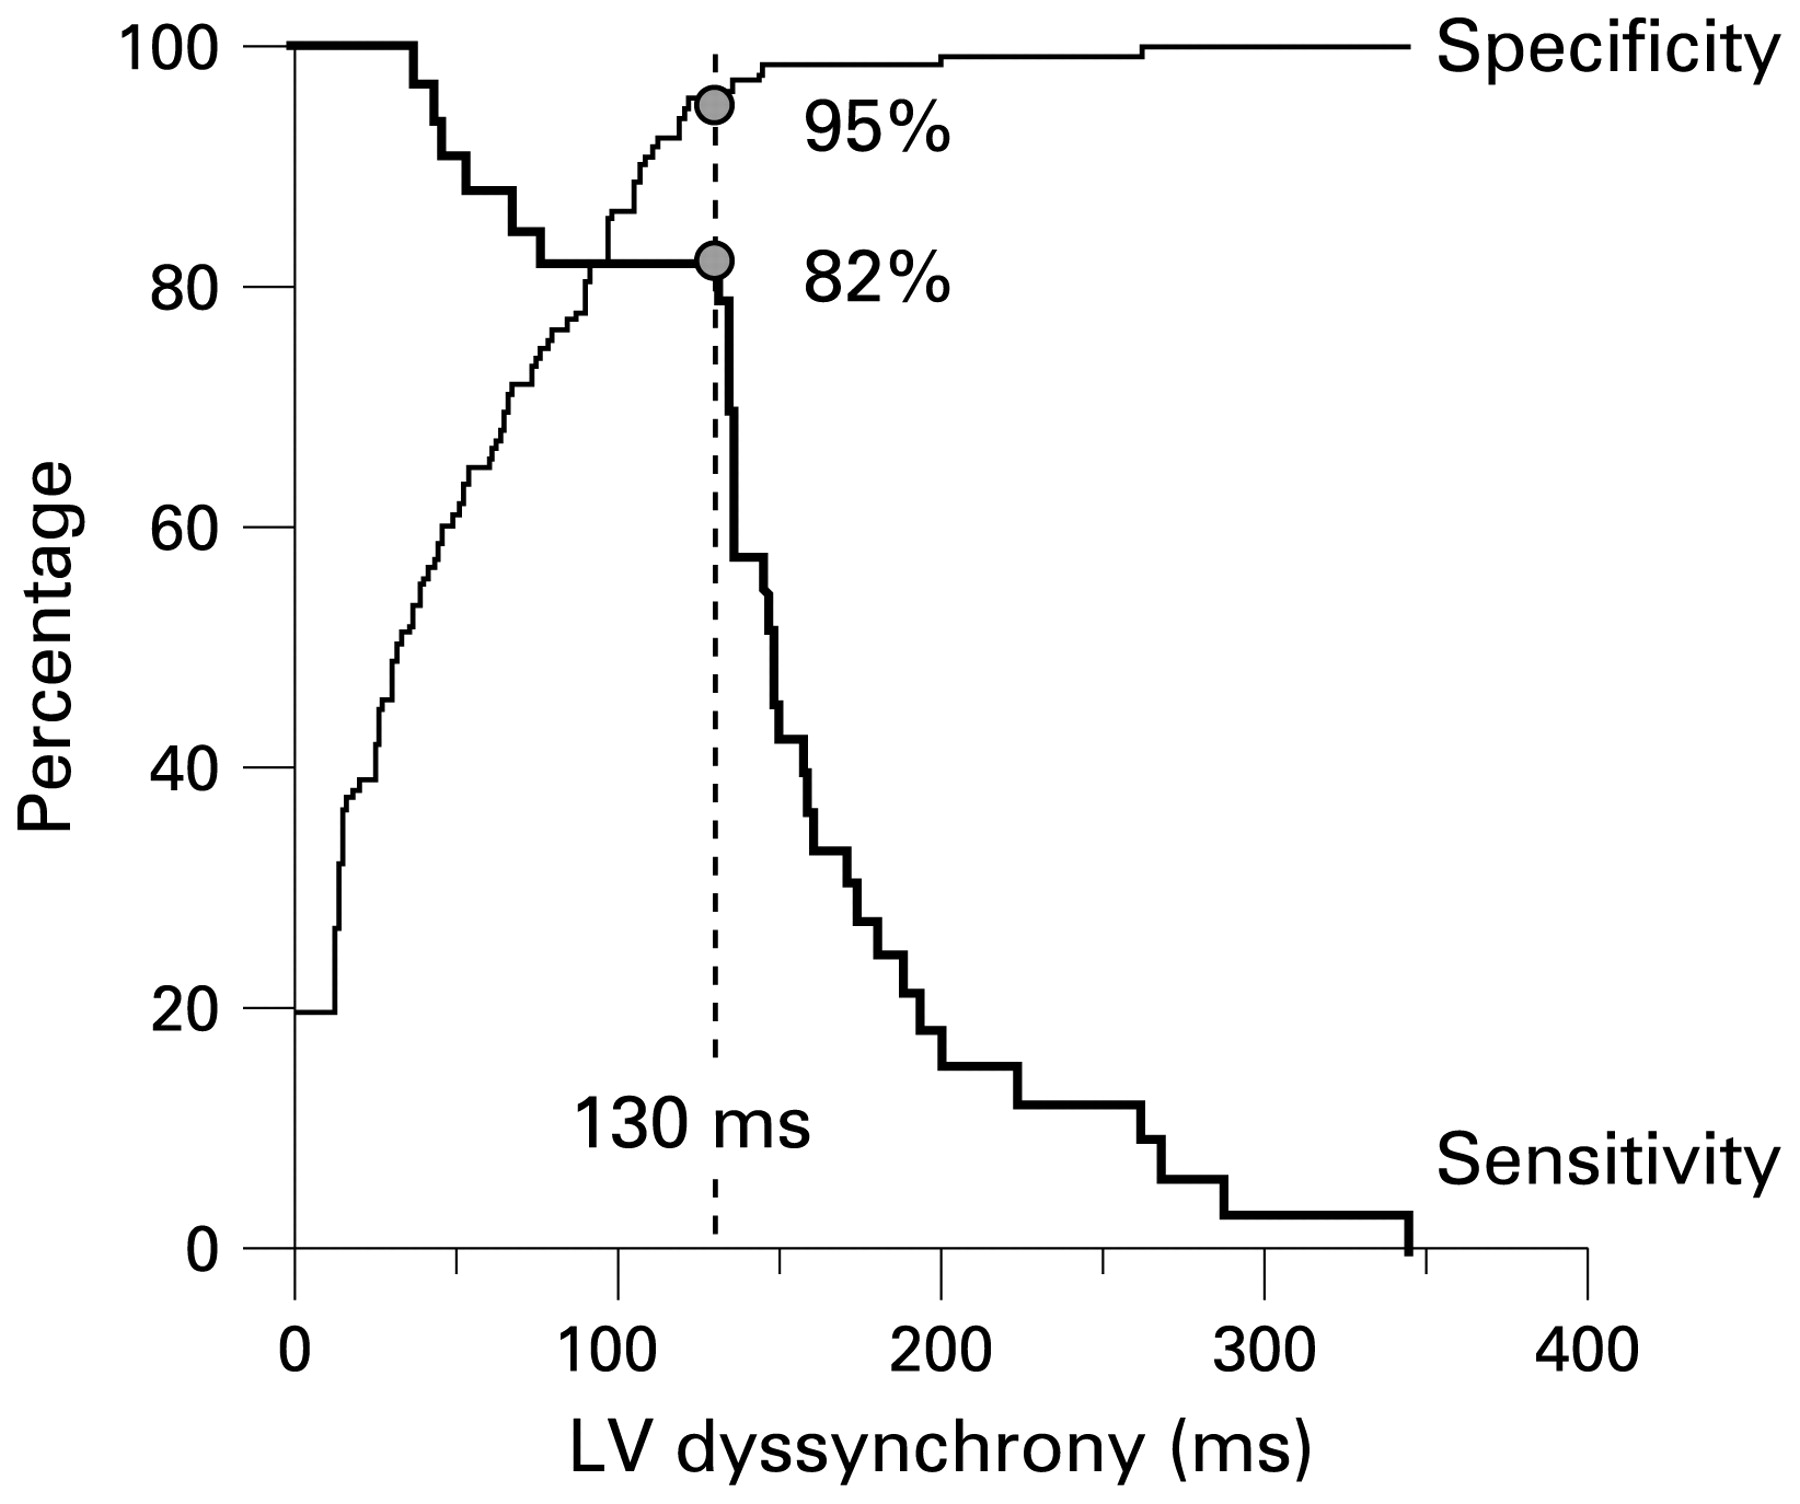
Receiver-operating characteristic curve analysis to determine the optimal cut-off value for LV dyssynchrony to predict LV remodelling. Using a cut-off value of 130 ms, a sensitivity of 82% and a specificity of 95% were obtained to predict LV remodelling at 6 months’ follow-up. LV, left ventricular. Reprinted from Mollema et al34 with permission.
In a recent study, Ng et al studied 122 healthy volunteers and 40 patients with NSTEMI. The authors compared LV dyssynchrony assessment using speckle tracking with LV dyssynchrony assessment with TDI. A good correlation (r = 0.75) was demonstrated between the derived dyssynchrony indexes of the two imaging modalities. However, agreement between the techniques was suboptimal, as LV dyssynchrony assessed with speckle tracking was significantly lower than LV dyssynchrony quantified with TDI. In addition, speckle tracking had lower coefficients of variation than TDI. Importantly, only speckle tracking could identify significant differences in systolic dyssynchrony in patients with NSTEMI versus healthy subjects.
Additional large studies are needed to confirm the prognostic value of the presence of substantial LV dyssynchrony in the early phase after MI and to evaluate the effect on survival.35
Contrast echocardiography
Initially, clinical use of contrast echocardiography was directed to detection of intracardiac shunts. Nowadays, the use of intravenous contrast in combination with echocardiography is increasingly applied and is of prognostic importance in patients with acute MI. In those patients, contrast echocardiography can be used to improve endocardial border detection for better assessment of global and regional systolic LV function and to identify LV thrombi (fig 10). Furthermore, myocardial contrast echocardiography enables evaluation of myocardial perfusion and microvascular integrity (and thus myocardial viability), providing valuable information about myocardial viability, which is important for clinical outcome after acute MI.

Example of the use of myocardial contrast echocardiography for better detection of LV thrombus after acute MI. This patient had a recent anterior MI with apical involvement. The echocardiographic images (two-chamber view) are suboptimal owing to limited acoustic window; the presence of an LV thrombus was suspected. With the use of intravenous contrast the presence of the thrombus was confirmed. LV, left ventricular; MI, myocardial infarction.
Because of recent safety considerations, the possible interaction between ultrasound and tissue has received much attention.36 37 Recently, the Food and Drug Administration (FDA) has declared that echo contrast agents should not be administered in patients with unstable coronary disease in view of deaths found in such patients in postmarketing surveillance. However, more recently, the FDA withdrew this so called black box warning.38 It seems that the usefulness of contrast echocardiography in ST-segment elevation MI (STEMI) is such that the benefit far outweighs the potential risk certainly in comparison with other competing techniques. Indeed, large-scale phase III studies of more than 1700 patients leading to product approval disclosed no safety concerns.39 40 Furthermore, no adverse events have been reported in large human studies performed in patients with STEMI. Recently, Kusnetzky et al retrospectively analysed 18 671 hospitalised patients undergoing clinically indicated echocardiography.41 Of those patients who underwent echocardiography without the use of intravenous contrast, 46 died within 24 h (0.37%). Of patients receiving intravenous contrast, 26 died within 24 h (0.42%, p = 0.60). No patient died within 1 h of echocardiography. More specifically, Nucifora et al recently studied the safety of contrast echocardiography in 115 consecutive patients within 24 h after ST-elevation acute MI. All patients were admitted to the coronary care unit and underwent clinically indicated contrast echocardiography to assess LV size, shape and function, but also to exclude thrombus formation. Administration of intravenous contrast did not lead to any significant change in vital signs, nor were abnormalities on physical examination or on the ECG detected. No major adverse events occurred and only minor events (hypersensitivity at the injection site and transient back pain) were seen in 4% of patients.42
Endocardial border detection
The use of contrast echocardiography for opacification of the LV cavity enhances endocardial border delineation, thereby decreasing variability in the assessment of LV volumes and LVEF, and improving the interpretation of regional wall motion abnormalities.43 44 45 46 47 Malm et al evaluated the accuracy and reproducibility of contrast echocardiography versus tissue harmonic imaging for measurements of LV volumes and LVEF in 110 consecutive patients; MRI was used as an independent “gold standard”.43 A volume underestimation by echo was described, which was less pronounced when contrast was used. Limits of agreement between echo and MRI for assessment of LV volumes and LVEF narrowed significantly with the use of echo contrast (fig 11).

Bland–Altman diagram for assessment of LVEF, demonstrating mean difference (solid line) and limits of agreement (dashed lines) between contrast echocardiography and MRI. Limits of agreement between echo and MRI for assessment of LVEF narrowed significantly when intravenous contrast was used. Closed circles indicate poor baseline image quality (n = 36) and open circles indicate good baseline image quality (n = 51). LVEF, left ventricular ejection fraction; MRI, magnetic resonance imaging. Reprinted from Malm et al43 with permission.
Reilly et al examined the value of contrast echocardiography in the assessment of LV wall motion in 70 patients in the intensive care unit, with a poor acoustic window.47 Wall motion (16-segment model) was evaluated on standard echocardiography, harmonic echocardiography and after intravenous contrast administration. Uninterpretable wall motion was present in 5.4 segments/patient on standard echocardiography, 4.4 on harmonic echocardiography (p = 0.2) and 1.1 on contrast echocardiography (p<0.0001). An average of 7.8 segments were read with surety on standard echocardiography, 9.2 on harmonic echocardiography (p = 0.1) and 13.7 on contrast echocardiography (p<0.0001). Therefore, particularly in patients with a poor acoustic window, contrast echocardiography appears to have incremental value for assessment of LV function and wall motion.
Assessment of myocardial perfusion (viability)
Besides improved endocardial border detection and identification of LV thrombi, myocardial contrast echocardiography allows non-invasive evaluation of myocardial perfusion and microvascular integrity (viability). Initial animal studies demonstrated the feasibility of assessment of perfusion defects with contrast echocardiography.48 49 50 51 Cheirif et al studied 15 open chest dogs after transient coronary artery occlusion, and detected perfusion defects on contrast echocardiography in 14 dogs.48 Good agreement between contrast echocardiography and nuclear imaging with thallium-201 was shown for detection and sizing of perfusion defects (r = 0.58, p<0.03). Moreover, the extent of perfusion defects on contrast echocardiography correlated with postmortem histology. The authors concluded that myocardial contrast echocardiography can be used to visualise and quantify the amount of myocardium at risk during coronary occlusion.
Kaul et al studied 30 patients with known or suspected coronary artery disease who underwent myocardial contrast echocardiography and technetium-99m sestamibi SPECT.52 Agreement between the two techniques was 92% on a segmental basis, 90% on a vascular territory basis and 86% on a patient basis. Meza et al subsequently performed a head-to-head comparison between contrast echocardiography and technetium-99m sestamibi SPECT imaging in 41 patients referred for coronary angiography.50 The overall agreement for detection of perfusion defects was 78% on a patient basis, and a good correlation for defect size between both techniques was noted (r = 0.62, p<0.0001; fig 12).

Relation between perfusion defect size on contrast echocardiography and technetium-99m sestamibi SPECT. A good correlation for perfusion defect size between both techniques was found (r = 0.62, p<0.0001). MCE, myocardial contrast echocardiography; SPECT, single photon emission computed tomography. Reprinted from Meza et al50 with permission.
Prediction of functional recovery after acute myocardial infarction
The extent and severity of perfusion defects after acute MI have been shown to correlate (inversely) with the likelihood of functional recovery at follow-up.36 53 54 55 Patients with large perfusion defects (indicating non-viable tissue) seem to have a low likelihood of functional recovery after acute MI, whereas dysfunctional regions with preserved perfusion (indicating viable myocardium) frequently exhibit improvement of function during follow-up (fig 13).36 53 Main et al studied 34 patients with recent acute MI.54 Two days after MI, patients underwent resting 2D echocardiography to assess wall motion, followed by contrast echocardiography to assess perfusion; 2 months later recovery of function was evaluated. Ninety per cent of dysfunctional segments with preserved perfusion improved in function at follow-up.
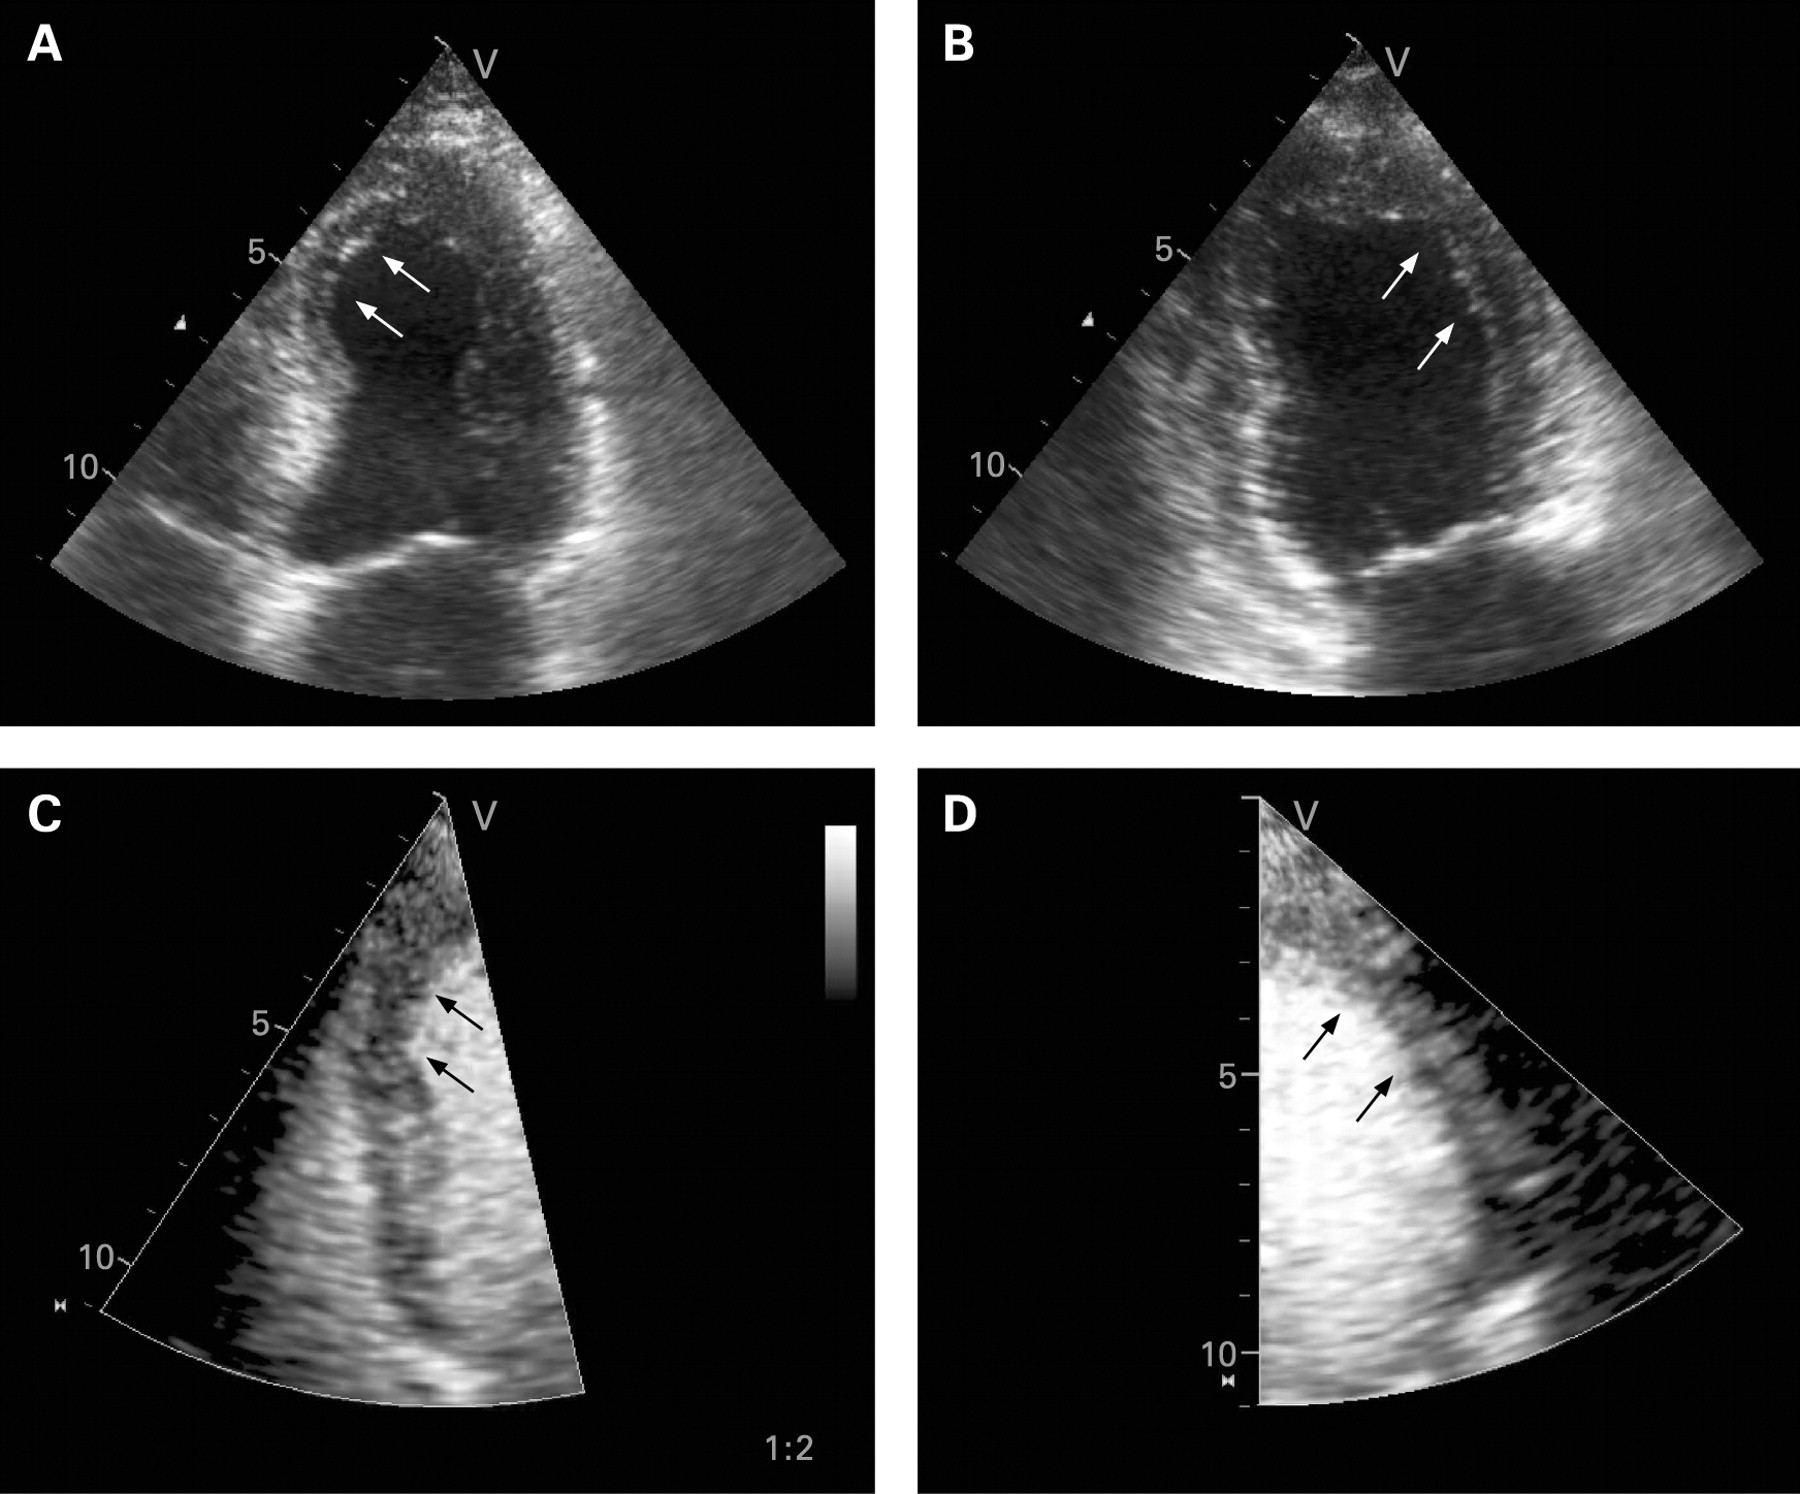
Example of a patient with acute anterior myocardial infarction. On standard 2D echocardiography the apical part of the septum (A) and the mid and apical parts of the anterior wall (B) are akinetic. Myocardial contrast echocardiography showed normal perfusion of both the septum (C) and the anterior wall (D). At 6 months’ follow-up, functional recovery of these akinetic segments was seen.
In addition, Janardhanan et al demonstrated that myocardial contrast echocardiography can predict functional recovery after reperfusion therapy for acute MI.56 Fifty patients underwent myocardial contrast echocardiography 7–10 days after acute MI. Myocardial perfusion, wall thickening and wall thickening index (scores of all segments divided by the number of segments, marker of global LV function) were assessed at baseline. Wall thickening and the systolic wall thickening index were reassessed at 3 months’ follow-up. Improvement in function was seen in 84% with preserved perfusion, whereas 93% of segments with perfusion defects did not recover in function (p<0.05). Moreover, the extent of LV myocardium with preserved perfusion was related to global LV function at 3 months (r = −0.91, p<0.001). Multivariate analysis demonstrated that the findings on contrast echocardiography contributed independently to the prediction of functional recovery.
Ito and colleagues studied 39 patients with acute anterior MI who were treated with primary PCI.57 Myocardial contrast echocardiography was performed immediately after successful PCI. LVEF was measured sequentially at 1 day and 1 month after PCI. Myocardial contrast echocardiography showed preserved perfusion of the infarct-related segments in 30 (77%) patients. The remaining nine patients (23%), however, showed impaired perfusion in the infarct zone. The baseline LVEF was higher in the patients with preserved perfusion; during follow-up, the improvement in LVEF was significantly greater in the patients with preserved perfusion (from a mean (SD) of 42.3 (11.0)% at baseline to 56.4 (13.4)% at follow-up, p<0.001) than in the patients with reduced/absent perfusion (from 34.7 (8.9)% at baseline to 42.7 (8.9)% at follow-up, NS). Myocardial contrast echocardiography demonstrated that the extent of perfusion defects after successful PCI is predictive for global functional recovery in patient with acute MI. Pooled analyses of 23 previously published studies (with more than 1100 patients) showed high sensitivity (approximately 85%) but lower specificity (approximately 74%) of myocardial contrast echocardiography to predict recovery of regional and/or global function after acute MI.36 53
The extent and severity of myocardial perfusion defects (non-viable myocardium) after acute MI are also related to the development of LV dilatation (remodelling) over time.58 59 60 61 62 In the Acute Myocardial Infarction Contrast Imaging (AMICI) study, Galiuto and coworkers evaluated 110 patients with first successfully reperfused STEMI.61 After primary PCI, peak creatine kinase, ST-segment resolution, TIMI flow grade and myocardial blush grade (on angiography) were assessed. Perfusion defects (non-viable tissue) were evaluated with myocardial contrast echocardiography on day 1 after reperfusion. WMSI, the extent of wall motion abnormalities, LVEDV and LVEF were assessed after reperfusion and at 6 months’ follow-up. Over that 6-month period, 27 (25%) patients developed LV remodelling. At multivariate analysis, only TIMI flow grade <3 and the extent of perfusion defects on contrast echocardiography were independently associated with LV remodelling (fig 14). Main et al studied 50 patients with recent anterior wall MI and regional akinesia.63 All patients underwent myocardial contrast echocardiography 2 days after MI. At 6 months’ follow-up, LV remodelling (defined as an increase >15% in LVEDV index) occurred in 19 patients (38%). Both the transmural extent of infarction and the number of abnormally perfused segments predicted LV remodelling; all patients with >5 myocardial segments with reduced perfusion exhibited LV remodelling.

Correlation between the extent of perfusion defects and LVEF at follow-up. On the x axis the extent of the perfusion defect (expressed as the length of the contrast defect (CD)) assessed with myocardial contrast echocardiography on day 1 after reperfusion is provided. The y axis provides the LVEF at follow-up. A strong relation was observed between both parameters. LVEF, left ventricular ejection fraction. Reprinted from Galiuto et al61 with permission.
Prognostic value after acute myocardial infarction
The prognostic value of contrast echocardiography after acute MI has been examined in various studies. Reduced myocardial perfusion (scar tissue, but also no-reflow after acute MI) is associated with poor outcome.64 65 66 67
Khumri and colleagues demonstrated that patients with first anterior MI are at high risk of death during long-term follow-up in the presence of abnormal perfusion (fig 15).65 The authors evaluated 167 patients with anterior acute MI with contrast echocardiography 2 days after admission, and a perfusion score index was calculated; mean follow-up was 39 months. The perfusion score index was a strong predictor of mortality (odds ratio 3.2 for each 1.0 increase in perfusion score index, p = 0.04) and provided incremental value over clinical and angiographic variables.

Kaplan–Meier curve showing event-free survival for the combined end point of death and new-onset heart failure in patients with normal perfusion (dashed line) or abnormal perfusion (solid line) on contrast echocardiography. Patients with abnormal perfusion had a lower survival than those patients with normal perfusion during follow-up after acute myocardial infarction. Reprinted from Khumri et al65 with permission.
The prognostic value of myocardial contrast echocardiography was further examined by Dwivedi et al66 who investigated 95 stable patients with contrast echocardiography at 7±2 days after acute MI. During a follow-up of 46±16 months, there were 15 (16%) events (eight cardiac deaths and seven non-fatal acute MI). Among the clinical, biochemical, electrocardiographic, echocardiographic and coronary angiographic markers of prognosis, the contrast echo results were independently predictive of cardiac death (p = 0.01) and cardiac death or acute MI (p = 0.002). Similarly, Sakuma et al evaluated 50 patients with first MI and thrombolytic therapy, using contrast echocardiography on day 2 postinfarction. The presence of reduced perfusion on myocardial contrast echocardiography, was predictive of major cardiac events (death, non-fatal MI, or admission for heart failure) during a mean follow up of 22 months (event rate 28% in patients with reduced perfusion versus 4% in those with preserved perfusion, p<0.05).67
Other echocardiographic techniques
Stress echocardiography
In patients with acute MI, stress (exercise or pharmacological) echocardiography can be used to assess ischaemia and viability. Worsening of wall motion during high-dose dobutamine infusion is related to the presence of ischaemia, whereas improvement of wall motion during low-dose dobutamine infusion (contractile reserve) indicates the presence of viable (stunned) myocardium. Extensive reviews have been previously published on the prognostic value of stress echocardiography.68 69
Picano et al studied the value of dipyridamole stress echocardiography in predicting reinfarction in 1080 patients assessed early (10±5 days) after uncomplicated acute MI. Patients were followed up for 14±10 months. The results of stress echocardiography were positive for ischaemia in 475 patients (44%). During follow-up, reinfarction occurred in 30 patients with positive and 20 with negative results (6.3% vs 3.3%, p<0.01). Reinfarction was fatal in five of 30 patients with positive results and in none of 20 with negative results (16.6% vs 0%, p = 0.07). Therefore, it was concluded that dipyridamole stress echocardiographic positivity identifies patients at higher risk of reinfarction, especially fatal reinfarction, early after acute MI.70
Next, Sicari et al assessed the value of stress-induced ischaemia early after infarction (12±5 days) using dobutamine–atropine stress echocardiography in 778 patients. Dobutamine–atropine stress echocardiographic findings were positive for myocardial ischaemia in 436 patients (56%) and negative in 342 (44%). During follow-up (9±7 months), there were 14 cardiac-related deaths (1.8% of the total cohort), 24 (2.9%) non-fatal myocardial infarctions and 63 (8%) hospital readmissions for unstable angina. One hundred and seventy-four patients (22%) underwent coronary revascularisation (PCI or coronary artery bypass grafting). Spontaneous events occurred in 61/436 patients with positive and 40/342 patients with negative findings on dobutamine–atropine stress echocardiography (14% vs 12%, p = 0.3). When only hard cardiac events were considered, age was the strongest predictor (χ2 = 3.6, p = 0.056), followed by WMSI at peak dose (χ2 = 3.3, p = 0.06) and remote ischaemia (χ2 = 2.25, p = 0.1). When cardiac death was considered, WMSI at peak dose was the best predictor (hazard ratio 9.2, p<0.0001).71
Bigi et al evaluated the prognostic value of dobutamine stress echocardiography performed in the early postinfarction period; 406 patients underwent dobutamine stress echocardiography within 10 days of uncomplicated MI and were prospectively followed up for almost 9 months. The change in WMSI between rest and stress (p<0.001) was an independent predictor for cardiac events.72
Pierard et al were among the first to use low-dose dobutamine echocardiography to detect the presence of contractile reserve indicative of stunned, viable myocardium. The authors showed that patients with contractile reserve after acute MI exhibited spontaneous improvement in function.73
Picano and coworkers evaluated the prognostic value of residual viability, as assessed by low–high dobutamine stress echocardiography performed 12±6 days after acute MI, in 314 patients (mean (SD) age 58 (9) years) with global LV dysfunction.74 Over a follow-up of 9±7 months there were 12 cardiac deaths (3.8%). The presence of myocardial viability was related to good outcome, whereas the presence of ischaemia was related to poor outcome.
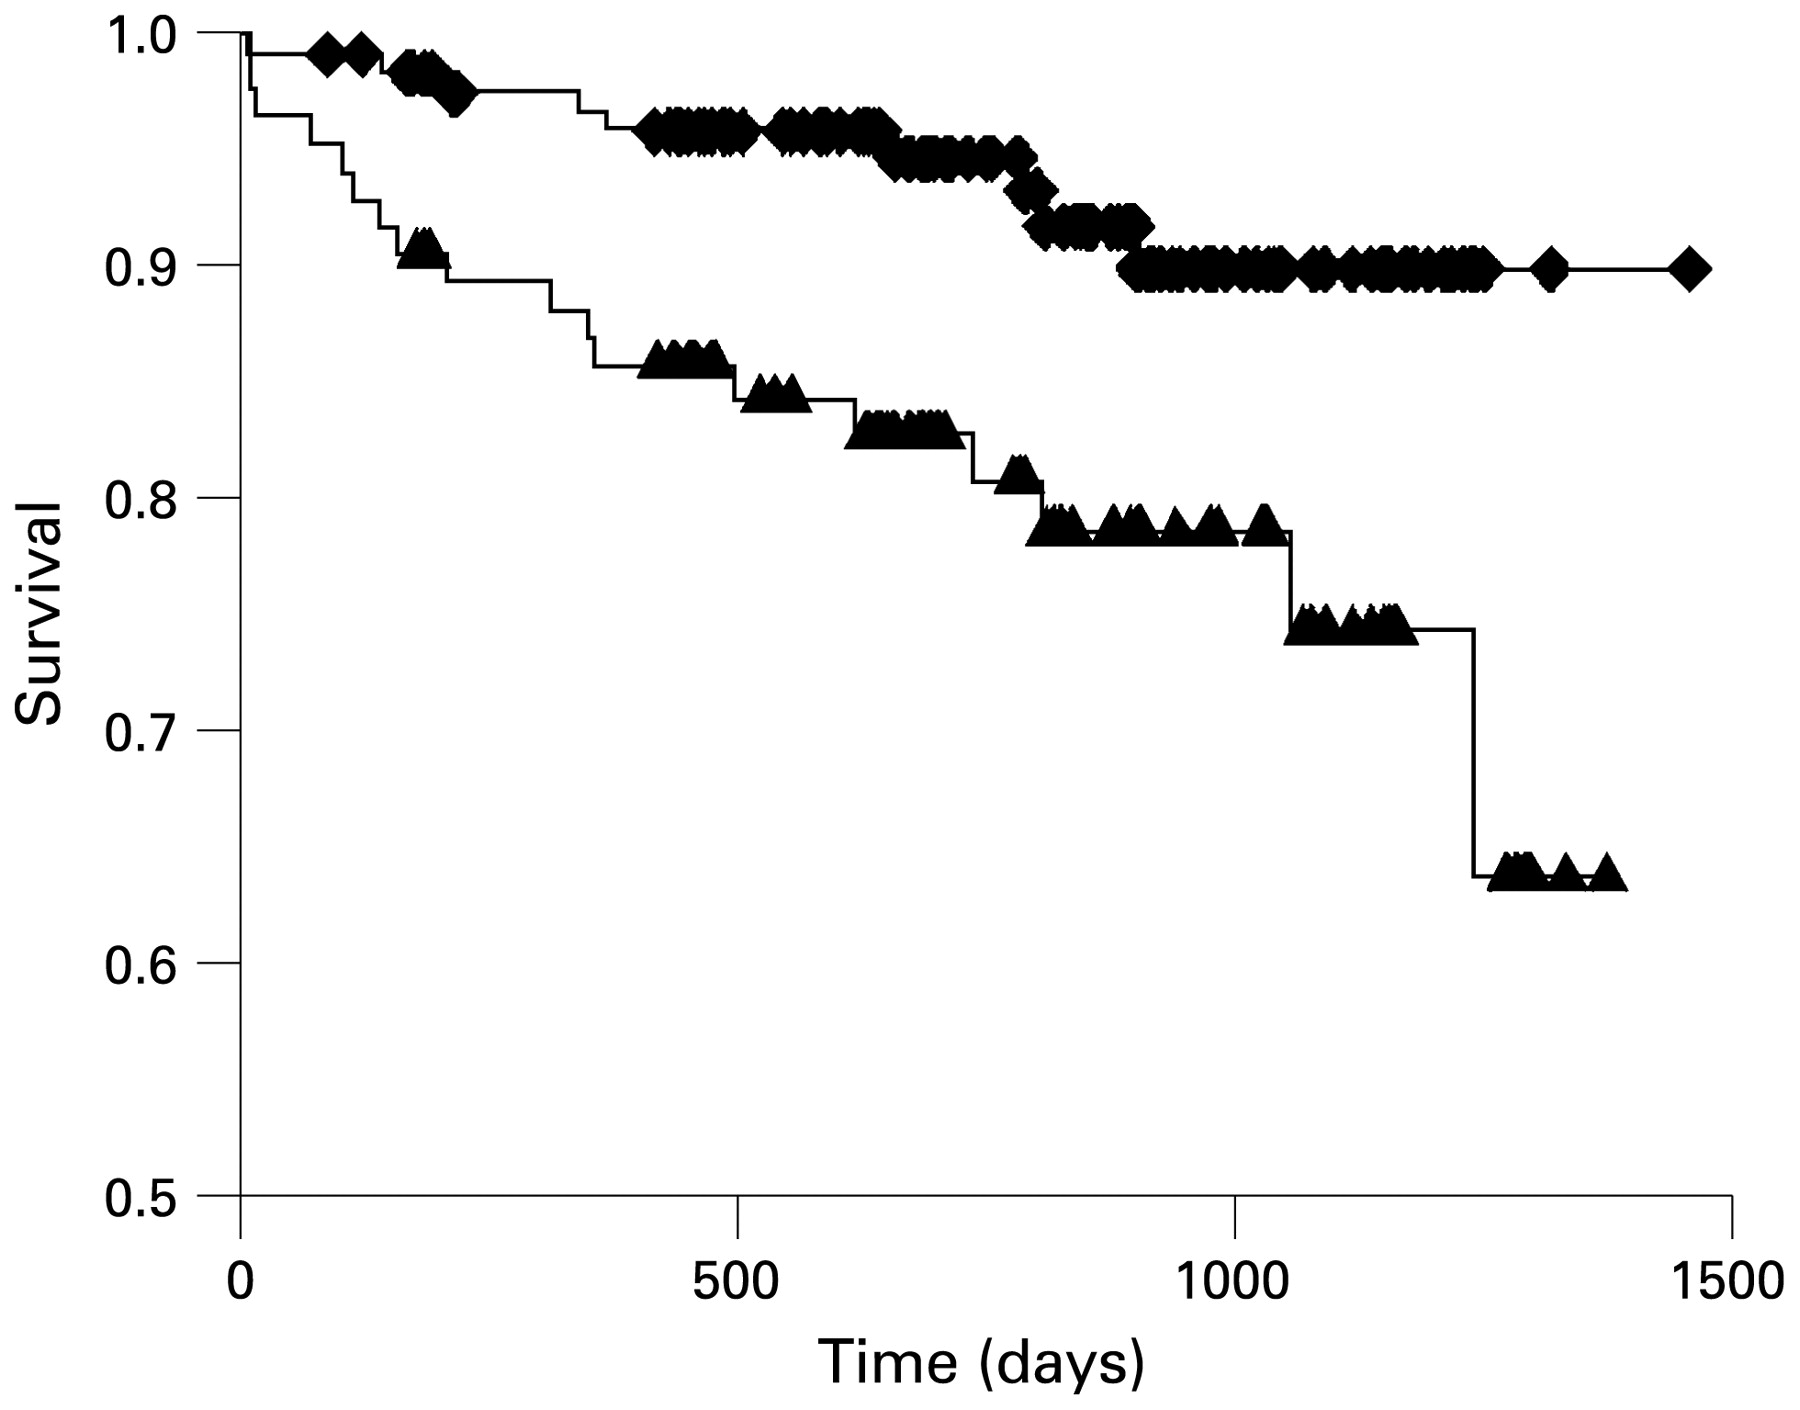
In addition, Swinburn and Senior evaluated 212 patients who underwent dobutamine stress echocardiography 4.8±1.5 days after acute MI.75 Viability in the infarct zone was detected by low-dose dobutamine echocardiography in 44% of patients. During follow-up (803±297 days), 27 (13%) patients died and 16 (8%) experienced a non-fatal reinfarction. Independent predictors of both mortality and combined mortality and non-fatal acute MI were age, resting LV function and the absence of viability (fig 16).

Kaplan–Meier curves demonstrating the impact on mortality of a WMSI at low-dose dobutamine of ⩽1.6 (diamonds) compared with a score of >1.6 (triangles). Survival was higher in patients with WMSI ⩽1.6 than in those with WMSI >1.6 (p = 0.005). WMSI, wall motion score index. Reprinted from Swinburn and Senior75 with permission.
In general, the presence of ischaemia on dobutamine stress echocardiography is associated with poor outcome when patients are treated conservatively; patients with viability, however, have good outcome which is possibly related to the presence of stunned myocardium, which improves spontaneously in function after acute MI.
Coronary flow reserve
Advances in colour Doppler technology permit assessment of flow (and coronary flow reserve (CFR)) in the coronary arteries, particularly in the left anterior descending coronary artery.76 77 CFR was defined as the ratio between the hyperaemic diastolic flow velocity (after intravenous adenosine infusion) and the resting diastolic flow velocity.78
Voci and colleagues demonstrated the feasibility of transthoracic Doppler echocardiography for assessment of CFR in both the left anterior descending and posterior descending coronary arteries in 44 subjects with varying degrees of coronary artery disease.79 Based on coronary angiography, patients were divided into three groups: group 1 (0–29% stenosis), group 2 (30–69% stenosis) and group 3 (⩾70% stenosis). Mean (SD) CFR of the left anterior descending coronary artery was 3.31 (0.54) in group 1 (n = 15), 2.49 (0.71) in group 2 (n = 10) and 1.12 (0.49) in group 3 (n = 19, p<0.0001). CFR of the posterior descending coronary artery was 2.62 (0.25) in group 1 (n = 17), 2.33 (0.32) in group 2 (n = 9) and 1.40 (0.54) in group 3 (n = 18, p<0.0001). A cut-off value for CFR <2 identified ⩾70% stenosis in both the left anterior descending and posterior descending coronary arteries. Pizzuto et al used transthoracic Doppler echocardiography during venous adenosine infusion to measure CFR of the left anterior descending coronary artery in 45 patients before and 3.7±2.0 days after successful PCI, as well as in 25 subjects with an angiographically normal left anterior descending coronary artery (control group).78 CFR before PCI was significantly lower in patients than in control subjects (1.45 (0.50) vs 2.72 (0.71), p<0.01) and increased towards the normal range after PCI (2.58 (0.70) vs 2.72 (0.75), p = NS).
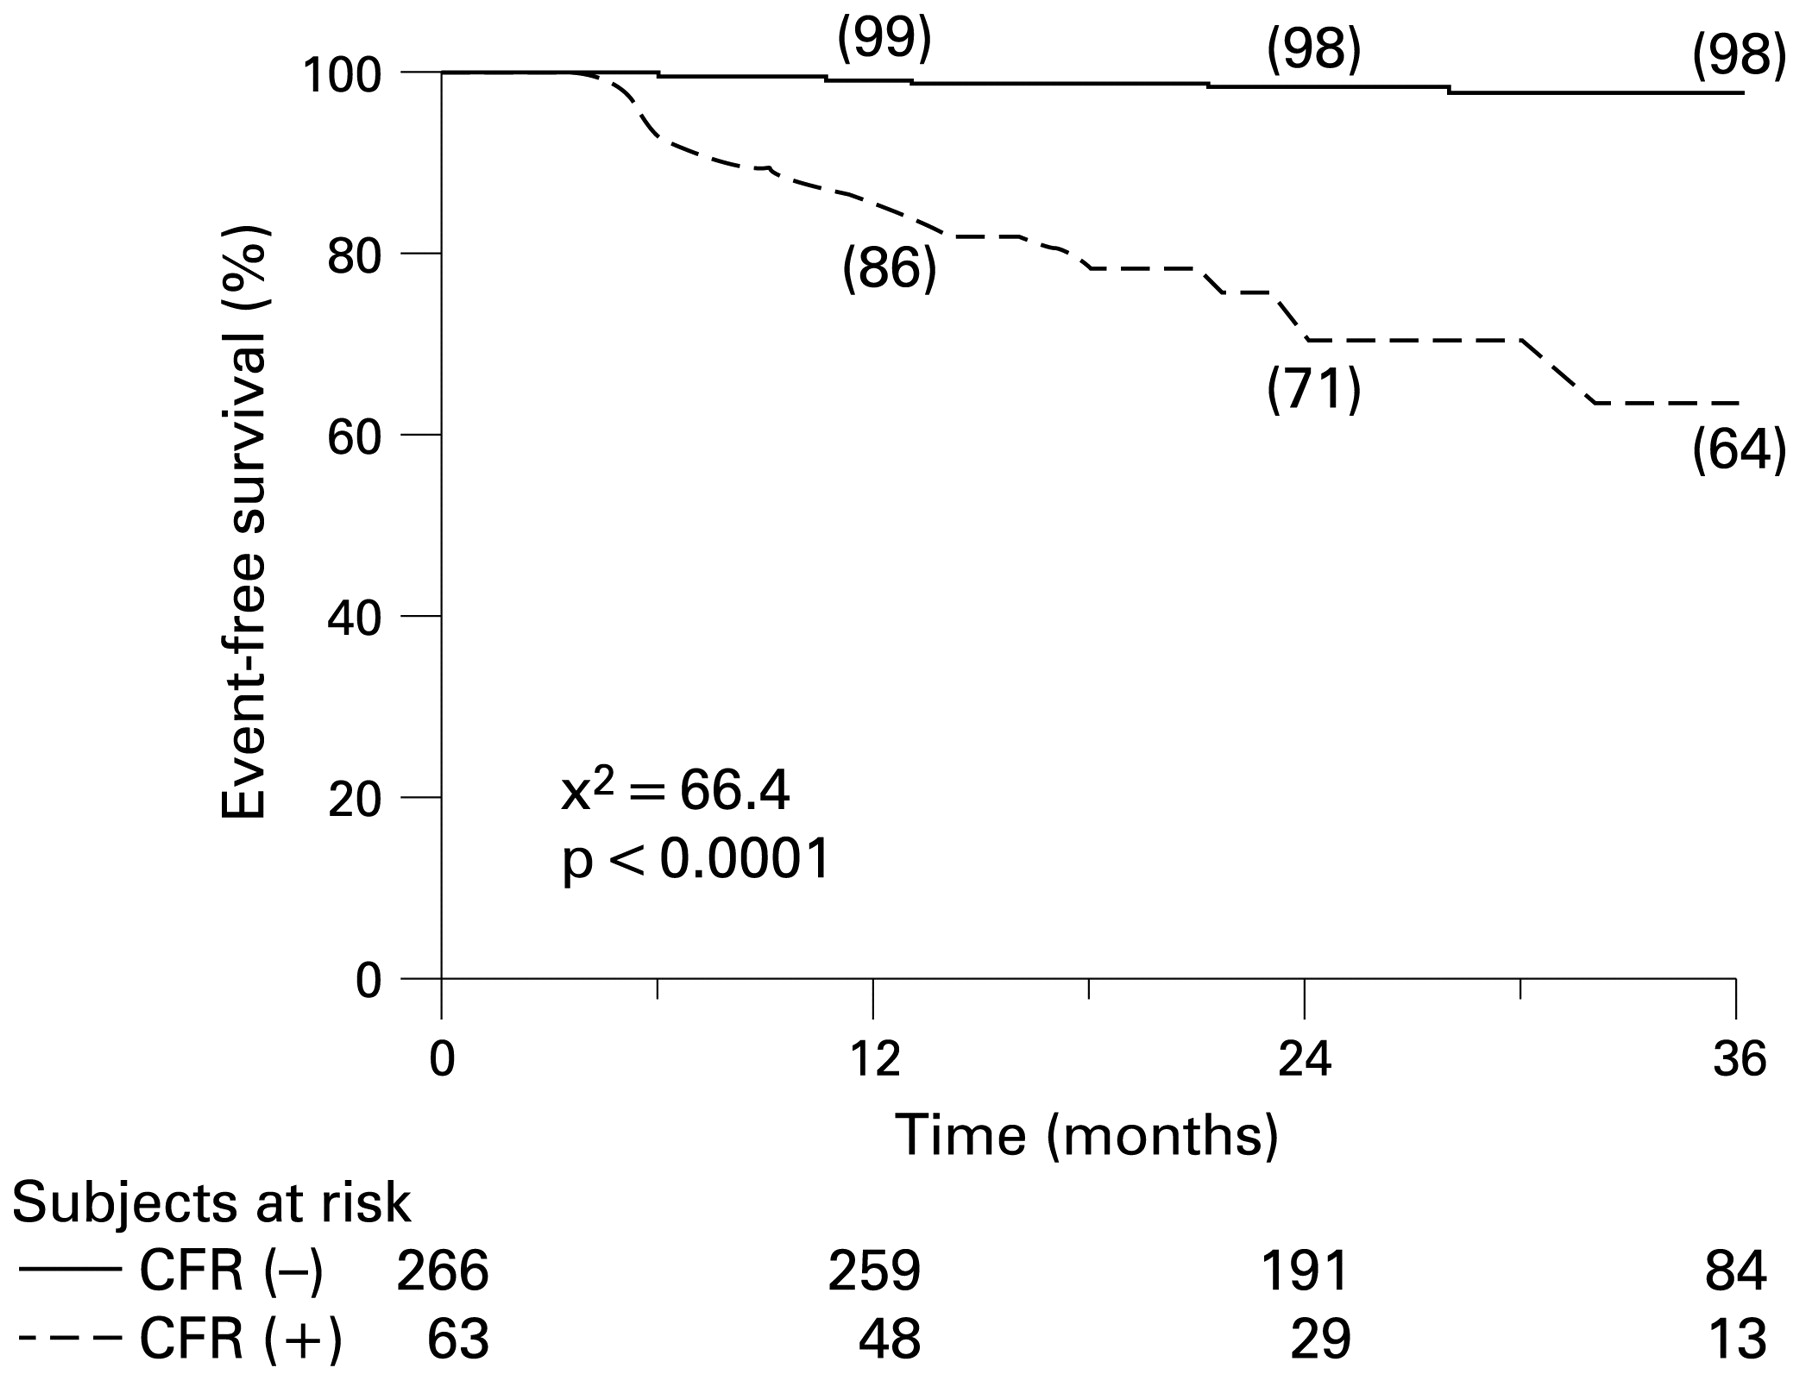
Rigo et al assessed the prognostic value of CFR in patients with known or suspected coronary artery disease and negative stress echocardiography.80 All 329 patients underwent dipyridamole stress echocardiography with CFR evaluation of the left anterior descending coronary artery. During follow-up (28±10 months), 22 events occurred: one cardiac death, six non-fatal infarctions, five patients with unstable angina and 10 late (>6 months) coronary revascularisations. CFR ⩽1.92 was the best predictor of future events (sensitivity 77%, specificity 85%) and was used as criterion for reduced CFR accordingly. Sixty-three (19%) patients had reduced and 266 (81%) had normal CFR of the left anterior descending coronary artery. The 36-month event-free survival was higher in patients with normal CFR and lower in patients with reduced CFR (98% vs 64%, p<0.0001, fig 17). CFR of the left anterior descending coronary artery provided additional prognostic information over clinical, resting echo and angiographic findings. Therefore, in patients with known or suspected coronary artery disease and negative stress echocardiography by wall motion criteria, CFR provides independent information for prognostic stratification. A reduced CFR is associated with worse long-term outcome.

Kaplan–Meier event-free survival curves illustrating the group with preserved (CFR−, solid line) and reduced CFR (CFR+, dashed line). Number of patients examined each year is shown. The 36-months event-free survival was higher in patients with preserved CFR and lower in patients with reduced CFR (98% vs 64%, p<0.0001). Reprinted from Rigo et al80 with permission.
These results were recently confirmed by the same authors in a prospective, multicentre, observational study.81 The authors evaluated 1145 patients who underwent high-dose dipyridamole stress echocardiography with assessment of CFR of the left anterior descending coronary artery. Stress echocardiography was positive for regional wall motion abnormalities in 291 (25%) and negative in 854 (75%) patients. Mean (SD) CFR was 2.2 (0.5). At individual patient analysis, 702 patients had normal (CFR >2.0) and 443 had abnormal CFR of the left anterior descending coronary artery. During a median follow-up of 27 months, 109 events occurred: 16 deaths, 17 non-fatal infarctions and 76 re-hospitalisations for unstable angina. At multivariable analysis, CFR of the left anterior descending coronary artery (hazard ratio 2.4, p = 0.030) and stress echocardiography positivity for regional wall motion abnormalities (hazard ratio 3.6, p = 0.000) were independent prognostic predictors of cardiac events.
Few data are available about the value of CFR in patients early after acute MI. However, CFR of the left anterior descending artery in patients with acute MI has been associated with long-term viability of the jeopardised myocardium. Ueno et al studied 29 patients with acute anterior MI who underwent successful PCI.82 Transthoracic Doppler echocardiography was used to quantify coronary flow velocities in the distal left anterior descending artery at rest and after adenosine triphosphate. Coronary flow velocity reserve was calculated immediately and 24 h after revascularisation. Regional wall motion was analysed to calculate the anterior WMSI before revascularisation and at discharge (20±4 days after infarction). Coronary flow velocity reserve immediately and 24 h after revascularisation correlated significantly with anterior WMSI at discharge (r = −0.58, p<0.001 and r = −0.80, p<0.0001, respectively). The optimal cut-off ratio for predicting viable myocardium was 1.5 for coronary flow velocity reserve 24 h after revascularisation, yielding a sensitivity of 94% and specificity of 91%.
In a study by Saraste and coworkers, 15 patients with a first acute anterior MI who underwent successful PCI were analysed.83 Coronary flow velocity was measured from the mid left anterior descending artery 3 days after PCI. Myocardial viability of the region of the left anterior descending artery was quantified 3 months after acute MI using [18F]fluorodeoxyglucose and positron emission tomography. Diastolic deceleration time of the left anterior descending artery flow velocity correlated with myocardial viability on positron emission tomography in the region of the left anterior descending artery; a diastolic deceleration time <190 ms was always related to non-viable myocardium.
Montisci et al tested whether preserved CFR 2 days after reperfused acute MI is predictive of myocardial viability.84 The authors assessed CFR in the left anterior descending coronary artery in 24 patients with acute anterior MI. Low-dose dobutamine echocardiography was performed 6±3 days after acute MI and follow-up echocardiography at 3 months. An inverse correlation was found between CFR and anterior WMSI at dobutamine and follow-up echocardiography (r = −0.49, p = 0.016 and r = −0.55, p = 0.005, respectively). The authors concluded that CFR early after acute MI is correlated with myocardial viability at follow-up.
Accordingly, non-invasive measurement of CFR has been shown to provide important prognostic information both in patients with stable coronary artery disease and in patients with acute MI.
Three-dimensional echocardiography
The use of 3D echocardiography in clinical cardiology has increased over the recent years, principally for the assessment of LV volumes and LVEF.85 Particularly in patients with MI, the LV shape can be distorted and 3D echocardiography provides superior information on LV volumes and LVEF.
Jenkins et al studied 50 patients (mean (SD) age 64 (8) years) presenting for evaluation of LV function with 2D echocardiography, 3D echocardiography and MRI as the “gold standard”.86 The average (SD) LVEDV by MRI was 172 (53) ml. LVEDV was underestimated by 2D echocardiography (mean difference −54 (33) ml; p<0.01) but only slightly by 3D echocardiography (−4 (29) ml; p = 0.31). Similarly, LVESV by MRI (91 (53) ml) was underestimated by 2D echocardiography (mean (SD) difference −28 (28) ml; p<0.01) and by 3D echocardiography (mean (SD) difference −3 (18) ml; p = 0.23). LVEF by MRI was similar by 2D echocardiography (p = 0.76) and 3D echocardiography (p = 0.74).
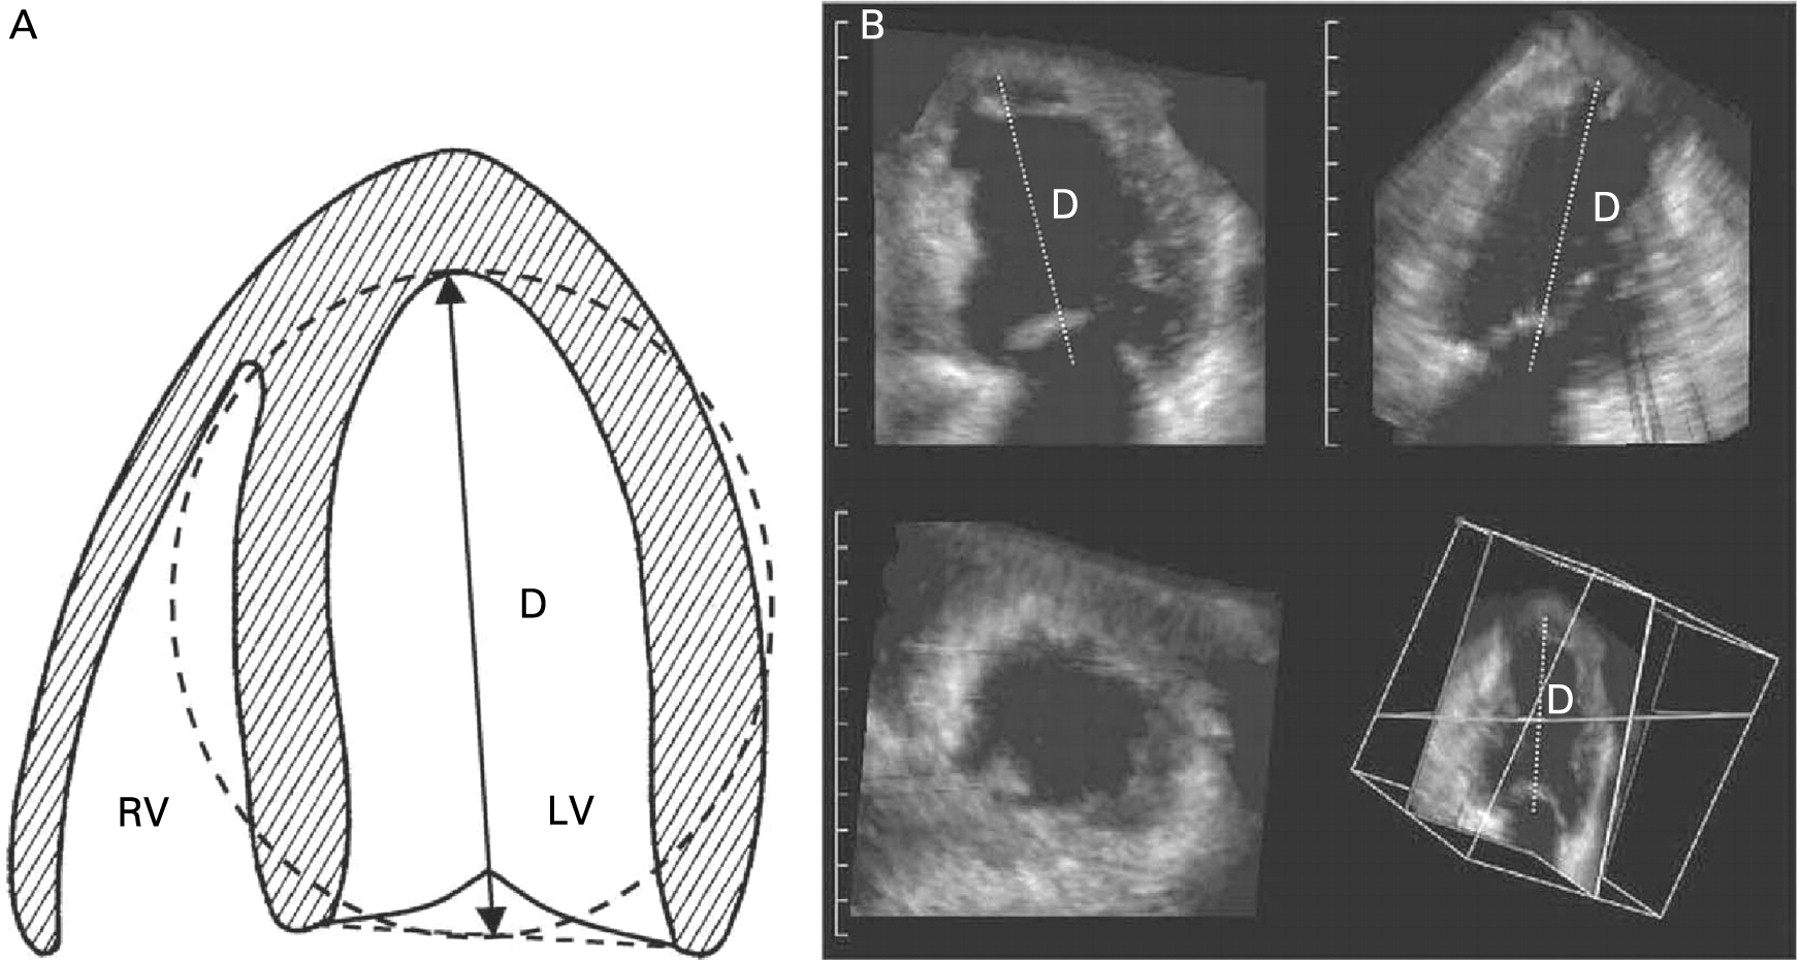
Preliminary data have shown the usefulness of 3D echocardiography for prediction of LV dilatation after acute MI. Mannaerts et al evaluated 33 patients with acute MI with 3D echocardiography at baseline (6±4 days after MI) and at 6 and 12 months’ follow-up. LV remodelling was defined as an increase in LVEDV by 20% or more at 6 or 12 months’ follow-up. The sphericity index derived from 3D echocardiography (LVEDV divided by the volume of a sphere whose diameter is the LV end-diastolic long axis) was the best predictor for LV dilatation (fig 18).87

Schematic overview of the three-dimensional (3D) sphericity index (A). The LV cavity is shown with D as the LV end-diastolic major long axis. Overview of the dynamic 3D dataset with two near perpendicular long axes (B, top), a short-axis (B, lower left), and a cubical display with corresponding cut planes (B, lower right). The measurement of D is shown. LV, left ventricular. Reprinted from Mannaerts et al87 with permission.
Li and colleagues evaluated 62 patients with acute MI with 3D echocardiography at baseline (72±5 h after MI) and 6 months later.88 LV remodelling was defined as a 20% increase in LVEDV from baseline to 6 months’ follow-up. The LV conic index (LVEDV divided by the volume of a cone whose bottom diameter is the internal diameter of the mitral annulus and height is the LV long axis) at baseline appeared the best predictor of LV remodelling.
Conclusion
In clinical practice, echocardiography has become an important component in the evaluation of patients with acute MI. Various parameters derived from 2D echocardiography have been demonstrated to provide prognostic information, including LV volumes, LVEF, WMSI and E/E′ ratio. These parameters focus on LV function, but additional information on cardiac performance such as mitral regurgitation, LA size, and RV function is also important for prognostification. This has been confirmed in several large clinical studies. Moreover, novel technology including strain (rate) imaging based on TDI and speckle tracking can also provide prognostic information; in particular, the prognostic value of LV dyssynchrony appears of interest. These more sophisticated parameters appear promising, but thus far only small patient cohorts have been reported, and surrogate end points such as LV remodelling were used, rather than long-term survival; accordingly long-term outcome studies in large patient cohorts are needed to confirm the initial findings.
Contrast echocardiography can improve endocardial border detection, including optimised detection of LV thrombus. In addition, contrast echocardiography provides information on myocardial perfusion; dysfunctional segments with reduced/absent perfusion relate to scar tissue, whereas dysfunctional segments with perfusion are viable. Based on this information, contrast echocardiography permits prediction of functional recovery after MI, and identifies patients with a high likelihood of LV dilatation after MI. This information may guide the clinician in therapeutic decision-making. Moreover, contrast echocardiography (based on identification of scar tissue and viable myocardium) provides important prognostic information, and various studies have shown that patients with large perfusion defects after MI have poor outcome.
Stress echocardiography can be used after acute MI to detect residual ischaemia, which is associated with poor outcome if treated conservatively; viability (contractile reserve) can also be assessed, and is associated with spontaneous recovery of function and good outcome. Various studies have employed Doppler imaging of the coronary arteries, yielding flow velocities and flow reserve; preserved flow reserve portends good outcome, whereas outcome is poor when flow reserve is reduced. 3D echocardiography has not been much used after acute MI, but yields excellent information on LV volumes, LVEF and LV sphericity indices, which may predict future LV dilatation.
In conclusion, echocardiography provides strong prognostic information in patients with recent MI and should be integrated in the routine evaluation of these patients.
REFERENCES
Footnotes
Funding This study was supported by an unrestricted research grant from St Jude Medical. GN was supported by a grant from the European Association of Percutaneous Cardiovascular Interventions. JJB receives research grants from GE Healthcare, BMS, Boston Scientific, Medtronic, St Jude and Edwards Lifesciences.
Competing interests None declared.
Provenance and Peer review Not commissioned; not externally peer reviewed.