Article Text

Abstract
Objective To examine the validity of estimates of coronary heart disease (CHD) risk by the Framingham risk function, for European populations.
Design Comparison of CHD risk estimates for individuals derived from the Framingham, prospective cardiovascular Münster (PROCAM), Dundee, and British regional heart (BRHS) risk functions.
Setting Sheffield Hypertension Clinic.
Patients—206 consecutive hypertensive men aged 35–75 years without preexisting vascular disease.
Results There was close agreement among the Framingham, PROCAM, and Dundee risk functions for average CHD risk. For individuals the best correlation was between Framingham and PROCAM, both of which use high density lipoprotein (HDL) cholesterol. When Framingham was used to target a CHD event rate > 3% per year, it identified men with mean CHD risk by PROCAM of 4.6% per year and all had CHD event risks > 1.5% per year. Men at lower risk by Framingham had a mean CHD risk by PROCAM of 1.5% per year, with 16% having a CHD event risk > 3.0% per year. BRHS risk function estimates of CHD risk were fourfold lower than those for the other three risk functions, but with moderate correlations, suggesting an important systematic error.
Conclusion There is close agreement between the Framingham, PROCAM, and Dundee risk functions as regards average CHD risk, and moderate agreement for estimates within individuals. Taking PROCAM as the external standard, the Framingham function separates high and low CHD risk groups and is acceptably accurate for northern European populations, at least in men.
- ischaemic heart disease
- prevention
- risk factors
Statistics from Altmetric.com
Recent guidelines for the management of hyperlipidaemia1-5 and hypertension6 ,7 have highlighted the importance of estimating absolute coronary heart disease (CHD) or cardiovascular disease (CVD) risk for effective targeting of lipid lowering or antihypertensive drug therapy. Serum cholesterol, lipid fractions, or blood pressure are by themselves very weak predictors of CHD or CVD risk.8 ,9 The accuracy of risk prediction is enhanced by counting additional cardiovascular risk factors such as age, sex, diabetes, or smoking habit,8 but absolute risk is estimated most accurately by counting and weighting these additional risk factors.8 ,10 This entails the use of multivariate techniques to explore the contribution of risk factors in combination to discriminate between future cases and non-cases of CHD or CVD.8 ,11 Risk functions derived from the Framingham study10 have been used widely to predict CHD and CVD risk because of the excellent methodology and long term follow up in this population study, and because, unlike other risk functions available, it allows estimation of CHD and CVD risk in women. Simplified forms of the Framingham risk function have been incorporated in European,1 New Zealand,2 ,6 ,7 and UK3-5 guidelines for management of hyperlipidaemia and hypertension, so that treatment can be targeted at estimated absolute risk.
Risk functions derived from one population may not be valid for risk prediction in other populations,12 and concern has been expressed that the Framingham risk function may not predict risk accurately in European populations.13 Indeed, Chamblesset al have suggested that extrapolation of risk functions to populations other than those from which they were derived is not justifiable, even to predict relative risk.14 This view is inconsistent with much evidence that the Framingham risk function predicts absolute risk accurately for other North American populations as shown by studies ofexternal 8 ,12 ,15 ,16 andconvergent 15 validity in men8 ,12 ,15 ,16 and women,8 ,12 and for CHD death8 ,12 or CHD events.15 ,16(External (or criterion) validity requires that the technique measures what it is designed to measure—that is, the risk function predicts CVD events actually observed in a different population. Convergent validity requires that the technique yields results that are consistent with the results of other similar techniques—that is, estimates of CVD risk by one risk function are consistent with estimates from other risk functions derived from different populations.) However, the Framingham risk function certainly does not estimate absolute CHD risk accurately in populations that have a low CHD risk in relation to the recognised major risk factors. Thus the Framingham function overestimated CHD risk in French,17 Hawaiian,18 and Israeli18 populations, and in the Seven Countries study19 another North American risk function overestimated absolute risk in southern European and Japanese populations. In all of these studies the North American risk functions estimated relative risk with at least reasonable accuracy, but overestimated absolute risk.
It is not clear whether the Framingham risk function estimates absolute CHD risk accurately in northern European populations, such as those of the UK, Scandinavia, or Germany. In limited analyses the Framingham function predicted absolute CHD risk accurately on average in German men in the prospective cardiovascular Münster (PROCAM) cohort,20 and in UK men from the West of Scotland coronary prevention study (WOSCOPS).21 However the Framingham function overestimated the risk of CHD and stroke for a Swedish population,22 although the degree of overestimation was less marked in subjects at relatively high CVD risk. In the Seven Countries study19 a North American risk function estimated the absolute CHD death rate in northern European subjects accurately. The important issue is whether the Framingham risk function predicts absolute CHD risk with acceptable accuracy in individual subjects in northern European populations. If it does not then guidelines that use the Framingham function to target lipid lowering drug therapy in European1 or UK3-5 subjects will not be soundly based.
In this study we have examined the convergent validity of the Framingham risk function for predicting absolute CHD risk in northern European men. To do this we compared, in individual subjects at high risk, CHD event estimates by the Framingham functionv estimates from risk functions derived from a German population (the PROCAM risk function)23 and two UK populations, the Dundee24 and British regional heart study (BRHS)25 risk functions. Comparison of risk estimates by the Framingham function for northern European women was not possible, because to our knowledge no risk function for women derived from a European population has been published.
Methods
PROTOCOL
The data required to calculate the probability of sustaining a coronary event by the Framingham,10 PROCAM,23Dundee,24 and BRHS25 risk functions were collected prospectively for 206 hypertensive men. Some details of the populations from which these risk functions were derived, and the risk factors included in each risk function, are summarised in table 1. The hypertensive men were consecutive patients recruited to a hypertension intervention trial or referred to the Sheffield Hypertension Clinic who were aged 35–75 years. This age range was set to conform with that in the Framingham population. Women were not included in the study because only Framingham of the four risk functions can predict coronary risk in women. The hypertensive men all had a full history, physical examination, and the standardised data collection and investigations detailed below. This study was concerned with predicting coronary risk only for primary prevention of CHD, and men with a history of angina, myocardial infarction, intermittent claudication, previous stroke, or other symptomatic atherosclerotic vascular disease were excluded, as were those with evidence of myocardial infarction on ECG. The patients studied all had treated hypertension, and drug treatment was not altered, so the blood pressure measurements used to calculate risk were measured while taking treatment.
Comparison of the populations from which the four risk functions are derived, and the variables used in each risk function
MEASUREMENTS.
Age, smoking habit, and family history were recorded by structured questioning in accordance with the criteria used by each of the risk functions. Blood pressure was the mean of two measurements at one visit after subjects had been seated for five minutes. All patients had an ECG, and left ventricular hypertrophy was diagnosed by the criteria used in the Framingham study—that is, increased R wave potential, depressed S-T segment, and flattened or inverted T waves in the left precordial leads. Serum total cholesterol, high density lipoprotein (HDL) cholesterol, and glucose were measured fasting. Total cholesterol was measured enzymatically using Olympus kits and calibrators. HDL cholesterol was measured in the supernatant after precipitation of lipoprotein containing apolipoprotein B with dextran sulphate and magnesium chloride solution. Diabetes was defined by a fasting blood sugar > 7.8 mmol/l, or current prescription of an oral hypoglycaemic drug or insulin.
STATISTICAL METHODS.
For each patient the estimated risk of CHD events was calculated by each risk function, using all the variables required for that function (table 1), and expressed as per cent per year. The definitions of CHD events are those used in the risk functions, and these differ between Framingham and the other risk functions. The Framingham risk function predicts fatal and non-fatal myocardial infarction plus incident angina and coronary insufficiency. The other three risk functions predict CHD death and non-fatal myocardial infarction only. The estimates of CHD event risk for the four risk functions were compared in three ways. The mean coronary risk of the 206 men was compared for each pair of risk functions by Student’st test for paired observations. Estimates for each pair of risk functions were plotted on scattergrams. The correlation coefficients and the slopes and intercepts of the regression lines, with the 95% confidence intervals (CIs), were calculated. Agreement between pairs of risk estimates was examined by the method of Bland and Altman.26
Results
STUDY POPULATION
The 206 men had a mean (SD) age of 59 (9.3) years, mean blood pressure on treatment of 154/91 (18/10) mm Hg, mean cholesterol concentration of 6.0 (1.1) mmol/l, and HDL cholesterol of 1.1 (0.3) mmol/l. Thirty seven of the 206 hypertensive men were current smokers, 66 had a history of parental death from CHD, 23 had diabetes, and four had left ventricular hypertrophy by ECG criteria.
COMPARISON OF RISK ESTIMATES
Framingham v PROCAM (fig 1)
The mean risk of CHD events calculated by the Framingham function was 2.3% per year, and by the PROCAM function 2.3% per year, with a mean difference of 0 (95% CI −0.3 to 0.3). There was a moderate correlation between CHD risk estimates by the two methods (r = 0.82, p < 0.0001, fig 1A). The deviation of the regression line from the line of identity was significant as regards the slope (1.31, 95% CI 1.19 to 1.44) and intercept (−0.76, 95% CI −1.08 to −0.43). Compared to Framingham, the PROCAM function overestimated CHD risk above 2.4% per year, and underestimated risk slightly at lower risk levels. The Bland-Altman plot (fig 1B) showed agreement between the methods on average, but with a systematic difference.

Individual risk estimates by the Framingham function v the PROCAM function. (A) Dashed line = line of identity; solid line = regression line. (B) Bland-Altman plot.
Framingham v Dundee (fig 2)
The mean CHD event risk by the Framingham function was 2.3% per year, and by the Dundee function 2.2% per year, with the difference between the risk functions approaching significance (mean difference 0.1%, 95% CI −0.1 to 0.4, p = 0.06). There was a weak but significant correlation between estimates by the two methods (r = 0.68, p < 0.0001, fig 2A). Deviation of the regression line from the line of identity was significant as regards the slope (0.80, 95% CI 0.68 to 0.92) and intercept (0.33, 95% CI 0.02 to 0.64). Compared to Framingham, the Dundee function tended to underestimate risk slightly above a CHD event risk of 2% per year, and overestimate risk at lower CHD risk levels. The Bland-Altman plot (fig 2B) showed agreement on average, no evidence of a systematic bias, but a heteroscedastic pattern with larger variability at higher CHD risk levels producing a characteristic cone shaped distribution.
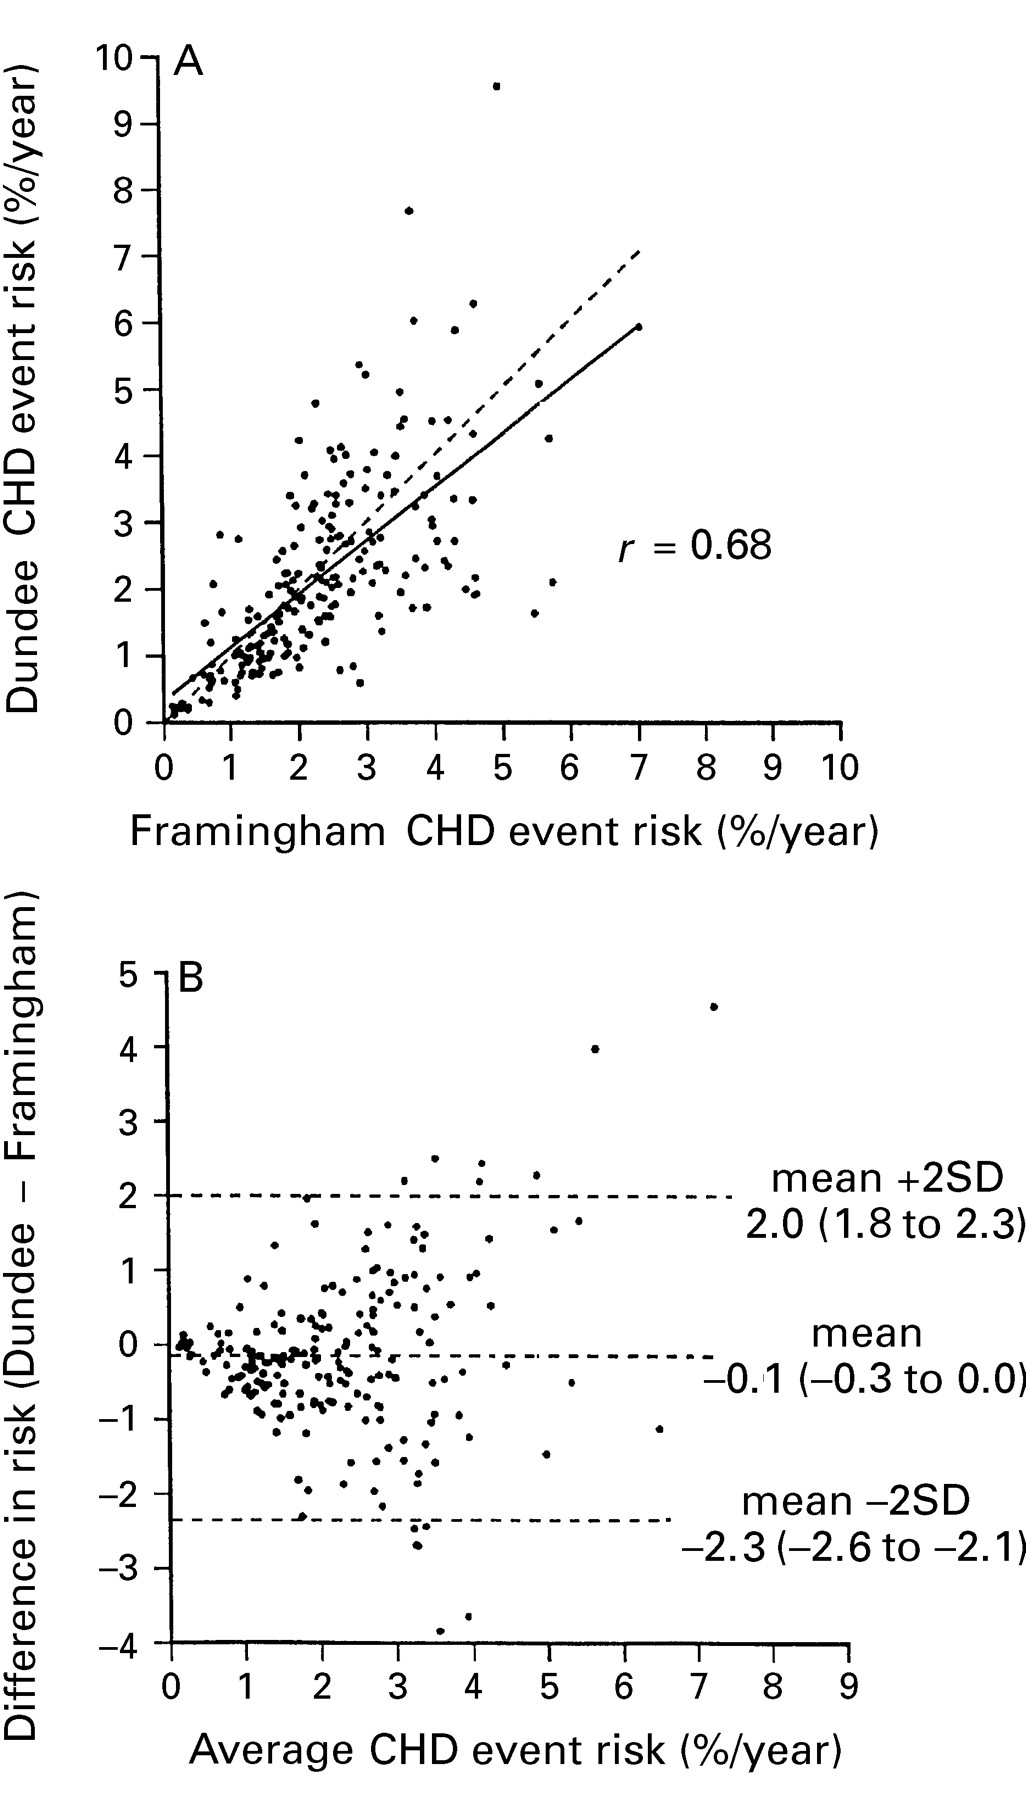
Individual risk estimates by the Framingham function v the Dundee function. (A) Dashed line = line of identity; solid line = regression line. (B) Bland-Altman plot.
Framingham v BRHS (fig 3)
Estimates of CHD event risk by the BRHS function, 0.6% per year, were much lower than those by Framingham, 2.3% per year, and the difference was large and highly significant (mean difference 1.7%, 95% CI 1.5 to 1.9, p < 0.0001). The correlation between the methods was weak (r = 0.55, p < 0.0001, fig 3A). The Bland-Altman plot confirmed the large difference between the methods on average, and the systematic difference (fig3B).

Individual risk estimates by the Framingham function v the BHRS function. (A) Dashed line = line of identity; solid line = regression line. (B) Bland-Altman plot.
Dundee v PROCAM (fig 4)
The mean CHD event risks by the Dundee and PROCAM functions were 2.2% and 2.3% per year respectively, with a mean difference of 0.1% (95% CI −0.2 to 0.5, p = 0.25). The correlation between the methods was r = 0.66, p < 0.0001 (fig 4A) and the regression line did not differ significantly from the line of identity as regards the slope (0.90, 95% CI 0.76 to 1.04) or intercept (0.33, 95% CI −0.04 to 0.70). The Bland-Altman plot (fig 4B) showed agreement on average, no systematic error, but a heteroscedastic distribution.

Individual risk estimates by the Dundee function v the PROCAM function. (A) Dashed line = line of identity; solid line = regression line. (B) Bland-Altman plot.
BRHS v PROCAM and Dundee
Estimates of CHD events risk by the BRHS function (0.6% per year) were highly significantly lower than those by PROCAM (2.3% per year) or Dundee (2.2% per year, each p < 0.0001). The scattergrams and Bland-Altman plots (not shown) confirmed the large average differences and systematics errors. Despite this there were moderate correlations of BRHS estimates with those by PROCAM (r = 0.60, p < 0.0001) and Dundee (r = 0.72, p < 0.0001).
ESTIMATING CHD EVENT RISK IN INDIVIDUALS
We have suggested elsewhere that statin treatment for primary prevention of CHD might be targeted at a specified level of CHD risk, and a level of 3.0% has been suggested as appropriate in Britain.4 Accepting that there will be some error in CHD risk estimation, one would wish that those targeted for statin treatment would have a CHD event rate of at least 1.5% per year, the lower “boundary” for proven clinical efficacy derived from the WOSCOPS trial.27 We determined which of the 206 men had a CHD event risk of 3.0% per year or higher by the Framingham function and would be selectively targeted, and those who would not because their estimated CHD risk was lower. We then examined their CHD event risk calculated by the Dundee and PROCAM risk functions (fig 5). Targeting by Framingham defined groups with a mean risk by the Dundee function of 3.4% per year (targeted) and 1.7% per year (not targeted), and by the PROCAM function of 4.6% per year (targeted) and 1.5% per year (not targeted). Inspection of the distributions (fig 5) shows that men targeted by the Framingham method all had a CHD event risk of 1.5% per year or higher when calculated by the PROCAM risk function, as did all but one patient when risk was calculated by the Dundee risk function. However, a proportion of patients with risk below 3.0% per year by Framingham, and not targeted, had risks of 3.0% per year or higher by the Dundee or PROCAM functions. The specificity of the Framingham function, defined as the percentage of those with a CHD risk estimated by each European function to be 1.5% per year or lower not targeted by Framingham at a threshold of 3.0% per year, was 98%v risk by Dundee and 100%v risk by PROCAM. The sensitivity of Framingham, defined as the proportion of those with CHD event rate 3.0% or higher by Dundee and PROCAM targeted by Framingham, was 50%v the Dundee function, and 84%v PROCAM.

Distribution of risk estimates by the Dundee and PROCAM risk functions in individuals identified as having coronary risks above or below 3% per year by the Framingham risk function. Numbers are the mean risks estimated by the Dundee or PROCAM functions in each group.
Discussion
There is already ample evidence that the Framingham risk function predicts relative risk of CHD with reasonable accuracy in diverse populations. Knowledge of the relative risk may be considered adequate when prioritising people for non-pharmacological measures to lower CHD risk. However, lipid lowering drug therapy is best targeted at absolute CHD risk28 because of its potential for adverse effects, the cost of treatment, and above all because we do not yet know whether the benefit from treatment exceeds any risk when the absolute CHD event risk is below 1.5% per year.27 Knowledge of the absolute CHD risk is also needed to estimate the number needed to treat (NNT), a simple measure of absolute benefit from treatment,29 to evaluate the cost effectiveness of treatment30 ,31; and to assess the population implications of treatment policies based on random control trial evidence.28 Ordinary doctors cannot estimate absolute CHD risk accurately by intuitive methods,32 and simple but accurate aids to risk assessment are needed for ordinary practice.28 Several of these have been developed, all of them based on the Framingham risk function.1-5 If these aids to risk assessment are to be used in practice in northern European countries, it is essential that the validity of the Framingham risk function is established for these populations.
A major unexpected finding in this study was that the BRHS risk function underestimated CHD event risk by a factor of four when compared to all the other functions. Only two UK functions (BRHS and Dundee) were examined, and it might be argued that the BRHS estimates are accurate and those by the Dundee function incorrect. However, there is strong evidence against this. The Dundee function was derived from one UK population, in the UK heart disease prevention project,33 and its external validity was confirmed by prediction of CHD death in another UK population, from the Whitehall study.34 The BRHS risk function was validated only internally.25 Other investigators have reported inexplicably low estimates of absolute CHD risk by the BRHS function.35 It has recently been shown that the Framingham risk function estimates the absolute risk of UK men accurately, on average.21 Finally, the BRHS risk estimates were considerably out of line with all three of the other risk functions examined in the present study. The reason for the fourfold underestimate of risk by the BRHS function is unknown at present. However, the error seems to be systematic as shown by the reasonable correlation of BRHS with the Dundee function (r = 0.71), a function which, like the BRHS, does not include HDL cholesterol.
There are many similarities between the BRHS and Dundee populations (for example, in age, duration of follow up, and definition of end point) (table 1). One major difference is that the BRHS function was designed to include men who already have coronary artery disease, and this may in some way prejudice its use for predicting risk for primary prevention. Other differences between the risk functions include the definitions for smoking habit and blood pressure. In addition, the rate of coronary events in the Dundee function population (1.3% per year) was higher than that in the BRHS population (population 0.7%). The reasons for the discrepant findings with the BRHS function are not clear, but it certainly cannot be used in its present form to estimate absolute CHD risk for primary prevention. It does remain valid for estimating relative risk, which was its original purpose.25
Setting aside the BRHS function for the reasons detailed above, the Framingham function estimated CHD event risk accurately on average when compared to the Dundee and PROCAM functions. One might have anticipated some overestimation of risk by Framingham on two grounds. Firstly, the Framingham function includes prediction of additional CHD end points, namely incident angina and coronary insufficiency, that are not predicted by the other two functions. Secondly, Framingham is the “oldest” risk function, with its inception in 1958, and there has been a secular trend for CHD rates to decline. To the extent that this decline is independent of any reduction in the CHD risk factors included in the risk functions, there might be overestimation of CHD risk in later years. In the event, there was no evidence that this is the case in our study. In agreement is a report that the Framingham risk function predicted average CHD risk accurately in a recently studied cohort of UK men.21
Considering in detail the relations of Framingham to the PROCAM and Dundee risk functions, the correlations were moderately high. The strongest correlation was with PROCAM. Framingham and PROCAM functions both include HDL cholesterol, which has considerable importance for predicting CHD risk. There were systematic differences between Framingham and the other two functions, as shown by significant differences for the slope and intercept, but these were small in magnitude. At higher levels of CHD event risk PROCAM tended to overestimate and Dundee to underestimate risk slightly when compared to Framingham. In both comparisons there was a heteroscedastic distribution, indicating that error was larger at higher CHD event rates.
The question arises whether these random and systematic errors are sufficiently important to invalidate the use of the Framingham function for CHD risk prediction in the UK or German populations. The analysis shown in fig 5 suggests that they are not. When Framingham was used to target those with a specified level of absolute CHD event risk—for example 3.0% per year, it separated widely groups at high and low average risk as determined by the other two risk functions. When compared to PROCAM, the other risk function which uses HDL cholesterol, the accuracy of targeting was very acceptable. All of those targeted by Framingham had a CHD risk of 1.5% per year or higher by PROCAM, and at this level of CHD risk lipid lowering treatment is readily justifiable.27 Targeting was conservative as judged by PROCAM estimates of risk, with a minority of those who had a CHD event risk of 3.0% per year or higher left untargeted. However, there is no “gold standard” in this form of validation. One can conclude only that there was satisfactory agreement between the two methods, and one cannot determine which of the risk functions was “correct”.
Prediction of absolute CHD risk will inevitably have some error. However, targeting using this form of risk function is significantly more accurate than simply counting risk factors,8 ,10which in turn is much more accurate than targeting a predetermined cholesterol or lipid fraction threshold.8 This study suggests that the Framingham function is acceptably accurate for predicting absolute CHD risk in British hypertensive men and this can probably be extended to all British and German men, but not to populations with different rates of CHD.17-19 Simplified methods to aid risk estimation based on the Framingham function1-5 should also be acceptably accurate for northern European populations.