Article Text

Abstract
OBJECTIVE To investigate the relation between transaortic pressure difference and flow in patients with aortic stenosis.
METHODS 50 asymptomatic patients with all grades of aortic stenosis were studied using dobutamine stress echocardiography. Individual plots of mean pressure drop against flow were drawn. Comparisons were made between grades of aortic stenosis as defined by the continuity equation.
RESULTS A significant linear relation between pressure difference and flow was found in 34 patients (68%). There was a significant curvilinear relation in four (8%), while no significant regression line could be fitted in 12 (24%). In the 34 patients with linear fits, the slopes (mean (SD)) were 0.08 (0.07) in mild, 0.10 (0.04) in moderate, and 0.22 (0.16) in severe aortic stenosis (p = 0.0055).
CONCLUSIONS Transaortic pressure difference can be related directly to flow in many patients with all grades of aortic stenosis. However, there are individual differences in slope and intercept suggesting that resistance calculated at rest may not always be representative. Raw pressure drop/flow plots may be an alternative method of describing valve function.
- aortic stenosis
- continuity equation
- resistance
- Doppler echocardiography
Statistics from Altmetric.com
Aortic valve thickening is part of the normal aging process. As many as 2.9% of people aged 75 years and over have severe stenosis.1The grading of stenosis is important as a criterion for surgery, but also to decide whether angiotensin converting enzyme (ACE) inhibitors and other arterial dilators are contraindicated. Traditionally cardiologists have been used to grading by pressure drop (loosely “gradient”). However, pressure drop is dependent on flow and may be misleading at either high or low cardiac outputs. For example, a pressure drop of 30 mm Hg can occur in mild aortic stenosis with high cardiac output as a result of anaemia or anxiety or in severe aortic stenosis with a low cardiac output as a result of left ventricular failure. Therefore methods of flow correction are an integral part of clinical practice. However, the methods in common use—the Gorlin formula and aortic valve resistance2 ,3—rely on haemodynamic assumptions about the relation between flow and pressure drop which have not been studied systematically in the clinical situation.
We therefore investigated the effect of flow on pressure drop in patients with aortic stenosis categorised using the continuity equation as an independent standard.
Methods
PATIENTS
Between 1 April 1996 and 30 November 1997, 57 consecutive patients with the following inclusion criteria were screened:
Aortic valve thickening with a peak instantaneous velocity ⩾ 2.5 m/s on continuous wave Doppler
Normal left ventricular systolic function
No cardiac symptoms.
Exclusions were for coexistent mitral valve disease (1), more than mild aortic regurgitation (5), and atrial fibrillation or other arrhythmia (1). There remained 50 patients with a median age 68 years (range 28 to 85 years), of whom 32 (64%) were male and 18 (36%) female.
Approval was obtained from the local committee on ethical practice and patients gave written informed consent.
STUDY
Echocardiography was performed with an ATL HDI 3000 instrument (ATL Inc, Seattle, Washington, USA). A full study was performed at baseline to exclude valve disease other than aortic stenosis or other clinically significant abnormalities, and to assess left and right ventricular function. M mode dimensions were measured according to the recommendations of the American Society of Echocardiography.4 All patients had normal left ventricular systolic function as defined by absent regional wall motion abnormalities, an ejection fraction > 60% assessed by eye, and fractional shortening > 28%. The left ventricular outflow tract diameter was measured from inner to inner edge at the level of the base of the aortic cusps on a parasternal long axis frame frozen in systole. Pulsed Doppler recordings were made in the five chamber view with a 4 mm sample size. The mean of three planimetered signals was used to obtain peak subaortic velocity, velocity integral, and estimated mean pressure drop using the online software. Continuous wave signals were obtained using a standalone probe from the apex and right intercostal position. Optimal continuous wave signals were obtained from the apex in 44 patients (88%) and parasternally in the right lateral position in six (12%).
The means of three continuous wave recordings were planimetered to give peak velocity, mean pressure drop, velocity integral, and ejection time. Intraobserver variability was 4.0% for peak transaortic velocity, 5.9% for aortic velocity time integral, 6.1% for subaortic velocity time integral, 10.7% for mean pressure drop, and 1.6% for left ventricular outflow tract diameter.
A 12 lead ECG was attached with modification of the position of leads as necessary to accommodate the echocardiographic “window.” A blood pressure cuff was attached to the arm opposite that cannulated for intravenous infusion. A dobutamine infusion was then started at a dose of 5 μg/kg/min and increased after five minutes to 10 μg/kg/min and thereafter by 10 μg/kg/min every five minutes to a maximum of 40 μg/kg/min. The infusion was stopped prematurely for arrhythmia (one patient), a sustained fall in blood pressure (five patients), significant symptoms (13 patients), or the development of aliasing in the left ventricular outflow tract (13 patients). The maximum attainable dose was 10 μg/kg/min in one subject, 20 μg/kg/min in 14 (28%), 30 μg/kg/min in 23 (46%), and 40 μg/kg/min in 12 (24%). Continuous monitoring was performed by echocardiography from the parasternal long axis position and by 12 lead ECG. At the end of each increment of dobutamine, blood pressure, a 12 lead ECG, and pulsed and continuous wave Doppler were recorded.
CALCULATIONS
Mean pressure drop was calculated by subtracting mean subaortic from mean transaortic pressure drop obtained using the online software. Peak pressure difference (ΔP) was calculated using the long form of the modified Bernoulli equation: Equation 1where ΔP is in mm Hg, v2 is peak aortic velocity in m/s, and v1 is subaortic velocity in m/s.
Effective orifice area (EOA in cm2) was calculated using the continuity equation5: Equation 2where vti1 is the subaortic and vti2 the aortic velocity time integral in cm. CSA is the cross sectional area (cm2) of the left ventricular outflow tract calculated from the diameter (d in cm), assuming circular geometry:
 Equation 3Stroke volume (SV in ml) was calculated from the formula:
 Equation 4Cardiac output was calculated as the product of stroke volume and heart rate and flow (Q in ml/s) was calculated from the formula:
 Equation 5where EJT is systolic ejection time in ms.
ANALYSIS
Results were expressed as mean (SD). Transaortic pressure drop was plotted against flow in individual patients. There were six data points in four patients, five data points in 20, four data points in 20, and three data points in six. It was possible to plot a significant linear correlation in 34 patients, while in four a curvilinear fit alone was significant and in 12 the scatter was too great. The following arbitrary but frequently applied criteria were used to grade aortic stenosis: severe < 0.75 cm2, moderate 0.75–1.0 cm2, and mild > 1.0 cm2. The means of individual pressure drop/flow slopes in the 34 patients with linear fits were compared by grade of aortic stenosis using one way analysis of variance (anova) and Tukey’s honestly significant difference test. Peak stress was defined by the maximum attainable dose of dobutamine. Statistical analysis was performed using the SPSS package, version 6.0.1 for windows.
Results
GENERAL
The peak transaortic velocity at rest ranged from 2.5 m/s to 4.9 m/s (mean 3.6 (0.71) m/s). The mean pressure difference at rest ranged from 10 to 60 mm Hg (mean 31 (13.6) mm Hg). In 18 cases the aortic stenosis was mild, in 19 it was moderate, and in 13 severe as defined by the continuity equation. Haemodynamic variables within these groups are given in table 1. During dobutamine infusion there was no significant change in systolic blood pressure from 140 (28) mm Hg at baseline to 137 (22) mm Hg at peak. There was a fall in diastolic blood pressure from 81 (9) mm Hg to 75 (11) mm Hg (p = 0.003), a mean decrease of 5.9 (12.9) mm Hg.
Resting values
Flow increased from 252 (60) ml/s at rest to 432 (120) ml/s at peak (p < 0.0001). There was an increase in cardiac output from 5.2 (1.4) l/min at rest to 9.9 (3.5) l/min at peak (p < 0.0001), with an increase in stroke volume from 75 (16) to 97 (25) ml (p < 0.0001) and heart rate from 72 (12) to 110 (25) beats/min (p < 0.0001). The individual percentage increase in flow ranged from 14.4% to 204%, mean 76.6 (43.2)%.
PRESSURE DIFFERENCE AGAINST FLOW
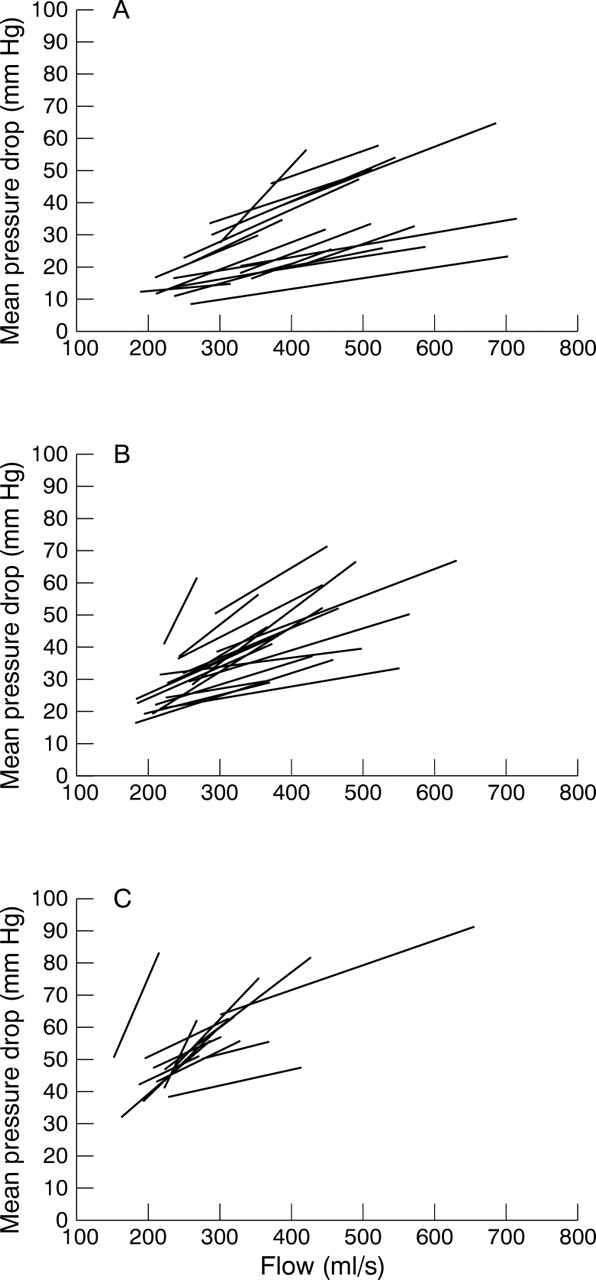
The patients with linear fits were evenly distributed among those with mild (14), moderate (11), and severe (9) stenosis (fig 1). The slopes of the pressure drop/flow relation were higher in severe than in moderate or mild aortic stenosis. The slopes were 0.08 (0.07) mm Hg/(ml.s−1) in patients with mild stenosis, 0.10 (0.04) mm Hg/(ml.s−1) in those with moderate and 0.22 (0.16) mm Hg/(ml.s−1) in those with severe stenosis (p = 0.0055 by anova). However, there was considerable variability in individual pressure drop/flow slopes within each group (fig 2).
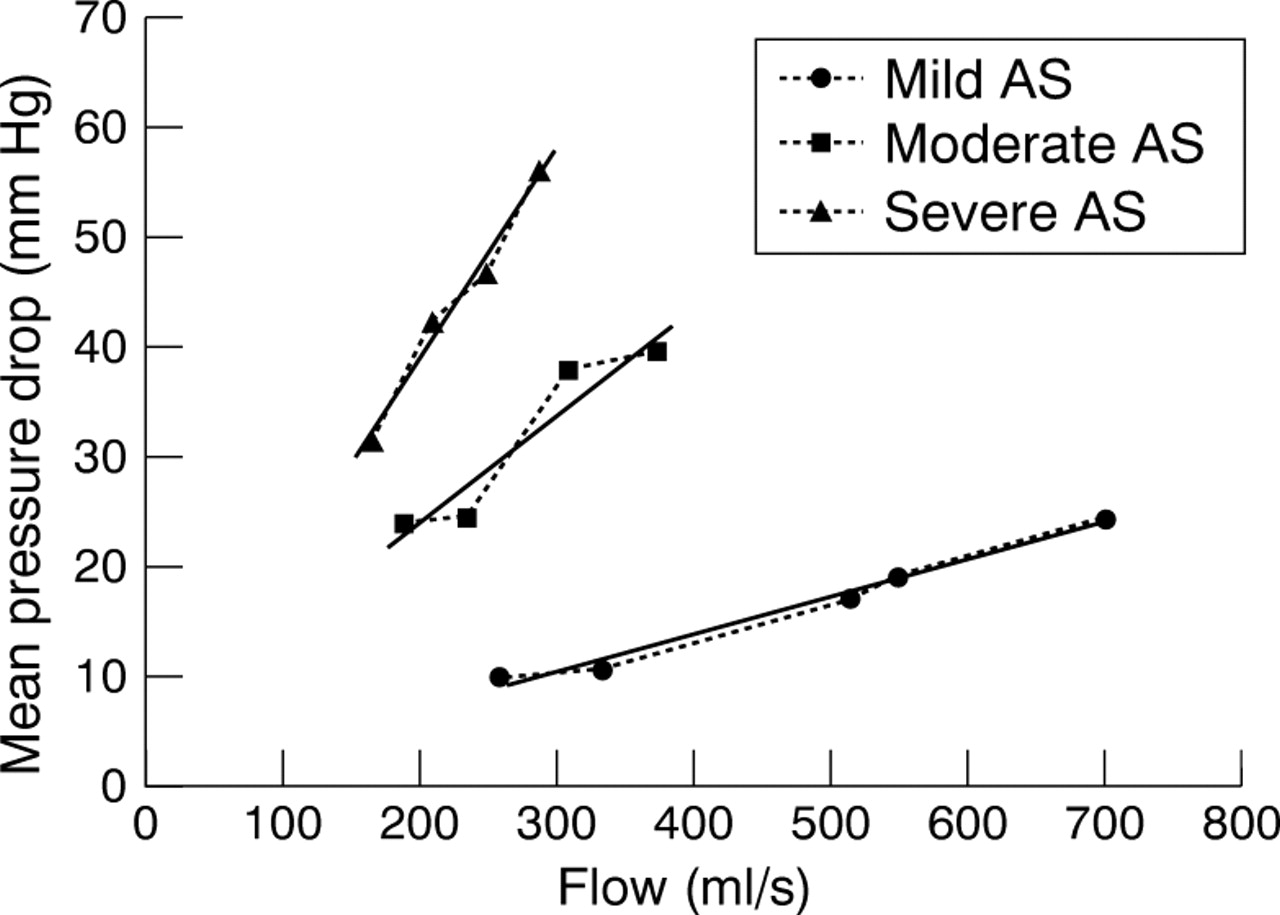
Pressure drop/flow slopes in patients with mild, moderate, and severe aortic stenosis.

Individual pressure drop/flow slopes in all patients with mild (A), moderate (B), and severe (C) aortic stenosis.
Discussion
As the left ventricle pumps blood across a stenosed aortic valve, the velocity of flow increases and this is accompanied by a fall in static pressure. For the same grade of stenosis, this pressure drop increases if the cardiac output rises, and decreases if it falls. A pressure drop cannot therefore be interpreted adequately without knowledge of the cardiac output at which it is recorded. In many cases this may not matter. If a patient has unambiguous symptoms, normal left ventricular function, and a high pressure drop across the aortic valve then the diagnosis of severe aortic stenosis justifying surgery is secure. If, however, the pressure drop is only moderate but the patient has an impaired left ventricle or equivocal symptoms, decisions about management are less easy. In these situations, the use of flow correction formulae may be important.
The Gorlin formula has been the traditional method for invasive assessment of stenosis based on a solution of the equation for mass flow using velocity derived from a modification of the Bernoulli theorem.2 It has the advantage of being expressed as an orifice area, which is readily comprehensible by clinicians. It assumes steady turbulent flow through a fixed diaphragmatic orifice with flow related to the second power of pressure drop. In contrast, resistance assumes steady laminar flow through a tube with flow related directly to pressure drop. Resistance has the advantage over the Gorlin formula of not requiring an arbitrary correction factor and it can also be used to derive several other useful variables such as workload.3 Initially it was thought that resistance was incompletely independent of flow6 so the Gorlin formula was adopted as the clinical standard. In fact the arbitrary Gorlin constant is itself dependent on flow7 and there has been a recent revival of interest in resistance, which has been shown to be clinically useful in the assessment of aortic stenosis.2 ,8-11
Our study supports a linear relation between pressure drop and flow in the majority of patients, 34 of 38 (89%), for whom a significant regression could be plotted. This is one assumption underlying the clinical application of the concept of resistance. Other assumptions implicit in the concept are a uniform slope and an intercept of zero. In fact we showed that pressure drop/flow slopes varied between individual patients within each grade of aortic stenosis. Although the intercepts were close to zero for mild and moderate stenosis, there was an offset in severe stenosis (fig 2). Thus resistance calculated at rest may not be representative of the usual haemodynamic state of the circulation as the patient moves around during an active day. In patients on the borderline of arbitrary grades of aortic stenosis, or in whom there is clinical doubt, it may be useful to plot pressure drop/flow slopes directly using dobutamine stress to avoid unwarranted haemodynamic assumptions. It is also important to investigate whether pressure drop/flow slopes are related to some independent biological measures such as exercise ability or left ventricular mass or whether they are of use in stratifying the risk of progression to valve replacement or the development of left ventricular dysfunction. Work is in progress towards testing these associations.
PREVIOUS WORK
Virtually all work investigating the relation between pressure drop and flow has been in artificial models of the heart, where a parabolic relation is shown.12-14 However, although artificial models are useful for controlling hydrodynamic conditions to compare different replacement heart valves, they cannot be assumed to mimic the real heart. The internal geometry and mechanical properties are unphysiological. The pump is often flow regulated while in the real heart there is a complicated mixture of pressure and flow regulation. Previous animal and human work reports pressure difference at only two points, before and after stress.15-17 It does not allow a more precise investigation of the relation between pressure difference and flow, as was possible in the present study in which a significant curvilinear relation was shown in only four patients.
LIMITATIONS
We were able to construct a significant regression line in only 38 of 50 patients (76%), partly as a result of a small number of data points; only 24 patients had five or more data points. These patients, however, were distributed evenly among the grades of aortic stenosis and the differences in the slopes obtained are similar to those shown in vitro and are likely to reflect clinical reality. We categorised our patients using the continuity equation, which cannot be regarded as a gold standard. However, it is a method widely used in routine clinical practice. Unlike resistance, it is based on the law of conservation of mass rather than the relation between pressure drop and flow and so represents, to some extent, an independent standard.
CONCLUSIONS
This study shows that, in patients with all grades of aortic stenosis, pressure drop can usually be related directly to flow. This relation validates one assumption underlying the use of resistance in the clinical situation, although there was variability in the slopes and intercepts of the relation between pressure drop and flow among individual patients within each grade of aortic stenosis. It is therefore possible that the pressure drop/flow slope may provide an alternative method of describing valve function. Further prospective testing is necessary to validate this measure against biological end points.
Acknowledgments
We thank Nigel Smeeton for statistical advice.