Article Text

Abstract
Background: Up to 30% of patients with heart failure do not respond to cardiac resynchronisation therapy (CRT). This may reflect placement of the coronary sinus lead in regions of slow conduction despite optimal positioning on current criteria.
Objectives: To characterise the effect of CRT on left ventricular activation using non-contact mapping and to examine the electrophysiological factors influencing optimal left ventricular lead placement.
Methods and results: 10 patients implanted with biventricular pacemakers were studied. In six, the coronary sinus lead was found to be positioned in a region of slow conduction with an average conduction velocity of 0.4 m/s, v 1.8 m/s in normal regions (p < 0.02). Biventricular pacing with the left ventricle paced 32 ms before the right induced the optimal mean velocity time integral and timing for fusion of depolarisation wavefronts from the right and left ventricular pacing sites. Pacing outside regions of slow conduction decreased left ventricular activation time and increased cardiac output and dP/dtmax significantly.
Conclusions: In patients undergoing CRT for heart failure, non-contact mapping can identify regions of slow conduction. Significant haemodynamic improvements can occur when the site of left ventricular pacing is outside these slow conduction areas. Failure of CRT to produce clinical benefits may reflect left ventricular lead placement in regions of slow conduction which can be overcome by pacing in more normally activating regions.
- cardiac resynchronisation
- heart failure
- mapping
Statistics from Altmetric.com
Congestive heart failure is a major and increasing public health problem with a 22.5 million global prevalence. It accounts for 200 000 deaths a year in the USA alone.1 Despite recent advances in pharmacotherapy, the prognosis of patients with congestive heart failure remains poor. Between 30−50% of patients have an intraventricular conduction delay (principally left bundle branch block (LBBB)) which impairs systolic function and mechanical efficiency and leads to a worse clinical outcome.2–4 Cardiac resynchronisation therapy (CRT) with biventricular pacing is based upon the premise that stimulating late activating regions of the left ventricle normalises or optimises left ventricular synchrony.5,6 Biventricular and left ventricular free wall pacing induces significant acute haemodynamic benefits including more mechanically efficient systolic function.7–10 Three recent controlled clinical trials report medium term improvements in exercise tolerance and symptom status in patients with class III and IV heart failure.11–13
The optimal site of left ventricular lead placement is theoretically the region of latest intrinsic activation. In clinical practice, the left ventricular lead is placed in the coronary sinus at a maximal distance from the right ventricular apical lead in a site producing the narrowest QRS width during biventricular pacing—commonly the posterolateral or lateral left ventricular wall. Coronary venous system anatomy and problems of lead placement mean that this optimal position is not always achieved. Furthermore, the degree of QRS width reduction is not a consistent indicator of optimal resynchronisation and haemodynamic improvement.14 Haemodynamic indices or symptoms fail to improve in up to 30% of patients following CRT, suggesting that current criteria for determining left ventricular lead position may be inadequate.9,10,15 Most patients with heart failure have ischaemic heart disease and thus have inhomogeneous patterns of left ventricular activation owing to the presence of electromechanically non-functional myocardium. Although echocardiography is valuable in determining potentially optimal pacing sites, such regions may still cause inhomogeneous activation during pacing.
Non-contact mapping techniques have made it possible to determine the global pattern of left ventricular electrical activation and to define regions with severely delayed activation and slow electrical conduction. These may be suboptimally responsive to a pacing stimulus. We hypothesised that a failure to respond to CRT results from coronary sinus lead pacing stimuli being delivered to a region of slow conduction in the “optimal” left ventricular site. Guiding the left ventricular lead to sites of normal activation in certain patients could produce more synchronous ventricular depolarisation with shorter left ventricular activation times and improved haemodynamics. Thus in this study we employed non-contact left ventricular endocardial mapping with the following aims: first, to characterise the pattern of left ventricular endocardial activation during sinus rhythm and biventricular pacing in patients with ischaemic and idiopathic dilated cardiomyopathy, and to identify regions of slow conduction; second, to establish the position of the coronary sinus left ventricular lead tip in relation to regions of slow conduction; third, to compare the haemodynamic effects of left ventricular free wall pacing within regions of slow conduction to normally depolarising myocardium; and finally, to examine the effect of varying pacing modes and relative left ventricular–right ventricular timing upon left ventricular activation and haemodynamics.
METHODS
The protocol was approved by the St Thomas’ Hospital local research ethics committee. Written informed consent was obtained from each subject.
Patients
Ten patients with New York Heart Association (NYHA) class II–IV heart failure were enrolled. All were on a stable drug treatment regimen one month before study entry and met the following inclusion criteria:
-
left ventricular ejection fraction < 35%
-
left ventricular end diastolic diameter > 55 mm
-
QRS width of > 130 ms or > 180 ms in paced patients
-
sinus rhythm on resting ECG.
Exclusion criteria included: indications for implantable cardiac defibrillator, chronic atrial tachyarrhythmias, mechanical right heart valve, expected survival less than three months, aortic stenosis, and contraindications to anticoagulation. Chronic heart failure drugs (diuretics, angiotansin converting enzyme inhibitors, β blockers) were maintained for the duration of the study.
Baseline assessment seven days before biventricular implant consisted of a six minute walk test, a transthoracic echocardiogram (TTE) (Vingmed System 5, GE Vingmed Ultrasound, California, USA), and the short form 36 item (SF36) questionnaire. TTE was repeated within seven days after implantation to examine the effects of different pacing modes and relative left ventricular–right ventricular timings on the velocity–time integral (VTI). The echocardiographer was blinded to these. The mean of five VTI envelopes was taken for each reading. All baseline variables were repeated three months after implantation.
Standard techniques were used for the implantation of biventricular pacemakers. All patients received an Insync 8042 biventricular system. The right ventricular lead was positioned in the apex and the left ventricular lead tip in a coronary vein at a maximal distance apart from the right ventricle lead tip on fluoroscopy, to generate the narrowest QRS width on pacing. After 5–14 days patients underwent detailed non-contact left ventricular endocardial electrical mapping and a haemodynamic assessment protocol.
Catheterisation protocol
Non-contact mapping system
The Ensite 3000 system (Endocardial Solutions Inc, St Paul, Minnesota, USA) comprises a 9 F multielectrode array (MEA) mapping catheter placed in the left ventricle to reconstruct endocardial potentials employing the inverse solution method, and uses a locator signal from a standard steerable ablation catheter to construct left ventricular chamber geometry. This was later used as a roving catheter to pace specific endocardial sites of interest. This has been validated in both the left ventricle and the right atrium.16–18
Mapping procedure
Patients were sedated with diazemuls (5–10 mg) and anticoagulated with heparin (70 U/kg) after sheath insertion to maintain the activated clotting time at 350–400 s. The Ensite catheter was passed into the left ventricle through the right femoral artery and a 5 F PiCCO catheter (KIMAL) was inserted into the left femoral artery. This was employed to measure cardiac output, arterial blood pressure, and dP/dtmax in the left common iliac artery and was calibrated by thermodilution. It is validated for the measurement of cardiac output derived from the arterial pressure waveform and has an excellent correlation with the gold standard Fick method (r2 = 0.9), avoiding problems related to repeated volume loading required by thermodilution.19–21
Endocardial maps were acquired during sinus rhythm, AAI, and DDD right and left ventricular dual chamber pacing with an atrioventricular (AV) delay of 80 ms. The patients then underwent biventricular pacing, varying the relative left ventricular to right ventricular stimulation times from initial left ventricular activation at 60, 32, 20, and 4 ms pre-right ventricle stimulation, and then initial right ventricular activation at 20, 32, and 60 ms pre-left ventricular activation.
All patients were paced at a heart rate of 90 beats/min and 80, 100, and 120 ms AV delays for serial left ventricle–right ventricle activation measurements. Atrial triggering of ventricular stimulation prevented variability in haemodynamic and electrophysiological indices caused by changes in sinus rate and allowed accurate timing of electrophysiological variables from pacing stimuli. Each pacing programme was maintained for two minutes at steady state before the acquisition of the endocardial electrical map and the haemodynamic data. Pacing in AAI/DDD mode was done intermittently during the protocol to ensure that the baseline drift in cardiac output and dP/dtmax did not exceed 5%. A change in cardiac output or dP/dtmax of more than 10% was regarded as significant.
The sinus rhythm endocardial map was analysed to identify regions of slow conduction. In patients where these were present, the activation wavefront rotated around the slow conduction zone which also failed to depolarise normally (see “Definition of regions of slow conduction” below and fig 1). The endocardial roving catheter was then steered to the position of the coronary sinus lead tip and the left ventricle paced in DDD mode (DDDLV) and biventricular mode, with the coronary sinus lead disabled (triggered by atrial sensing from a temporary pacing wire positioned in the right atrium). In patients with regions of both slow and normal conduction, the roving catheter was then steered to a site of normal wavefront propagation (and normal amplitude electrograms) in the lateral free wall and paced in DDDLV and biventricular mode at the optimal AV delay. Therefore a direct comparison was made between both DDDLV and biventricular endocardial pacing in the left ventricular slow conduction region and DDDLV and biventricular endocardial pacing in an adjacent normally activating region.

Isochronal maps comparing left ventricular activation on the anterior and posterior endocardial surfaces in (A) a patient with idiopathic dilated cardiomyopathy (DCM) without a region of slow conduction, and (B) a DCM subject with a slow conduction zone. Homogeneous activation occurs in (A), but the wavefront avoids the zone of slow conduction until the latest activation phase in (B). Times are referenced from exit of activation wavefront into the left ventricle with earliest activation shown in red and latest in blue-white in the scales on the left.
Measurement of left ventricular activation time
The virtual unipolar electrograms recorded from the endocardial surface were employed to measure the duration of left ventricular activation. Peak negative dV/dt is a universally accepted indicator of the onset of activation in a region of myocardium. Thus the onset of activation was taken as the time of the first peak negative 8 Hz high passed unipolar virtual electrogram anywhere in the chamber, initiated either by the intrinsic rhythm or a pacing induced stimulation. The end of activation was defined as time of the latest peak negative 8 Hz high passed unipolar electrogram on the virtual endocardial surface.
Electrograms were acquired at 1200 Hz allowing a precision to within 0.83 ms. Three independent observers blinded to the haemodynamic data measured the left ventricular activation time with an interobserver error of < 2%.
Definition of regions of slow conduction
The activation of the endocardium was categorised in terms of the amplitude of recorded non-contact electrograms and the path of activation. The direction of activation wavefront propagation was determined by lines of block bordering regions of low amplitude 8 Hz electrograms. The amplitude of these non-contact electrograms was employed to make an objective analysis of the maps independent of the pattern of wavefront movement, and to test the validity of the boundary between slow conduction and normal regions drawn during the clinical study. As regions of endocardial slow conduction have low amplitude electrograms, we computed the root mean squared (RMS) amplitude of the virtual electrograms in adjacent regions, a maximum of 2 cm apart. If the RMS amplitude on the slow conduction side of the boundary was less than 50% of that on the comparatively normal side, the boundary defined by the path of activation was deemed acceptable (fig 2D shows an example of electrogram on each side of boundary). Line markers were placed at this boundary on the map to demarcate regions of slow conduction. This provided an objective means of calculating the area occupied by the slow conduction zone and of precisely measuring the timing and velocity of wavefront progression inside and outside the region.

The effects of pacing inside and outside the slow conduction regions. Voltage colour scale is displayed left with maximum negative depolarisation shown in white. Orientation of the left ventricle is illustrated by the torso. Rows A and B show coronary sinus pacing in a slow conduction region. Times are referenced from the pacing stimulus. After leaving the slow conduction region (black boundary highlighted with white arrows), activation proceeds toward the apex and posterior left ventricle, concluding septally 170 ms post-pace. Row C shows left ventricular rove pacing outside the slow conduction region. Activation spreads rapidly in a more homogeneous pattern, concluding septally after 95 ms. Endocardial pacing only reduced the time to local activation by 4 ms compared with epicardial pacing. (Colour gain is set high for first three frames to view low amplitude slow moving potentials.) Row D: two non-contact electrograms beneath two ECG tracings. Electrogram 1 is from a region of slow conduction and electrogram 2 from a normal region less than 2 cm away. The RMS of slow activating waveform is less than 50% of that of electrogram 2.
Measurement of distance and average conduction velocity
The performance of the substrate inside and outside the boundaries defined above was tested by endocardial pacing under controlled conditions. Schilling’s method22 was employed to compute average conduction velocity over 2 cm distances from the pacing site under test. Briefly, the time was measured from the first peak negative virtual electrogram post-endocardial pacing in the region of interest, to the first peak negative electrogram 2 cm from this point parallel to the clearly defined direction of activation. Average velocity over this distance was calculated as distance over time.
Data analysis
Continuous haemodynamic and electrophysiological variables are expressed as mean (SEM). Statistical analysis was done with commercial software (SPSS, SigmaStat version 2) using one way repeat measures analysis of variance (ANOVA) with post-hypothesis testing of pacing site differences by the Bonferroni test. Paired and unpaired t tests were used to examine the changes in questionnaire results and exercise as appropriate. A probability value of p < 0.05 was regarded as significant.
RESULTS
The demographics of the group and location of infarct and slow conduction regions are given in table 1. Fifty per cent of the patients had documented coronary artery disease. Most patients had NYHA class III heart failure and all apart from subject 5, who had a VVI pacemaker, were in LBBB. Coronary sinus leads were positioned in the posterolateral left ventricular region. No patients were paced through the great cardiac vein.
Demographics and baseline data
There were no complications related to the mapping procedure. One patient developed a groin haematoma after sheath removal, requiring overnight observation.
Effect of cardiac resynchronisation therapy on exercise tolerance
CRT induced the greatest improvements in the six minute walk test at three months (186 (26) m to 271 (19) m; p < 0.05) in the patients with dilated cardiomyopathy (DCM). The increases in the ischaemic group were marginal (219 (40) m to 234 (52) m, NS). SF36 scores improved by 32% overall (p < 0.005), with a 70% improvement in scores for the patients with DCM (p < 0.005) v 7% for the remainder. The greatest improvements occurred in physical functioning and perception of fatigue.
Sequence of left ventricular activation
In four DCM patients, left ventricular activation was homogeneous, with the lateral and posterolateral walls being activated in the latest phase of depolarisation (fig 1A). However, in all the ischaemic patients and in one with DCM, the coronary sinus lead was positioned in an area of abnormal electrical activation. Electrograms at the coronary sinus pacing site were of low amplitude, and conduction velocity in this slow conduction region was 27% of that in lateral free wall regions with normal amplitude electrograms (mean 0.4 (0.06) m/s v 1.8 (0.4) ms, p < 0.02 (table 1)). Propagation of depolarisation through the region to the slow conduction boundary was therefore prolonged (table 2, fig 2). Electrogram amplitude was independent of distance from the MEA. Left ventricular activation was not homogeneous during sinus rhythm in these cases. The depolarisation wavefront rotated around the boundaries of this slow conduction region, which only depolarised in the final phase of left ventricular activation (fig 1B). This phenomenon did not occur in the four DCM subjects with no significant difference in conduction velocity upon pacing any region of the lateral free wall.
Prediction of wavefront coalition and fusion
The mean area of slow conduction occupied 43.5% of the left ventricular endocardium, and the mean time to exit of the depolarisation wavefront from the left ventricular site was 69.7 ms (see table 2 and fig 2).
Haemodynamic effects of univentricular and biventricular pacing in relation to regions of slow conduction
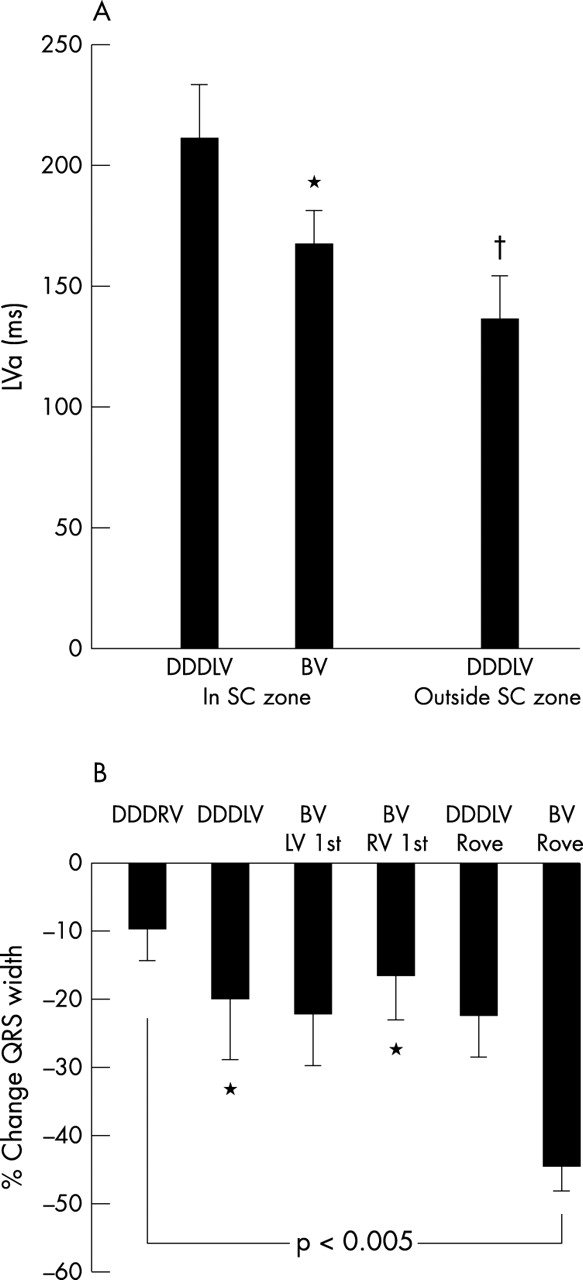
Left ventricular activation was significantly reduced by DDD left ventricular mode pacing in a normal v slow conduction region (fig 3). This was associated with a 22% rise in dP/dtmax. Endocardial pacing in the slow conduction zone with the roving catheter at the coronary sinus lead tip site produced equivalent haemodynamic responses to coronary sinus lead epicardial pacing (mean cardiac output DDDLV with coronary sinus lead = 4.91 l/min, v 4.93 l/min with endocardial pacing in DDDLV mode). We did not identify any significant differences in conduction velocity or the path of left ventricular endocardial activation with endocardial versus epicardial pacing at the coronary sinus lead site. Furthermore, there were no differences in haemodynamics between coronary sinus and endocardial pacing in the posterolateral wall for DCM patients without slow conduction zones.

(A) Time from left ventricular pacing stimulus to end of left ventricular activation for six patients paced in a region of slow conduction in DDDLV and BV (biventricular) mode and in normal myocardium with the roving catheter (p < 0.005 on repeated measures ANOVA). DDDLV, left ventricular pacing in DDD mode; DDDRV, right ventricular pacing in DDD mode. (B) Percentage changes in QRS width relative to sinus rhythm. Repeated measures ANOVA, p < 0.005, *p < 0.05 v biventricular rove.
Figure 4 illustrates the haemodynamic changes with different pacing modes employing the roving left ventricular catheter. Peak haemodynamic changes occurred with biventricular pacing in regions of normal activation causing increases in dP/dtmax and cardiac output of 26% and 15%, respectively, compared with DDDRV pacing. Biventricular pacing outside the slow conduction region in the lateral free wall produced a 13% increase in cardiac output versus biventricular pacing inside the slow conduction region, either with the coronary sinus lead or rove left ventricular catheter.

(A) Effect of map directed pacing on cardiac output at fixed optimal atrioventicular delay. Increases in cardiac output with endocardial pacing in regions of normal activation in patients where the left ventricular epicardial leads were located in regions of slow conduction (*p < 0.05 v DDDRV mode). “Rove” refers to the locator catheter pacing outside these regions of slow conduction. (B) Percentage change in dP/dtmaxv DDDRV pacing (†p < 0.01 v DDDRV mode). DDDRV, right ventricular pacing in DDD mode.
Further decreases in left ventricular activation time accompanied these acute haemodynamic changes associated with reductions in QRS width (fig 3B). However, there was no significant correlation between change in left ventricular activation time and QRS width reduction. QRS width reduction did not predict responders to biventricular pacing in this series.
Relation of left ventricular/right ventricular timing to haemodynamic variables
In the group data, biventricular pacing improved cardiac output from 4.84 l/min in DDDRV mode to 5.05 l/min. There were no statistically significant differences in the changes in cardiac output and dP/dtmax between idiopathic DCM and ischaemic patients in DDDRV mode. Pacing the left ventricular chamber 32 ms before the right ventricle produced the greatest improvement in VTI (12% v simultaneous left ventricle–right ventricle activation, and compared with right ventricular pacing 32, 40, and 60 ms before left ventricular pacing (p < 0.001)). Right ventricular pacing 60 ms ahead of left ventricular pacing induced the greatest deterioration in VTI (14%). We corroborated these findings by examining the left ventricular activation time using the non-contact mapping system.
Left ventricular activation time
There was a significant inverse correlation between left ventricular activation time (measured from left ventricular breakout) and cardiac index (r = −0.55, p < 0.001) during biventricular pacing in the six patients with slow conduction regions, five of whom had ischaemic cardiomyopathy. This correlation was weaker (r = –0.44, p < 0.001) in all 10 patients. The greatest differences in left ventricular activation time occurred between biventricular pacing and DDDRV mode in the entire study group. Biventricular pacing with the left ventricle paced first reduced left ventricular activation time by 21% compared with DDDRV.
Effect of optimal left ventricle–right ventricle timing on wavefront coalition and fusion
Figure 5 shows the right ventricular and left ventricular pacing triggered depolarisation wavefronts. One of the principal effects of biventricular pacing was to generate a larger global region of simultaneous activation compared with DDDLV pacing alone. This occurred as a result of fusion of septal and posterior wall activation wavefronts generated from activation triggered by the right and left ventricular leads, respectively. These independent right and left ventricular wavefronts are shown in fig 5. Depolarisation initiated by the left ventricular stimulus was delayed in leaving the area of slow conduction, taking a mean of 69.7 ms to exit. The right ventricular activation wavefront took a mean of 66.9 ms to break out into the left ventricle (table 2). If simultaneous activation by both wavefronts is important in determining left ventricular synchrony, then pacing the left ventricle 30–40 ms before the right should allow maximal global left ventricular activation, as the left ventricular wavefront can leave the area of slow conduction in time to merge with the opposite right ventricular wavefront. The mean maximal difference in left ventricular breakout from slow conduction regions and right ventricle stimulated left ventricular activation was 30.6 ms. This corresponds closely to the optimal left ventricle–right ventricle timing identified on TTE (that is, 32 ms with left ventricle paced first), and this is verified by the fact that optimal fusion of these two wavefronts occurs when the left ventricle is paced before the right at these relative timings (fig 5). Pacing the right ventricle first prevents the left ventricular activation wavefront from leaving the slow conduction region in time to optimally depolarise the left ventricle.

Right ventricular, left ventricular, and biventricular pacing in rows A–C, respectively. Timings are referenced from first pacing stimulus. (A) Activation due to the right ventricle emerges on the lower septum 60 ms post-pace. (B) Left ventricular activation breaks out from the coronary sinus pacing site, taking 90 ms to exit the surrounding slow conduction zone into normally activating myocardium. Thus for optimal wavefront coalition (C), biventricular pacing requires left ventricular stimulation to precede right ventricle activation by 32 ms, maximally reducing left ventricular activation time to 118 ms.
DISCUSSION
This is the first endocardial mapping study to examine the effects of CRT in patients with heart failure. These data show that the “optimally placed” left ventricular lead may be positioned in a region of slow conduction, probably representing areas of local diffuse fibrosis delaying progression of the depolarisation wavefront.23 The time to achieve global depolarisation of the left ventricle is therefore prolonged. This can be partially compensated for by pacing the left ventricular site before the right ventricle to improve interventricular synchrony. Non-contact mapping explains the haemodynamic data by demonstrating that the exact time of the delay in the zone of slow conduction is critical to the haemodynamic benefit. Optimisation of the relative timing of the right ventricle with respect to the left ventricle increases the amount of the left ventricle simultaneously depolarised. Positioning the left ventricular pacing lead in an area without slow conduction increases the haemodynamic gains and is accompanied by a reduction in both left ventricular activation time and QRS width. The position of slow conduction regions determines the direction and pattern of activation wavefront progression and strongly influences left ventricular synchronisation.
Several groups have reported that pacing the left ventricular chamber 30 ms before the right ventricle generates optimal benefits in CRT. This study sheds light on the mechanism. These data provide an electrical correlate of MRI tagging,24 gated blood pool ventriculography,25 and echocardiographic data26 and illustrate the electrophysiological mechanisms behind interventricular and intraventricular timing influencing synchronous left ventricular contraction. Reductions in left ventricular activation time translate into haemodynamic benefits through reduced septal dyskinesia and early papillary muscle contraction. These minimise presystolic mitral regurgitation and increase left ventricular filling times.27 QRS width reduction occurs in some patients but this does not correlate with changes in left ventricular activation time, because the latter reflects changes in duration of depolarisation confined to the left ventricle and is not influenced by right ventricular depolarisation.
These non-contact mapping data provide insight into the impaired response predominantly seen in patients with ischaemic heart disease and delineate the factors influencing optimal lead placement in these subjects. Leads positioned in regions of slow conduction result in prolonged left ventricular activation time and dyssynchrony. Non-contact mapping allows identification of a suitable pacing substrate to induce maximal reductions in left ventricular activation time and optimal resynchronisation. Epicardial electrophysiological studies have identified the posterobasal or posterolateral wall as sites of latest activation, and indeed LBBB exaggerates the delay in depolarisation reaching these areas.4,28 This has recently been confirmed.10 Thus it is logical to pace these regions in DCM to reduce the left ventricular activation time and improve intraventricular synchrony in the left ventricle, optimising haemodynamic benefits. However, the slow conduction zones can be located in the lateral free wall at the site of the coronary sinus lead, limiting the gains achieved by pacing this area. Myocardial damage causes an inhomogeneous depolarisation pattern. Variations in the pattern and size of slow conduction areas or scar will play a significant role in determining the optimal site to pace. Non-contact mapping identified these slow conduction regions which could not be predicted reliably from the echocardiogram.
Myocardial stunning, hibernation, and fibrosis could explain this breakdown in electromechanical coupling of the ventricle. In such patients left ventricular stimulation targeted to regions where the myocardial depolarisation wavefront can propagate optimally to activate viable tissue can overcome these limitations. The recruitability of this tissue can be predicted from the characteristics of non-contact electrograms using the RMS of their amplitude. Features such as fractionation may be useful in distinguishing slow conduction regions from more electromechanically viable recruitable myocardium. These characteristics could be used to direct lead positioning in patients with ischaemic cardiomyopathy. The inverse correlation between cardiac index and left ventricular activation time in these patients supports the concept that reducing activation time by pacing in normal sites of activation can lead to improvements in haemodynamics. This may explain Pappone’s study of dual site pacing in the left ventricle which improved haemodynamics in patients with both ischaemic cardiomyopathy and idiopathic DCM, with greater gains in the latter who predominantly lack slow conduction zones.29
Study limitations
This study was designed primarily as an acute electrophysiological and haemodynamic investigation of CRT. The small number of patients means that these data clearly cannot be extrapolated to the entire CRT population, but does provide mechanistic insight into electrophysiological factors determining the response to this treatment. The chronic effects of pacing inside and outside slow conduction zones will need to be addressed in a longer term prospective study. High fidelity intraventricular pressure recordings were not obtained owing to limitations in vascular access and potential damage to the MEA.
Conclusions
The response to CRT is critically dependent upon pacing cardiac regions which can maximally reduce left ventricular activation time and induce homogeneous left ventricular depolarisation. These data support the contention that the left ventricular activation pattern is a key factor in determining responsiveness to CRT30 and is probably more important than reductions in QRS width, which are a poor indicator of success. De Bakker et al have recently demonstrated slowed conduction and abnormal unipolar electrograms in regions of fibrosed myocardium ex vivo.23 The present study illustrates the in vivo pathophysiological effects induced by such changes, and how these could be reduced in patients with heart failure. Non-contact mapping could help to identify regions of electrically viable myocardium—particularly in ischaemic patients who are unresponsive to pacing from a coronary sinus lead—and may help to guide endo/epicardial lead placement to regions of the left ventricle which depolarise in a less abnormal fashion. The exact size of substrate required to produce significant improvements in haemodynamics if paced appropriately remains to be determined.
REFERENCES
Footnotes
-
This work was presented by P D Lambiaise in the Young Investigator Competition, NASPE 2002.