Article Text

Abstract
Background: The TIMI risk score is a well-validated scoring system used to predict mortality in patients following an ST-segment elevation myocardial infarction (STEMI). N-terminal pro-B-type natriuretic peptide (NTproBNP) has also been found to be useful in predicting mortality following STEMI.
Objective: To investigate the utility of the TIMI score and NTproBNP levels at predicting risk of death in patients with acute myocardial infarction (AMI).
Methods: 473 patients (352 men, mean (SD) age 63.7 (12.3) years) with AMI were studied. Blood was drawn within 24 hours after the onset of chest pain and the plasma concentration of NTproBNP was determined using an in-house non-competitive immunoassay. Patients’ TIMI risk score was measured and patients stratified into low- (0 to 2), intermediate- (3–7) and high-risk (>8) groups.
Results: Mortality was 8.9% and was related to higher TIMI risk scores (p = 0.029 for trend). Higher NTproBNP levels were also related to increased mortality (median (range) fmol/ml, survivors 700.2 (0.3–11485.3) vs dead 5781.3 (1.4–10835.9), p<0.001). In a multivariate binary logistic regression model, independent predictors of mortality were NTproBNP levels in the first 24 hours (odds ratio (OR) = 4.21, 95% CI 1.96 to 9.07, p<0.001) together with drug treatments. The receiver operating curve for NTproBNP in the first 24 hours yielded an area under the curve (AUC) of 0.79 (95% CI 0.70 to 0.88), p<0.001, for TIMI risk score the AUC was 0.67 (95% CI 0.58 to 0.76), p = 0.001.
Conclusion: In the first 24 hours following an AMI, NTproBNP is better than the TIMI risk score at predicting mortality. A simple NTproBNP blood test is more easily applicable and is more accurate than a clinical risk score.
Statistics from Altmetric.com
Mortality is still associated with an acute ST-segment elevation myocardial infarction (STEMI) despite the use of fibrinolytic therapy1 and primary percutaneous intervention.2 Assessment of the patient is important as a means of guiding treatment and identifying those at highest risk of death so that treatment can be tailored in the future. Scoring systems have been developed to aid the clinician in judgment making, but although accurate in predicting mortality, they are either cumbersome to use3 or unweighted.4
Recently the TIMI risk score for STEMI, a bedside scoring system has been developed and is probably the most widely used scoring system for risk assessment of STEMI.5 The TIMI risk score was developed by identifying prognostic information from a multivariable analysis of the Intravenous nPA for Treatment of Infarcting Myocardium Early II (InTIME II) trial and found 10 clinical variables, which accounted for 97% of the predictive capacity of the model. The TIMI score has been found to be useful at predicting mortality when investigated in a population of patients with STEMI6 and also in predicting mortality in patients with right ventricular infarction.7
In parallel with this, biomarkers, particularly B-type natriuretic peptide (BNP) and its more stable counterpart N-terminal pro-B-type natriuretic peptide (NTproBNP),8 have been shown to have a vigorous response after an acute myocardial infarction (AMI)9 and to be useful in predicting mortality after a STEMI.10–12 Both of these peptides are easily measured by bedside assays. In this study we investigated whether NTproBNP was better than the TIMI risk score at predicting risk of death in patients with ST-segment AMI.
PATIENTS AND METHODS
Study population
We studied 473 consecutive post-STEMI patients who were admitted to the Coronary Care Unit of Leicester Royal Infirmary. The study complied with the Declaration of Helsinki, was approved by the local ethics committee and written informed consent was obtained from patients. Myocardial infarction was diagnosed if a patient had chest pain lasting >20 minutes, diagnostic serial ECG changes consisting of new pathological Q waves or ST-segment changes, and an increase in plasma creatine kinase-MB greater than twice normal or cardiac troponin I level >0.1 ng/ml.13 Exclusion criteria were known malignancy, or surgery in the previous month. Patients with ST-segment elevation of >0.1 mV in two contiguous ECG leads received thrombolytic therapy (tissue plasminogen activator or streptokinase) if they presented within a suitable time frame. The TIMI risk score for STEMI was obtained as described previously5 and patients grouped into low (TIMI score 0–2), intermediate (3–7) and high-risk (>8) groups.
Plasma samples
Blood measurements were made within 24 hours after onset of chest pain for determination of plasma NTproBNP. Three hundred patients also had blood taken between 72 and 96 hours to look at optimal timing of bloods at predicting death. After 15 minutes bed rest, 20 ml blood was collected into tubes containing EDTA and aprotinin. All plasma was stored at −70°C until assayed in a single batch.
Echocardiography
Transthoracic echocardiography was performed in patients using a Sonos 5500 instrument (Philips Medical Systems, Reigate, UK). A 16-segment left ventricular wall motion index (LVWMI) based on the American Society of Echocardiography model14 was derived by scoring each LV segment (1 = normal, 2 = hypokinesis, 3 = akinesis and 4 = dyskinesis (paradoxical motion), and dividing the total by the number of segments scored.
NTproBNP assay
Our NTproBNP assay was based on a non-competitive assay, as previously described.15 Sheep antibodies were raised to the N-terminal of human NTproBNP and monoclonal mouse antibodies were raised to the C-terminal. The N-terminal IgG was affinity purified and biotinylated. Samples or NTproBNP standards were incubated in C-terminal IgG-coated wells with the biotinylated antibody for 24 hours at 4°C. Detection was with methylacridinium ester-labelled streptavidin.15 The lower limit of detection was 0.3 fmol/ml. There was no cross reactivity with atrial natriuretic peptide, BNP, or C-type natriuretic peptide. Inter- and intracoefficients of variation were 2.3% and 4.8%, respectively. The results from this in-house assay are highly correlated (r = 0.90, p<0.001, n = 86) with those obtained on the NTproBNP assay marketed by Roche Diagnostics Ltd (Lewes, East Sussex, UK).
End points
We assessed the value of NTproBNP for the prediction of mortality. We used a primary end point consisting of death. End points were obtained by reviewing the Office of National Statistics Registry which logs all hospital deaths and by review of the medical notes. There was a minimum 30-day follow-up of all patients. No patient was lost to follow-up.
Statistical analysis
Statistical analyses were performed on SPSS version 12 (SPSS Inc, Chicago, Illinois, USA). The continuous variables in the two independent groups were compared using the Mann–Whitney U test. To test the independent predictive power for death of NTproBNP levels above and below the median, binary logistic regression analyses were conducted. We included as variables baseline patient characteristics as part of the TIMI score, gender, prior history of AMI, LVWMI, post-AMI drug treatments, coronary revascularisation and peptide markers (including troponin I and peak creatine kinase). NTproBNP was normalised by log transformation. Thus, odds ratios and hazard ratios refer to a 10-fold rise in the levels of this marker. Spearman’s correlations were performed for peptide values and continuous variables.
To identify the independent predictors of death, Cox proportional hazard analysis was used (we included the same variables as the binary logistic regression model). Kaplan–Meier survival curves were generated to visualise the relationship between the peptides NTproBNP and the composite end points. To compare the predictive value of NTproBNP, receiver operating characteristic (ROC) curves were generated and the area under the curves (AUC) was calculated. A p value <0.05 was deemed to be significant. Power calculations suggest that 473 patients recruited over 24 months with a follow-up period of at least 1 month would enable median survival probabilities of 0.9 or 0.85 at 12 months in the groups stratified by the biomarker median to be distinguished with a power of 93% at p<0.05 (two-sided test).
RESULTS
Patient characteristics
Table 1 shows the demographic features of the patient group. Median length of follow-up was 272 days with a range of 0–644 days. Of the patients enrolled, 68.5% received thrombolysis during the index admission. There were 86 coronary revascularisations. No patient was lost to follow-up. During follow-up, 42 (8.9%) patients died. Echocardiographic data was available for 399/473 (84.4%) patients and performed at a median of 3.5 days (range 2–5) after presentation with AMI. Thirty echocardiograms were unanalysable and 44 patients did not receive an echocardiogram.
NTproBNP levels in patients
Median NTproBNP was 811.1 fmol/ml, interquartile range 257.0–2951.2 fmol/ml. NTproBNP was significantly raised in patients who died (median (range) fmol/ml, survivors 700.2 (0.3–11485.3) vs dead 5781.3 (1.4–10835.9), p<0.001).
Relationship between NTproBNP and echocardiographic parameters
For the whole population, mean LVWMI was 1.53 (range 1.08–2.83). The LVWMI score was significantly higher in patients who died than in survivors (median, (range), 1.83 (1.06–2.83) vs 1.5 (1.0–2.85), p = 0.002). The LVWMI score in those subjects with anterior AMI was higher than in those with inferior AMI (1.8 (1.08–2.75) vs 1.4 (1.00–2.83), p<0.001). NTproBNP correlated with LVWMI (r = 0.342, p<0.001),
TIMI score and NTproBNP as predictors of death
Mortality was 8.9% and was related to higher TIMI risk scores (p = 0.029 for trend, fig 1). When clinical and demographic characteristics were entered into a multivariate binary logistic model NTproBNP (odds ratio (OR) = 4.21, 95% CI 1.96 to 9.07, p<0.001), post-AMI treatment with β-blockers (OR = 0.24, 95% CI 0.1 to 0.56, p = 0.001) and angiotensin converting enzyme inhibitors/angiotensin receptor blockers (OR = 0.29, 95% CI 0.12 to 0.72, p = 0.007) were the only independent predictors of death. This was also confirmed on the Cox proportional hazards model with the independent predictors of death being NTproBNP (hazards ratio (HR) = 3.82, 95% CI 1.89 to 7.78, p<0.001), post-AMI treatment with β-blockers (HR = 0.27, 95% CI 0.12 to 0.57, p = 0.001) and angiotensin converting enzyme inhibitors/angiotensin receptor blockers (HR = 0.33, 95% CI 0.16 to 0.71, p = 0.004).

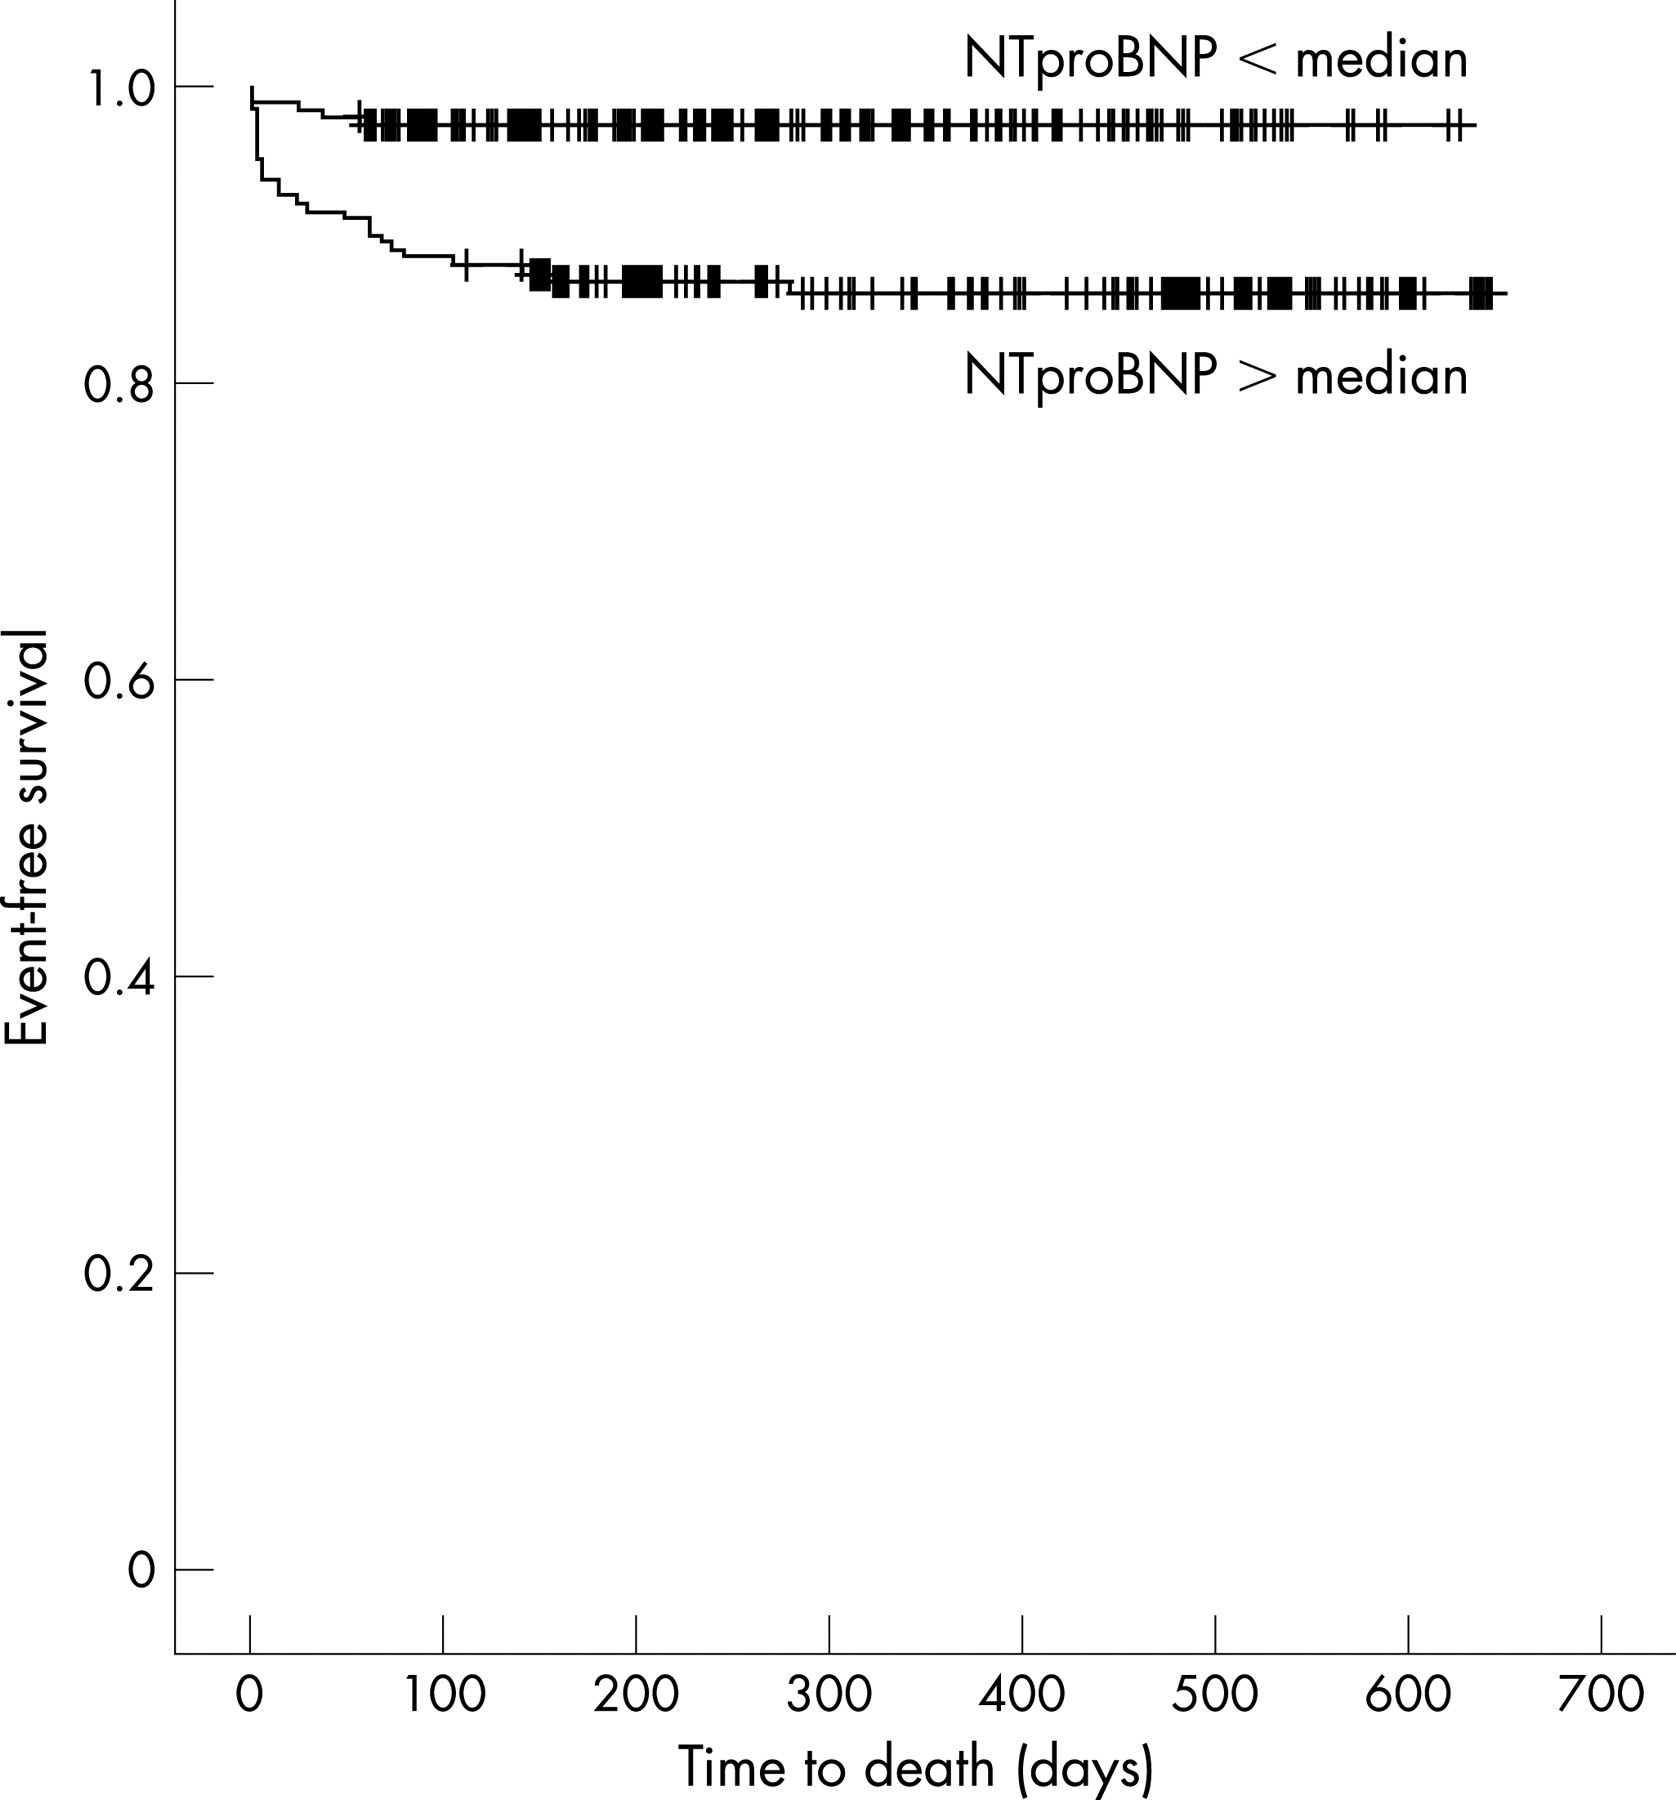
The Kaplan–Meier survival curve showed a significantly better clinical outcome in patients with NTproBNP below the median than in those with NTproBNP above the median (log rank 15.06, p<0.001, fig 2). There was also a grading of mortality on the Kaplan–Meier survival curve related to whether the patients were in low-, intermediate- or high-TIMI risk groups (log rank 29.86, p<0.001, fig 3). The ROC curve for NTproBNP in the first 24 hours yielded an AUC of 0.79 (95% CI 0.70 to 0.88, p<0.001), for TIMI risk score the AUC was 0.67 (95% CI 0.58 to 0.76, p = 0.001, fig 4).


The combination of TIMI score and NTproBNP did not significantly improve risk prediction for mortality. When NTproBNP above the median with or without the clinical presence of heart failure after AMI was investigated there was no improvement in the predictive power of the ROC curve. No difference in predicting death was noted whether NTproBNP was measured early (within first 24 hours) or late (72–96 hours) after an infarct (OR for NTproBNP 72–96 hours, 6.25, 95% CI 1.92 to 20.34, p = 0.002). Also measurement of NTproBNP within the first 12 hours performed as well as measurements taken between 13 and 24 hours.
DISCUSSION
This study aimed at comparing the TIMI risk score for STEMI with NTproBNP in determining the prognosis of patients with AMI. The results of this study confirm the previous findings that TIMI risk score is of prognostic value in patients with STEMI. However, in multivariate testing NTproBNP is better than TIMI risk scoring and is of independent prognostic value in determining death in patients who have an acute STEMI. The predictive value of NTproBNP provides risk prediction which is independent of the TIMI score, and which includes known clinical predictors of death.
Reperfusion therapy has improved mortality after AMI, but the outcome of patients despite this is still poor16; for this reason risk stratification remains important and may be useful for selecting treatment regimens in the future. Kaplan–Meier analysis showed that both raised NTproBNP and higher TIMI scores were predictive of poor outcome. However, from ROC curve analysis the AUC for NTproBNP was greater than that for the TIMI risk score showing that NTproBNP is more accurate than the TIMI score at predicting death. This was also borne out in multivariate binary and Cox regression analyses with NTproBNP but not TIMI score independently predicting mortality.
In the original paper of Morrow et al the c statistic obtained for the prognostic value of the TIMI risk score was 0.779. In our cohort of patients the c statistic for the TIMI risk score (equivalent to the ROC curve AUC) is 0.67. The reasons for the difference are probably accounted for by the different population groups. In our cohort of patients with STEMI only 68.5% of the patients received thrombolytic treatment. The TIMI risk score was derived from a population of patients who were all given thrombolytic treatment (lanoteplase or alteplase). When the TIMI risk score was used previously in a “real world” sample of patients the c statistic was 0.65,6 similar to the value we found. We would argue that our patient population is more in keeping with the real-life situation where not all patients are eligible for thrombolytic treatment and indeed these patients may in fact be at higher risk.17
The usefulness of the TIMI risk score and NTproBNP at predicting death have been investigated individually in numerous studies5 6 10 11 but the two have never been compared directly. There is now a bedside point-of-care assay for NTproBNP, so results of such tests when taken should be readily available. Moreover, we have shown that there is no difference in risk prediction whether NTproBNP is measured early or late after an acute STEMI. This makes a simple NTproBNP blood test more easily applicable and as we have shown, the NTproBNP level has more predictive accuracy than a clinical risk score in a cohort of unselected patients with STEMI.
In conclusion, the present large single-centre study shows that in the first 24 hours after an AMI, NTproBNP is better than TIMI risk scoring at predicting mortality. A simple blood test may be more easily applicable than a clinical risk score.
Acknowledgments
SQK is supported by a British Heart Foundation Junior Research Fellowship (FS/03/028/15486).
REFERENCES
Footnotes
Competing interests: None declared.
Linked Articles
- Editorial