Article Text

Abstract
Objective To assess possible ECG changes caused by dobutamine stress and their relation to wall motion disturbances in patients with coronary artery disease.
Design Prospective recording and analysis of 12 lead ECG at rest and during each stage of dobutamine stress echocardiography, and correlation with wall motion changes.
Setting A tertiary referral centre for cardiac disease equipped with non-invasive facilities for pharmacological stress tests.
Subjects 27 patients, mean (SD) age 60 (8) years, with documented evidence of coronary artery disease in whom dobutamine stress echo was clinically indicated, and 17 controls of similar age.
Results In controls, all ECG intervals shortened with increasing heart rate but in the patient group only PR and QT intervals shortened while QRS duration broadened and QTc interval prolonged progressively. In the 27 patients, 16 developed chest pain, 15 with reduced left ventricular long axis systolic excursion (p < 0.001), and all showed reduced peak lengthening rate; ST segment shift appeared in 16, 13 of whom developed chest pain, but did not correlate with reduction of either systolic long axis excursion or peak lengthening rate; QRS duration broadened in 20, 16 with reduction of long axis excursion (p < 0.02) which was more often seen at the septum (p < 0.005); QTc interval prolonged in 19, all of whom had associated reduction of peak long axis lengthening rate (p < 0.02).
Conclusions QRS duration and QTc interval both normally shorten with dobutamine stress, while in coronary artery disease they both lengthen: changes in QRS duration correlate with systolic and QTc interval with diastolic left ventricular wall motion disturbances. ST segment shift also occurred in most patients, but without consistent correlation with wall motion abnormalities. It was thus less discriminating than the other two abnormalities in this respect.
- long axis
- QRS duration
- QTc interval
- stress echocardiography
- coronary artery disease
Statistics from Altmetric.com
Although ST segment shift is widely used as a marker of myocardial ischaemia in stress testing, changes in other ECG measurements are less obvious1 and have not been widely studied as markers of disease. With pharmacological stress, muscular artefact is much less prominent than with dynamic exercise, so the ECG signal to noise ratio is correspondingly increased. Simple algorithms are now widely available to determine ECG time intervals objectively, and with reproducibility superior to that derived from direct measurement from records made at a paper speed of 25 mm/s. Finally, it is more practicable to record technically satisfactory echocardiograms during pharmacological stress than during exercise, allowing ECG changes to be correlated with mechanical events within the ventricles. In this way, it might be possible to gain insight into the physiological correlates rather than simply recognising electrical abnormalities. In particular, we wished to explore the hypothesis that the altered ventricular mechanical function that occurs with normal stress might be related to changes in ventricular activation, and that these interrelations might contribute to abnormal mechanical activity seen in patients with coronary artery disease.
Methods
SUBJECTS
Twenty seven patients were studied, mean (SD) age 60 (8) years), with a documented history of coronary artery disease. Seven were female. Ten had old (more than 12 months) myocardial infarction and the remaining 17 suffered effort induced angina, without infarction. The evidence for ischaemic heart disease was stress induced ST elevation in eight, ST depression in eight, angina preceded by coronary artery graft surgery in six, myocardial perfusion defects as assessed by thallium perfusion tomography in three, and > 75% stenosis of one or more branches demonstrated by coronary arteriography in two. Of these 27 patients, four had diabetes, 12 had additional hypertension, and six were smokers. Three patients were treated with a β adrenoceptor blocker and six with angiotensin converting enzyme (ACE) inhibition for hypertension. Drugs were not altered before the study. We compared the results in patients with those from 17 controls of mean age 59 (9) years (10 female). None of the controls had any clinical evidence of heart disease, hypertension, or diabetes.
All patients were referred, on clinical grounds, for stress echocardiography to assess possible segmental wall motion abnormalities that might be associated with their symptoms. Patients and controls were studied at rest and during the last minute of each of four stages of a dobutamine stress test with a starting dose of 5 μg/kg/min and increasing by a similar dose amount every three minutes, using an infusion pump. A 12 lead ECG was recorded at rest and at each level of stress, using a Hewlett Packard Pagewriter XLi, with a built-in analysis package (Hewlett Packard Co, Andover, Massachusetts, USA). ECG intervals and amplitudes were measured automatically and registered on the printed chart. The frequency response of the machine was 0.05 to 150 Hz with the baseline filter (0.4 Hz) inactivated.
Transthoracic echocardiography was also performed at rest and at each stage of dobutamine stress, with the subject lying in the semilateral supine position, using a Hewlett-Packard Sonos 1500 echocardiograph and a 2.5 MHz transducer interfaced to it. Cross sectional guided M mode recordings of left ventricular minor axis were performed from the standard left parasternal long axis view. Left and right ventricular long axes were obtained using the same transducer from the apical four chamber view with the M mode cursor positioned at the left and septal angles of the mitral ring and lateral angle of the tricuspid ring, representing the right ventricular free wall.2 ,3 All records were obtained at the last minute of each stage simultaneously with a 12 lead ECG, along with a superimposed ECG (lead II) and a phonocardiogram and recorded at a paper speed of 100 mm/s. M mode traces were later digitised off line.4 Systolic and diastolic blood pressures were also recorded using a Critikon Dinamap monitor (Critikon Inc, Tampa, Florida, USA) and oxygen saturation using a Nellcor pulse oximeter (Nellcor Inc, Pleasanton, California, USA).
Predetermined stress end points were: significant chest pain, 2 mm ST segment shift (elevation or depression), 20 mm Hg drop in blood pressure, or achieving target heart rate (220 minus age in years (beats/min)).
MEASUREMENTS
ECG
PR interval, QRS duration, and QT and QTc intervals were determined directly by the inbuilt computer software. QT dispersion was taken as the difference between minimum and maximum QT intervals between the 12 leads of the ECG. ST segment elevation or depression was measured manually 80 ms after J point of the ST segment for the ECG lead showing maximum change. Abnormal ECG criteria were: 2 mm or more ST shift, either elevation or depression in any lead; those for QRS complex or QTc interval were determined from the 95% confidence limits established in the 17 controls.
Echocardiography
Left ventricular minor axis dimensions were taken at end diastole (at the onset of the Q wave of the ECG) and end systole (at the first high frequency component of the second heart sound of the phonocardiogram). Total long axis excursion was measured as the amplitude of mitral and tricuspid ring motion between the same two end diastolic and end systolic landmarks. From the digitised long axis traces peak early diastolic lengthening rate was measured at the two left ventricular sites (left and septal) and right ventricular free wall. Abnormal criteria were established from 95% confidence limits in the control group.
ECG reproducibility
The reproducibility of ECG measurements of QRS duration and QTc interval were assessed in a sample of 16 patients from duplicate ECGs taken within one minute of each other. Paired ECGs were recorded at rest and at peak stress. The paired records were first examined for any consistent difference between the two. Reproducibility was then assessed as the root mean square (RMS) difference between duplicate values, and the corresponding value of coefficient of variation as the ratio of RMS difference/mean value (table 1).
ECG reproducibility
STATISTICS
ECG resting and stress values were compared with controls using Student’s unpaired t test. Resting values were compared with stress values in the control and patient groups using pairedt test. Incremental stress values in the controls and patients were compared by one way analysis of variance (anova). The incidence of abnormalities in individual patients was assessed by χ2 probability test.
Results
Heart rate, blood pressure, ECG, and long axis values are shown in table 2. Stress end points, in all patients proved to be either anginal pain or > 2 mm ST segment shift (elevation or depression), or both. In the controls, the test was terminated when 85% expected peak heart rate had been achieved, or at the end of stage IV. In none of the patients was the test terminated because the target heart rate was reached prematurely or because a significant arrhythmia occurred.
ECG and long axis values at rest and peak stress
ECG
The results are shown in fig 1.

A graph showing the incremental change in heart rate, QRS duration, and QTc interval during dobutamine stress. Note the trend of divergence between patients and controls with increase in heart rate: a consistent shortening of intervals in controls and prolongation in patients.
Controls
With stress, heart rate (p < 0.001) and systolic blood pressure (p < 0.005) both increased, but diastolic blood pressure did not change. Rate–pressure product thus increased significantly (p < 0.001). PR and QT intervals both shortened (p < 0.001) but QT dispersion did not change significantly. QRS duration and QTc interval both shortened progressively from stage II onwards (both p < 0.001) (table 3). The 95% confidence interval for normal QRS change with stress was −17 to −1 ms, and for QTc it was −57 to +7 ms.
ECG and blood pressure response to incremental stress
Patients
Heart rate, blood pressure, and rate–pressure product were similar to controls at rest and at peak stress (except that diastolic blood pressure was slightly higher and fell with stress). PR interval was slightly longer at rest (p < 0.05). PR and QT intervals shortened with stress, while QRS duration and QTc interval both lengthened significantly.
LEFT VENTRICULAR LONG AXIS
The results are shown in fig 2.

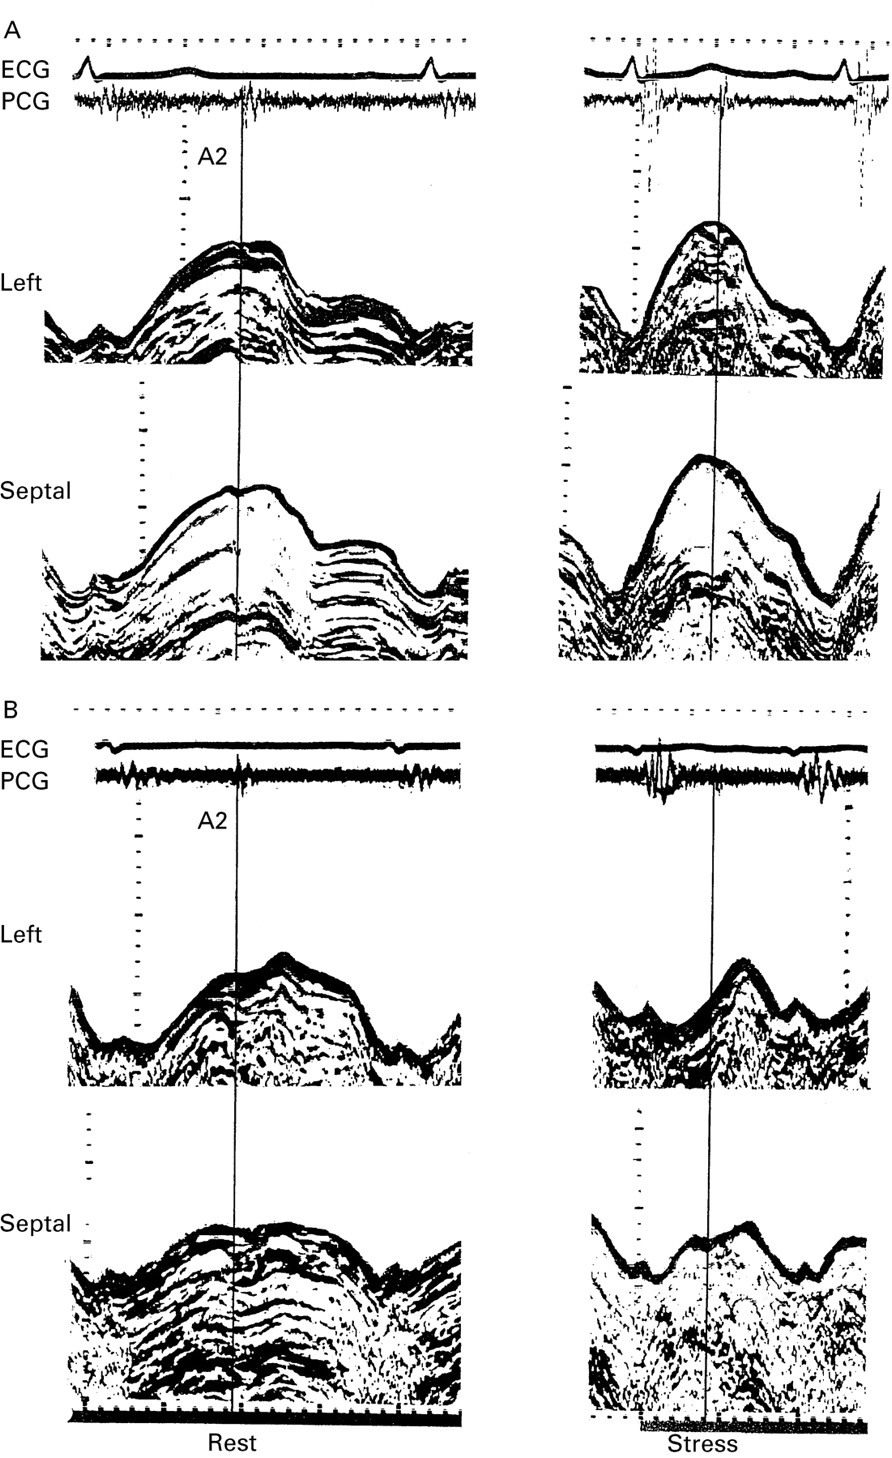
(A) M mode recording of left (top) and septal (below) long axis at rest (left) and peak stress (right) taken from a control. (B) Similar recordings taken from a patient with coronary artery disease. Note the increase in long axis amplitude of systolic excursion and lengthening velocity with stress in the control and the reduction of both in the patient.
Controls
With stress, total long axis excursion increased at both sites, by approximately 20%, and peak early diastolic lengthening rate increased by 30%. Resting values of the two measurements in the patients were depressed with respect to controls (p < 0.001 for each). In patients, normal changes did not occur with stress and there was a significant fall in peak long axis lengthening rate.
RELATION BETWEEN STRESS INDUCED ABNORMALITIES AND ECHO MEASUREMENTS IN INDIVIDUAL PATIENTS
The results are given in table 4.
Correlation between the appearance of ECG changes with stress and long axis abnormalities in the patient group
At peak stress, 16 of 27 patients had chest pain; in 15 of these long axis excursion fell below the 95% confidence limits of normal (χ2 = 13, p < 0.001) and in all 16 lengthening velocity was reduced. Sixteen of 27 patients developed ST segment shift at peak stress, but this was not associated with consistent change in either long axis amplitude or peak lengthening rate. Twenty of 27 patients showed an increase in QRS duration at peak stress; in 16 of these total long axis excursion fell below the 95% confidence interval of normal (χ2 = 6.2, p < 0.02). This association was significant at the free wall (χ2 = 5.6, p < 0.02) and septal sites (χ2 = 8.8, p < 0.005). Nineteen of 27 patients showed prolongation of QTc interval at peak stress; all of these had associated reduction in peak long axis lengthening rate (χ2 = 5.9, p < 0.02). There was no association between QRS duration and peak lengthening rate or between QTc and long axis amplitude change with stress. Patients on β adrenoceptor blockers did not differ from the rest of the patients with respect to the QRS and QTc changes with stress.
Discussion
Left ventricular long axis function is often abnormal at rest in patients with coronary artery disease,5-7 probably because it is supported by subendocardial fibres.8 During systole, the overall amplitude and velocity of contraction may be reduced and its duration may be prolonged, so that contraction may persist locally into early diastole as the rest of the ventricle relaxes during isovolumic relaxation. During diastole, lengthening velocity may be reduced, and the amplitude of the component of lengthening during atrial systole may be increased.5 These changes occur in the absence of other evidence of overt ischaemia; they are aggravated by balloon inflation during coronary angioplasty9 and resolve within 48 hours of a successful procedure.10 These changes can readily be detected with M mode echocardiography and followed during dobutamine infusion. We therefore took their appearance as mechanical evidence of myocardial ischaemia had developed.
A series of ECG changes could be documented in normal subjects, using dobutamine stress. Not unexpectedly there was a fall in PR and QT intervals as the heart rate rose, QTc progressively shortened, while QT dispersion was unaltered. Of more significance was progressive shortening of the QRS duration, by a total of approximately 10%. This finding was highly consistent, and indeed the 95% confidence limits indicated that some shortening could be taken as a criterion of normality. A trend towards shortening has previously been found during exercise1 ,11; our findings are compatible with these previous studies, allowing for the improved signal to noise ratio of pharmacological stress. ECG changes occurring with stress were often abnormal. Not surprisingly, ST segment shift occurred in the majority of patients. Although the changes in heart rate and PR interval matched those in the control group, both QRS duration and QTc were consistently prolonged, by mean values of 16 and 50 ms respectively, so that the respective differences from normal both became highly significant.
In an attempt to determine possible mechanisms underlying these ECG changes, we studied their relation to mechanical events, particularly to the characteristics of left ventricular long axis function in individual patients. We could find no mechanical correlate of ST segment shift. Prolongation of the QTc, however, was consistently related to a depression of long axis lengthening velocity, while prolongation of QRS duration correlated with a reduced amplitude of long axis systolic shortening, but not with lengthening velocity. We conclude from these electromechanical interrelations that the different stress induced ECG disturbances are to a significant extent independent of one another. They do not support the idea that prolongation of the QTc interval or ST segment shift, for instance, may be the direct consequences of increased activation time, or that all may be the direct consequence of a single aspect of ischaemia.
The limitations of this study are clear. Coronary arteriograms were not available in all patients although the clinical diagnosis of coronary artery disease was clearly established in all. The stress end points were either the development of significant symptoms or more than 2 mm ST segment shift; none of the patients developed any symptomatic hypotension or arrhythmia that might have influenced the results. The confidence limits around mean values of the ECG measurements precluded our establishing a threshold effect. The reproducibility of microprocessor determined ECG intervals proved to be small, and the limits are well within those necessary to support our conclusions, not only for the groups but also for the majority of individual patients. The stress induced abnormalities are unlikely to be a result of the pharmacological agent itself or to be related directly to changes in loading conditions, since none of the controls in whom changes in rate–pressure product were equal developed similar disturbances. Likewise, the small number of patients who were on β blockade did not have any significant effect on the patient group as a whole. Finally, the aim of the study was to assess segmental ventricular function objectively throughout the cardiac cycle, rather than to use the traditional subjective wall motion scoring index, based only on systolic performance.
The stress induced ECG changes shown in our study may have clinical implications. The normal fall in QTc with stress probably has no significance other than confirming the well known limitations of the Bazett formula11 in “correcting” for the heart rate change caused by dobutamine infusion. Against the background of normal shortening, however, the consistent lengthening of QTc in patients with coronary artery disease and the interrelation with diastolic disturbances appear more substantive. The end of the normal T wave and the onset of ventricular diastole are normally synchronous with one another.12 The correlation of an abnormally prolonged QTc with a disturbance of long axis lengthening thus represents an interrelation between electrical and mechanical events that are occurring synchronously. It is therefore possible for a causal relation to exist between the two, with abnormal mechanical activity modifying the time course of ventricular repolarisation. Since diastolic disturbances are the earliest mechanical abnormalities to appear with ischaemia, it is possible that abnormal lengthening of QTc might be a marker of these, and thus might be used as a secondary endpoint of stress testing.
Changes in QRS duration with stress have been little studied, but in view of the close relation that exists between activation and mechanical activity, they have potential physiological implications. There is no reason to believe that stress alters the relation between QRS duration on the surface ECG and ventricular activation time. The normal fall in QRS duration thus implies greater synchrony in the onset of activation between different regions of the ventricle, the effect of which will be to increase the peak rates of ventricular dP/dt, both positive and negative, and to reduce the duration of mechanical systole. From the point of view of the ventricle as a whole, therefore, shortening of QRS duration would mimic a positive inotropic action, although the rates of local myocardial stress development and oxygen uptake would be unaltered. Exactly the same considerations apply at the end of mechanical systole, when the increased rate of pressure fall might be taken as indicating “enhancement” of left ventricular relaxation during exercise.13 Such effects are well documented with exercise and are usually attributed to the direct myocardial effects of increased sympathetic stimulation; our results suggest that the observed activation changes might contribute to both. Even if the effect on QRS duration were itself the result of increased sympathetic activity, the secondary effects on ventricular function would clearly be different from direct myocardial stimulation in terms of myocardial oxygen requirement and arrhythmogenicity. Equally significant in terms of the pathophysiology of ventricular function in coronary artery disease was the prolongation of QRS duration seen in the patient group. Whatever the mechanism of electrical abnormality, its effect would be to mimic a negative inotropic effect during systole and to impair measurements generally agreed to reflect diastolic left ventricular function. Interrelations between ventricular function and QRS duration have been explored at rest in patients with dilated cardiomyopathy, and concordance between the two has been demonstrated.14 Extrapolation of the extent of increase of QRS duration seen in the present study to these electromechanical interactions indicates that clinically significant changes in both systolic and diastolic measurements might be expected. If our present results are confirmed, therefore, we must conclude that alterations in ventricular activation sequence can cause significant changes in ventricular function previously attributed to the direct effects of sympathetic stimulation or disease. We believe that these electromechanical interrelations represent a potentially fruitful field of research which merits further investigation.
CONCLUSION
Our study shows a close correlation between the development of abnormal QRS broadening with systolic and QTc interval prolongation and diastolic left ventricular dysfunction during provocation of ischaemic symptoms. It appears that ST segment shift is not the only electrical disturbance that may occur with ischaemia. Although the other two abnormalities may appear less prominent they may be more discriminating in terms of correlation with wall motion disturbances, even in the absence of ST shift.