Article Text

Abstract
Objective (1) To compare mortality estimates based on clinicopathological diagnoses of death from acute coronary heart disease with official estimates of coronary heart disease mortality; (2) to compare present day mortality figures with those from earlier reports.
Design Prospective community study over the two years 1994 and 1995.
Setting The health districts of Brighton, South Glamorgan, and York.
Subjects 1589 men and women under 75 years of age who, based on our study criteria, died from acute coronary events were compared with certified cases of coronary death in the same age group.
Main outcome measures (1) Comparison of the underlying cause recorded on death certificates with the diagnosis of acute coronary death defined by our study criteria; (2) comparison of age specific mortality figures of the present with earlier studies.
Results Up to age 65, age specific mortality for coronary heart disease, using study criteria, was similar to official estimates. However, at ages 65–74 years there was a shortfall in study deaths of about 20% compared with official figures. One reason for this was that many death certificates in elderly people attributed death to coronary disease in the absence of confirmatory evidence. Despite this, deaths in the under 65 age group in the 1990s appear to be occurring in people who are about 10 years older than was the case during the 1970s.
Conclusions There are differences, most noticeable in elderly subjects, between estimates of coronary mortality made according to strict clinical and pathological definitions and official rates based on death certification. Recognition of these differences will be important for future epidemiological studies.
- mortality
- coronary heart disease
- clinicopathological diagnosis
- epidemiology
Statistics from Altmetric.com
Official statistics1 show that mortality from coronary heart disease in the United Kingdom has declined by about 30% since 1980, while the rate of fall during the 1990s is similar in Britain to the United States. Age specific death rates show that mortality is falling more rapidly in age groups 35–44 and 45–54 years for both sexes than in the age group 65–74 years. The number of deaths from coronary heart disease has now fallen below the number of deaths from all forms of cancer.1
Official statistics, however, are based on death certificates, which are often inaccurate2-4 and tend to overestimate the number of circulatory deaths.5 Death certificates are least reliable in the elderly age groups in which most circulatory deaths occur.1
Recording of all coronary deaths defined by strict clinical and pathological criteria in people under 75 years of age in three United Kingdom health districts during 1994 to 19956 allowed us to perform a validation exercise comparing independently calculated with official death rates. We were also able to compare mortality and case fatality rates during the 1990s with those reported from similar studies performed 8–25 years earlier.7-11
Methods
STUDY POPULATION
The United Kingdom heart attack study (UKHAS) recorded coronary deaths and non-fatal myocardial infarction in the health districts of Brighton (estimated population 282 000), South Glamorgan (408 000), and York (264 000) in people under 75 years of age between 1 January 1994 and 31 December 1995. Populations were defined by post code sector of place of residence; population figures for these post codes for the age groups 35–44, 45–54, 55–64, and 65–74 years for men and women separately were obtained from the Office of National Statistics. Official figures for coronary mortality in these districts are near the average (York and South Glamorgan) or slightly below average (Brighton) for the United Kingdom as a whole.1 On the assumption that similar numbers of deaths occurred in visitors to the health districts as in residents who died outside the districts, we included the former group and excluded the latter. Six per cent of deaths occurred in visitors.
CASE IDENTIFICATION AND DEFINITION
We identified deaths from transcripts of death certificates provided regularly to the health authorities by the local registrar of deaths and by regular surveillance of deaths in the hospitals serving the health districts (two major general hospitals in South Glamorgan and one each in Brighton and York), and used these as a basis for validating the causes of death, using our own previously determined criteria. With permission from coroners in the three centres, copies of all necropsy reports were regularly reviewed and checked against data from the transcripts. In cases of out of hospital death in which coronary heart disease had been mentioned on the certificate we wrote to the certifying general practitioner asking for details of the medical history. With permission from the practitioners, case notes were retrieved from the Family Health Service Authority if necessary. Circumstances of death were recorded either from summaries made by the coroners’ officers and recorded on the necropsy reports or on forms made out by ambulance paramedics who had been summoned to the cardiac arrest. If these approaches failed, in some cases permission was sought from the general practitioner to contact the next of kin directly.
Out of hospital deaths were included either if they showed ischaemic heart disease as the principal cause of death at coroner’s necropsy or, in the absence of necropsy, if they occurred following prolonged chest pain or in patients with a history of ischaemic heart disease who died unexpectedly and without any other apparent cause. Necropsy cases were required to have stenosis of ⩾ 50% of diameter in at least one major epicardial coronary artery. Although evidence from detailed pathological studies shows that death can occasionally be caused by plaque rupture in stenoses of < 50% diameter,12ruptured atherosclerotic plaques are rarely recognised in routine coroner’s necropsies, and very few patients were discarded because stenoses were reported as < 50% in diameter. Deaths from chronic heart failure caused by ischaemic heart disease were recorded in one centre (Brighton) but were excluded from the main analysis.
Hospital survivors from myocardial infarction were identified by regular surveillance of admissions to coronary care units and medical wards, by scrutiny of creatine kinase enzyme results provided by the hospital laboratories, and by liaison with cardiac rehabilitation nurses. Lists were finally checked against lists of discharge diagnoses provided by hospital records departments. Identification was thus by a combination of “cold” and “hot” pursuit.11 Cases of myocardial infarction showed at least two of the following three features: typical or compatible clinical history; sequential electrocardiographic changes (development of pathological Q waves or ST segment/T wave changes, or both); and a rise in serum enzymes to at least twice the upper limit of normal for the hospital laboratory. Survivors from myocardial infarction who were diagnosed and treated outside hospital were not included,11 but we confirmed by questionnaires sent to general practitioners that they are rare in people under 75 years of age.
RECORDING OF DATA AND CALCULATION OF CASE FATALITY
Data were recorded on standardised forms, stored on computers at all three centres using a Paradox database, and sent at regular intervals on disk to the coordinating centre in Brighton for amalgamation with the main database. Quality control was achieved by checking data for internal consistency at each centre individually, at the coordinating centre, and by a member of the steering committee (DGJ) who visited the three centres and audited a random selection of cases. Differences were resolved and progress assessed by investigators’ meetings, which were held three to six monthly.
Case fatality rates were calculated as the total deaths divided by total events as defined and expressed as a percentage. Events occurring more than 30 days after a previous episode were considered as new events.
CALCULATION OF MORTALITY AND COMPARISON WITH OFFICIAL ESTIMATES
Annual mortality per 100 000 of our populations for men and women separately in age groups 35–44, 45–54, 55–64, and 65–74 years was calculated by dividing deaths recorded during 1994–1995 by 2 and dividing this by the population figures supplied by the Office of National Statistics. Age standardised mortality for age groups 35–64 and 35–74 years was calculated with reference to the European standard population13 and 30 day case fatality for age groups 35–64 using our data for non-fatal events6 with age standardisation as recommended by the MONICA investigators.11
Because we had discarded deaths attributed to coronary disease, particularly in the 65–74 year age group, in which our criteria were not met, we checked our mortality figures against official estimates. We obtained from the Office of National Statistics death certificate data on all coronary deaths in people aged less than 75 years that occurred in the Brighton Health District during 1994–1995. These included names and multiple causes of death leading to the underlying cause code. We were thus able to check the sensitivity and predictive value of certified coronary death (ninth version ICD codes 410–414) as the underlying cause for prediction of coronary death defined by our criteria. For the purpose of this analysis, sensitivity was defined as the proportion of deaths included in UKHAS that had been coded ICD 410–414 as the underlying cause in the death certificates. Predictive value was defined as the proportion of coded 410–414 deaths that had been included in UKHAS.5
Having established these indices for Brighton, we obtained the numbers of deaths by age and sex attributed to ICD 410–414 as the underlying cause for the study postcode areas in South Glamorgan and York. We then compared our study findings in these two centres with the underlying cause of death certified as ICD code 410–414.
STATISTICAL METHODS
Significance of the difference between numbers of included and rejected patients with respect to age was assessed by the χ2 test.
HISTORICAL COMPARISON WITH EARLIER STUDIES
Having established the relation of our calculated mortality with the official estimates, we then compared our own mortality and case fatality estimates with those from the earlier United Kingdom studies7-10 and with those from the 38 populations in the MONICA study.11 Wherever possible, methodological differences were taken into account.
Results
We recorded 3523 events, 73% of which occurred in men; 1589 (45%) were fatal. Out of hospital and in-hospital fatalities are described more fully elsewhere.6 ,14 In summary, of the 1589 fatal events, 1172 (74%) happened outside hospital; of the 417 in-hospital fatalities, 322 (77%) were from diagnosed myocardial infarction and 95 (23%) were unexpected ischaemic cardiac deaths in people who had been admitted to hospital for another reason, or who arrived at hospital moribund with cardiac symptoms and died before an electrocardiographic diagnosis could be made. Of the patients who died outside hospital, 86% (91% in the < 65 year age group and 83% in the 65–74 year age group) fulfilled our necropsy criteria for ischaemic cardiac death. These proportions were similar in the three centres. The 14% who had no necropsy either had known coronary disease and died suddenly or else had a history of prolonged chest pain preceding death. Fatality rates did not differ importantly between centres.
COMPARISON OF STUDY WITH CERTIFIED DEATHS IN BRIGHTON
We were able to obtain death certificate data on all 399 study deaths in Brighton that occurred in residents. Table 1 shows separately, for age groups < 65 and 65–74 years, agreements and disagreements of study with certified deaths in which ICD 410–414 had been given as the underlying cause, together with figures for sensitivity and predictive value of certificate diagnoses. In nearly all of the 37 cases in table 1 in which the death certificate was negative and the study diagnosis positive, ICD code 410–414 was included on the certificate as a condition leading to death, but it was not given as the underlying cause and therefore would not have been included as a coronary death in national statistics. Figures for sensitivity and predictive value of death certificate diagnoses were similar (89% and 87%) in people under 65 years of age. Sensitivity remained high (92%) at age 65–74 years, but predictive value fell to 70% in this age group. This fall in predictive value for older compared with younger subjects was highly significant (p < 0.001).
Effect of age on sensitivity and predictive accuracy of death certificate diagnoses of coronary heart disease (CHD) in Brighton1-150
In practical terms, any fall in predictive value below 100% implied that deaths certified as being caused by coronary disease did not satisfy UKHAS criteria—that is, at ages 65–74 years we accepted only 70% of the attending doctors’ diagnoses of coronary heart disease as the underlying cause of death. There were two reasons for this. First, we did not include deaths from chronic congestive heart failure in the main body of data, although we did record them separately. This accounted for approximately 30% of the discarded cases. In the remaining 70%, death had been attributed to coronary disease despite the absence of confirmatory clinical or necropsy evidence.
Reduction in sensitivity below 100%, on the other hand, refers to the proportion of cases we included even though death had been certified as being caused by some other underlying cause. Thirty seven cases from Brighton were in this category. Table 2 shows that the most common source of disagreement with our criteria for acute coronary death was attribution of the underlying cause of death by the certifying doctor to diabetes.
Death certificate diagnoses of the underlying cause of death in 37 certified cases of non-coronary deaths in Brighton during 1994–95 which were included in the present study
The effects of reduced sensitivity and reduced predictive value on our mortality estimates were opposite—a fall in predictive value caused our estimates to be lower than the official ones while a fall in sensitivity caused our estimates to be higher. Below age 65, the effects of reduction in both indices approximately cancelled each other out, so that our estimates of mortality were almost identical with those based on official criteria. At ages 65–74, on the other hand, we discarded more cases than we included (predictive value 70%v sensitivity 91%). Consequently our estimates of mortality were lower by 25% for men and by 19% for women than the estimates based on ICD codes 410–414 (fig1).

Comparison of mortality in Brighton from acute coronary attacks calculated from results of the present study (UKHAS) with estimates calculated from death certificate data on the underlying cause of death provided by the Office of National Statistics (ONS). Figures refer to the number of study deaths in each age and sex group.
COMPARISON OF STUDY DEATHS IN SOUTH GLAMORGAN AND YORK WITH DEATH CERTIFICATE DIAGNOSES
A shortfall of 8.5% of study deaths compared with certified deaths was shown for subjects under 65 years of age, and the shortfall was larger (16.1%) at ages 65–74 years (NS) (table 3). Figure 2compares mortality calculated from study deaths in men and women with rates calculated from the death certificates. As in Brighton, mortality calculated by the two methods was similar up to age 64, but at ages 65–74 mortality was underestimated by our study in relation to certified mortality by 14% for men and by 23% for women.
Study deaths compared with certified deaths from coronary heart disease (CHD) in South Glamorgan and York

Comparison of mortality in South Glamorgan and York calculated from results of the UK heart attack study (UKHAS) with estimates calculated from cause of death from death certificates (ONS). Figures refer to the number of study deaths in each age and sex group.
COMPARISON WITH FATALITY AND MORTALITY REPORTED 20–25 YEARS AGO
Case fatality rates are compared in table 4 and community mortality in table 5, in each case comparing the same age group in the present study as was reported earlier. Table 4 shows a variable reduction in case fatality today compared with 25 years ago. Within the total age group, fatality is considerably less than it was in Oxford in 1965, but is only marginally less than in Edinburgh and London in 1970 and is the same as in Teeside in 1972–1973. However, the high fatality rate reported from Oxford may have been due to underreporting of non-fatal events from a largely rural community.15
Comparison of the present with previous United Kingdom studies: case fatality
Comparison of the present with previous UK studies: mortality/105 study population
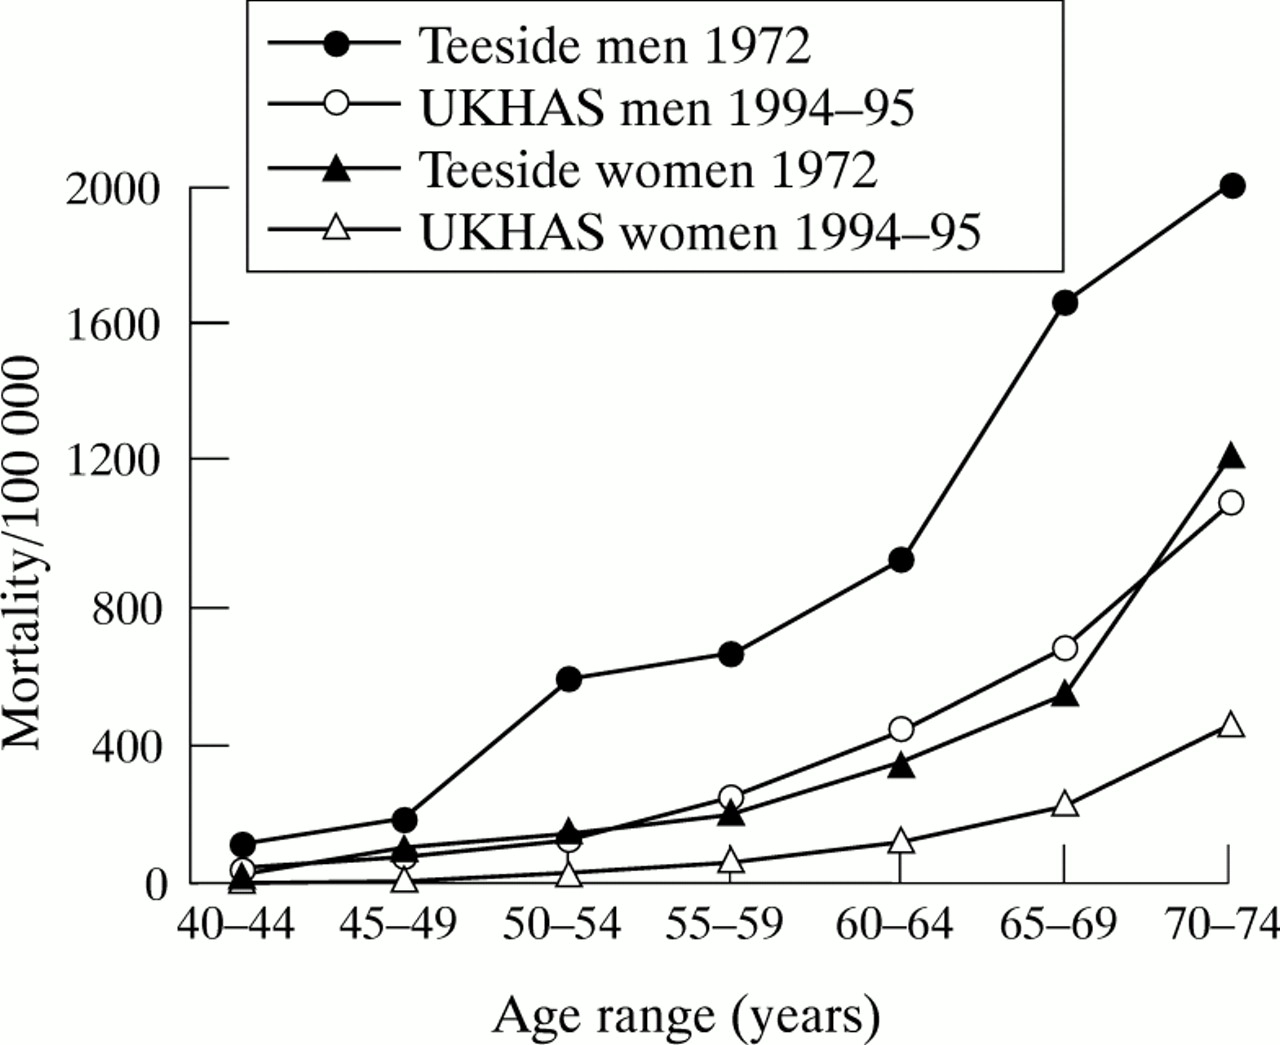
In contrast to these somewhat equivocal changes, table 5 shows a striking decline in community mortality in most cases to 50% or less of that recorded previously. Closer comparisons of results from three of the studies from 20 to 25 years ago,7 ,8 ,16 in which mortality was reported by age decade7 ,8 or by five year age groups,16 showed in each case that mortality in the present study corresponded most closely with that in people in the earlier populations who were about 10 years younger than at present. This is shown by comparison with the Teeside study9 ,16for people under 65 years of age in fig 3.

COMPARISON WITH THE MONICA STUDY
MONICA reported mortality and 28 day fatality in 38 populations from 21 countries and four continents.11 The events reported occurred during 1985–1987, some eight years before those in our study, only two United Kingdom centres (Glasgow and Belfast) participated, and the report was restricted to the 35–64 year age group. For this age group 30 day case fatality in our study was 35% (95% confidence interval 32% to 38%) for men and 36% (31% to 41%) for women. Age standardisation using the MONICA method changed fatality only from 36% to 35% for men and from 35% to 36% for women. These rates were considerably lower than those from the same age group in the MONICA population (average 49% for men and 54% for women). Moreover the rates were lower than those in all 38 MONICA populations for men and for all but four of the populations in women.
Mortality was 135/105 of the UKHAS population in men and 30/105 in women. Comparison of these rates with those from MONICA (figure 5 in reference 11) shows they were in the lower one third of those from the 38 populations. This is in striking contrast to the United Kingdom MONICA populations during 1985–1987, in which Glasgow and Belfast ranked respectively second and seventh for mortality in men and first and second in women.
Discussion
COMPARISON OF STUDY WITH CERTIFIED DEATHS
Despite a considerable disparity in individual cases between certified diagnoses and those based on our strict clinical and pathological definitions, calculated mortality using either estimate correlated reasonably well up to the age of 64 years. As suggested by the subset of patients studied in Brighton, this correlation depended on the inclusion in our study of about 10% of deaths despite certification that death was from another cause, and the exclusion of a similar proportion because the certifying doctor’s diagnosis of coronary death had not been supported by clinical or pathological data. Between ages 65 and 74 years the latter category predominated over the former, so that our estimates of mortality for this age group were about 20% lower than the official estimates. Estimates from South Glamorgan and York, which were based simply on a comparison of numbers of study deaths with certified deaths, showed a similar trend to that established by the analysis of individual cases that we performed in Brighton.
About 10% of deaths in the age group 35–64 years that were reported from United Kingdom centres participating in the MONICA study10 were “unclassifiable”—that is, they had no record of suggestive symptoms, no history of coronary heart disease, and no necropsy. These “unclassifiable” cases may correspond with our 19 cases (table 1) in which the death certificate was positive for coronary death but our study categorisation was negative. The present results agree with MONICA that up to the age of 64 years numbers of certified coronary deaths correspond fairly closely to numbers of study deaths. However, MONICA does not include subjects more than 64 years old. Official statistics show that only 14% of coronary deaths occur in the 35–64 year age group, while 28% occur at ages 64–75 and 58% at age 75 years and over.1
The exclusion from our study of “unclassifiable” deaths and deaths from chronic heart failure caused by coronary heart disease highlights important differences between clinicopathological definitions of death from coronary heart disease on the one hand and epidemiological definitions on the other. Cardiologists are reluctant to accept as a coronary death a sudden death from natural causes in which there has been no history of myocardial ischaemia and no necropsy. Although many such deaths probably are caused by coronary disease, it is known from comparative studies of necropsy with death certificate diagnoses that circulatory diseases are overdiagnosed on death certificates, particularly in the elderly.2 ,5 Nearly all the recent reports on coronary deaths in hospital exclude deaths from congestive heart failure, but heart failure is just as much a part of the burden of coronary disease as acute myocardial infarction and sudden cardiac death, and the prevalence is increasing.17 ,18 Thus the mortality we found in the 65–74 year age group probably underestimates the true rates, which lie somewhere between those we found and those recorded by the Office of National Statistics. The 20% shortfall from official estimates that we found at age 65–74 is likely to be even larger for the age group 75 years and older, in which 58% of all coronary deaths are said to occur.1
COMPARISON OF FATALITY AND MORTALITY OVER 25 YEARS IN THE UNITED KINGDOM
Criteria for case selection in the present study appear to be similar in most respects to those used during the late 1960s and early 1970s.7-10 Our criteria for diagnosis of myocardial infarction (two of the following: compatible history, electrocardiographic changes, serum enzyme rise) are those generally accepted by clinicians; they correspond essentially to the categories of “definite” and “possible” infarction that were used in East London8 and Teeside,9 although they exclude the category “myocardial ischaemia” (unstable angina) that was used in Edinburgh.10 Criteria for diagnosis of out of hospital death from an acute ischaemic episode are more difficult. Most of our cases (86%) were verified by necropsy. A similarly high proportion appear to have been verified by necropsy in East London19; although the figure given (75%) is somewhat lower than ours, this proportion included patients who died in hospital, a group that is known to have a lower necropsy rate than those who die outside. The 67% necropsy rate for unattended deaths in Oxford7 was lower than in the present study, and the 4.4% rate in Edinburgh10 was much lower. The necropsy rate in Teeside9 ,16 was not stated but “possible myocardial infarction” was diagnosed when death was attributed to myocardial infarction on the death certificate.
The low proportion of out of hospital deaths in our study in which necropsy evidence was not available might suggest that the “unclassifiable” cases we discarded caused an underestimation of the true mortality. As has been discussed, this may have been the case in subjects over 64 years of age, but in those under age 65, our exclusion of unclassifiable cases was balanced by inclusion of deaths that had been attributed by the general practitioner to another cause. Assuming that fashions in death certification over the past 25 years have not changed, the comparison of the present mortality figures with those in Teeside in 1972 should be valid up to age 64 years, although the difference may be exaggerated at ages 65–74.
COMPARISON OF FATALITY AND MORTALITY WITH THE MONICA POPULATIONS
The cause of the low fatality in both men and women in the present study is uncertain, although it is probably in part explained by methodological differences. Our definition of non-fatal cases of infarction was similar to that of “definite infarction” in MONICA.11 However, as noted, our definition of fatal cases excluded deaths from chronic heart failure and “unclassifiable” deaths. Estimates on the likely effect on case fatality on the assumption that the proportion of heart failure and unclassifiable deaths was similar in South Glamorgan and York to those in Brighton would have increased fatality from 35% in men and 36% in women to 40% in both sexes. This is still lower than the mean value for MONICA and is at about the 10th to the 15th centile for the 38 populations.
The relatively low community mortality is of particular interest given the MONICA finding that mortality in the two United Kingdom populations was among the highest of those studied. Part of the difference may be explicable by the decline in United Kingdom mortality that has occurred over the past eight years,1 but the main reason is likely to be the known marked geographical differences over different regions of Britain. According to figures compiled by the British Heart Foundation,1 contemporary mortality rates for the worst affected MONICA centre (Glasgow) are 1.7 to 3.3 times higher than those of the UKHAS centres for women, and 1.4 to 2.3 times higher for men. This high mortality appears to be attributable to the consequences of social deprivation leading, among other things, to poor diet and a high prevalence of smoking.20
In summary, our study shows that numbers of deaths from acute coronary heart disease defined by strict clinical and pathological criteria are approximately the same as official figures up to the age of 65 years, but are lower than official estimates at ages 65–74 years. Comparisons of fatality and mortality figures during 1994 to 1995 with those of 25 years ago suggest that the decline in mortality from coronary heart disease has been caused more by a reduction in the incidence of acute coronary events than by a reduction in case fatality. At least in the under 65 year age groups, coronary deaths are now occurring in people who are about 10 years older than previously. However, it is important to note that postponement of coronary death may mean that patients die increasingly from other cardiovascular diseases, and in particular from congestive heart failure.17 ,18
The Health of the Nation initiative21 calls for a further reduction by 40% of coronary deaths in people under 65 years of age by the year 2000. Estimation of whether this has been achieved will depend on the reliability of death certificate diagnoses. Results from this study suggest that numbers of certified deaths in this age group correlate reasonably well with numbers estimated using defined clinical and pathological criteria.
Acknowledgments
The UKHAS was supported by audit funds from the Department of Health, and by the PPP Medical Trust (RMN). We are grateful to the coroners and coroners pathologists in the participating centres for allowing us access to their reports.
Participating centres
Brighton (coordinating centre, Cardiac Department, Royal Sussex County Hospital): R M Norris (honorary consultant cardiologist, study director), Gaynor Dixon (research sister responsible for coordination and database management), P S Wong (research registrar), Nina Morris (research sister), Maria Workman and Janet Stevens (secretaries).
Cardiff (Department of Cardiology, University Hospital of Wales): W J Penny (consultant cardiologist), Nadia El Gaylani (research registrar), Anne Thomas (research sister), Lesley Davies (research sister).
York (Department of Cardiology, York District Hospital): R M Boyle (consultant cardiologist), Kathryn Griffith (research registrar), Siân Wiseman (research sister), Sue Cooper (research sister).
Steering Committee
R Vincent (Brighton, Chairman), R M Boyle (York), D A Chamberlain (Brighton), D G Julian (London), R M Norris (Brighton), W J Penny (Cardiff), C F M Weston (Swansea).
Publications committee
R M Norris, D G Julian, C F M Weston.
Statistical adviser
D R Robinson (School of Mathematical Sciences, University of Sussex).
References
Footnotes
UKHAS Collaborative Group Investigators R M Norris P S Wong G Dixon N Morris W J Penny N El Gaylani A Thomas L Davies R M Boyle K Griffith S Wiseman S Cooper D R Robinson
A full list of collaborators appears at the end of this report.