Article Text

Abstract
Objective To assess the stability and reproducibility of computerised QT dispersion (QTd) measurement in healthy subjects, as this is presently being incorporated into commercial electrocardiographic systems.
Methods 70 healthy volunteers (mean (SD) age 38 (10) years, 35 men, 35 women) with a normal 12 lead electrocardiogram (ECG) were studied. From each subject, 70 ECG recordings were taken using the MAC VU ECG recorder (Marquette). In study A, 50 ECGs were recorded in each subject: 10 supine, 10 sitting, 10 standing, 10 holding breath in maximum inspiration, and 10 holding breath in maximum expiration. After a mean interval of 8 (3) days (range 7 to 23), 10 recordings in supine and 10 in the standing position were repeated in each subject (study B). On measurements made using a research version of the commercial software without manual modification, the reproducibility of QTd was assessed by coefficient of variance (CV) and relative error, and comparisons made with other ECG indices.
Results (1) QTd measurements were stable and not influenced by changes in posture and respiratory cycle; (2) there was no difference in QTd measurements between men and women, or between age groups dichotomised at 35 years; (3) no correlation was found between QTd and heart rate or QT interval; (4) short term reproducibility of all QTd measurements (CV 15.6% to 43.8%) was worse than that of conventional ECG indices (CV 1.4% to 5.3%); (5) long term reproducibility of QTd measurements (relative error 27.4% to 31.0%) was also worse than that of conventional ECG indices (relative error 1.8% to 7.9%) (p < 0.0001); (6) the reproducibility of QTd measurements tended to increase when several serial recordings were averaged.
Conclusions Computerised measurements of global QTd and global QT-SD from 12 lead ECG by the MAC VU/QT Guard system are not significantly altered by changes in posture and respiration. The reproducibility of all QTd measurements is inferior to that of conventional ECG indices in healthy subjects.
- QT dispersion
- reproducibility
- automatic measurement
- healthy subjects
Statistics from Altmetric.com
Advances in the use of non-invasive techniques to identify patients at high risk of arrhythmias and sudden cardiac death are required to select patients who would benefit most from prophylactic antiarrhythmic treatment. The use of the so called QT dispersion (QTd) for risk stratification has recently been proposed.1 ,2Electrocardiographic QTd is thought to reflect heterogeneity of ventricular repolarisation,1 and increased QTd has been reported in association with arrhythmic risk in different clinical settings.1-7 However, results of studies on the use of QTd for prognostic risk stratification have been inconsistent3 ,4 ,8-11 and there are conflicting data on the reproducibility of measurements of QTd.3 ,12 ,13Factors responsible for the variation in QTd measurement are still a matter for debate. For instance, although variations in the T wave with respiration are known, they are often ignored in studies investigating QTd (that is, the ECGs examined have not been synchronised with respect to the respiratory cycle).
In the past, most of the studies dealing with QTd were based purely on manual measurements of paper recorded ECGs. Only a few of these studies used a precise digitising board with visual identification of the relevant ECG patterns. Recently, substantial technical advances have been made with respect to automatic QTd measurement, which is being incorporated into commercial electrocardiographic equipment. However, the stability of measurements by automatic commercial systems needs to be evaluated before they can be accepted for clinical studies.
Our study was designed to test whether the computerised QTd measurements provided by the MAC VU electrocardiograph in conjunction with a research version of the QT Guard analysis software package14 by Marquette Medical Systems (Milwaukee, Wisconsin, USA) are stable and reproducible, and whether the measurements of QTd reported by this system are affected by age, gender, posture, and respiration in healthy subjects.
Methods
STUDY POPULATION
We studied 75 healthy volunteers. None of the subjects had any cardiovascular symptoms or history of cardiovascular disease, and all were normal on clinical examination. We excluded five subjects because of incomplete right bundle branch block (3) or a marginally prolonged PR interval (2). The remaining 70 subjects (mean (SD) age 38 (10) years, range 13 to 60 years; 35 men, 35 women) with completely normal 12 lead ECG were included in this analysis.
ECG RECORDINGS
Standard 12 lead ECG recordings were taken using an MAC VU ECG recorder and sampled at 250 Hz. Repeated 10 second ECG recordings of all 12 leads were taken simultaneously. Each ECG in the same patient was recorded immediately after the previous one had been stored in a floppy disk; recording of 10 consecutive ECGs was accomplished within three to five minutes.
Seventy ECG recordings were taken from each subject, 50 in study A and 20 in study B.
Study A
Ten resting ECGs were recorded in the supine position, followed by 10 consecutive ECGs taken in each of the following positions: sitting, standing, holding breath in maximum inspiration, and holding breath in maximum expiration. In 35 subjects, the maximum expiration and maximum inspiration recordings were taken in a supine position; in the other 35 subjects they were taken in the sitting position. These 50 recordings were always taken in the above order.
Study B
Study B was performed after a mean (SD) interval of 8 (3) days (range 6 to 23), when 10 ECG recordings were repeated in the supine position, followed by 10 in the standing position. In each subject, the electrode positions used in study A were carefully reproduced during study B. The digitised ECG data from both study A and B were stored on floppy disks and transferred to a dedicated personal workstation for further processing.
COMPUTERISED MEASUREMENTS
A research version of the software package QT Guard by Marquette Medical Systems running under Microsoft Windows 95 on a personal computer was used for this analysis. For each ECG, QTd was automatically calculated without manual modification of the computerised recognition of the T wave offset. By a default setting of the commercial software, all V1 leads are eliminated from the measurement by the software because of the high frequency of flat T waves in this lead, which is considered to influence the accuracy of QTd measurement. The commercial software can be forced into QT interval measurement in V1 if the operator believes that the end of the T wave can be localised. However, as such an approach may introduce an operator dependent bias, the standard option of the software was not suppressed and the lead V1 were systematically excluded from the analysis.
The following four QTd indices were derived from each recording:
- (1)
- Global QTd, defined as the difference between the maximum and minimum QT interval from any valid lead of the 12 leads
- (2)
- Precordial QTd, defined as the difference between the maximum and minimum QT interval from any valid lead of the six precordial leads
- (3)
- Global QT standard deviation (QT-SD), defined as the standard deviation of the QT intervals in all valid leads of 12 leads
- (4)
- Precordial QT-SD, defined as the standard deviation of the QT intervals in all valid leads of the six precordial leads.
In each lead, the decision on whether the QT interval could be measured or needed to be omitted from the analysis was automatically determined by the commercial system. The so called “valid leads” in which the measurement was performed were selected on the basis of the noise level (standard deviation of T-P segment signal divided by T wave amplitude < 0.7), T wave amplitude (> 60 μV), and the QRS duration (< 140 ms).
In addition, conventional ECG indices—that is, heart rate, PR interval, QRS duration, QT and QTc intervals—were automatically derived from each recording using the same commercial system. These measurements were used as references for comparison of the stability and reproducibility of QTd measurements.
DATA ANALYSIS AND STATISTICS
Assessment of short term reproducibility
The short term reproducibility was assessed by the coefficients of variance, which were calculated for the 10 recordings taken in each position. The short term reproducibility of QTd and conventional ECG measurements were compared with each other, and between the measurements taken in various positions, using Student’s pairedt test applied to the coefficient of variance.
Assessment of long term reproducibility
The long term reproducibility between studies A and B was assessed by calculating the relative errors according to the formula: ‖A–B‖/[(A+B)/2], where A represented the first measurement (the averaged values of the 10 recordings in supine or standing positions from study A) and B the second measurement (the averaged values of the 10 recordings in the corresponding position from study B). The relative errors are used as percentages in this report. The relative errors of the QTd measurements were compared with those of the conventional ECG measurements, and between the measurements taken in the supine and standing positions, using Student’s paired t test.
Assessment of stability
The stability of measurements was evaluated by comparing the numerical values of the various indices taken from different positions by Student’s paired t test. Averaged values of the measurements from the sets of 10 recordings taken in the same position were used for this purpose.
Improvement of short term reproducibility
In an attempt to improve the short term reproducibility of QTd measurement, relative error was calculated using the formula ‖A–B‖/[(A+B)/2], where the first measurement of A was derived by averaging the first two (and in turn, the first three, four, and five) of the 10 recordings in each position from each subject, while the second measurement of B was derived by averaging the next two (and in turn, the next three, four, and five) of the 10 recordings in the same position from each subject. The relative errors were then compared with each other using Student’s paired t test.
Comparison of the measurements
All measurements of QTd and conventional ECG indices were compared between genders and age groups (dichotomised at the median value of 35 years) using Student’s unpaired t test. The correlation between measurements of various indices was evaluated using Pearson’s correlation analysis.
All data are expressed as mean (SD). A two tailed p value of < 0.05 was considered statistically significant.
Results
ECG RECORDINGS AND VALID LEADS
In all 4900 ECG recordings were analysed in the study. In 10 individual recordings taken from five subjects in the standing position (study B), only one valid precordial lead was identified by the analytical software. The 10 recordings were omitted when analysing precordial QTd and its reproducibility. Otherwise, all 4900 ECG recordings were used in the remaining analyses.
The mean numbers of valid leads measured in each position in both study A and study B are listed in table 1. A mean of between 9.52 and 10.23 leads was recognised for global QT measurements, and between 4.69 and 4.97 for precordial QT measurements. Significantly fewer valid leads were recognised in the standing position than in all other positions (p < 0.01).
The number of valid leads for QT dispersion measurements in each position
SHORT TERM REPRODUCIBILITY
Short term reproducibility, expressed by the coefficient of variance, of all conventional ECG and QTd measurements is shown in table 2. The reproducibility of conventional ECG measurements was significantly greater than that of QTd. Among the four QTd indices, the global QT-SD measurement was the most reproducible, and the precordial QTd the least (fig 1).
The short term reproducibility (coefficient of variance %) of QT dispersion and conventional ECG measurements (study A)

Mean values and standard deviations of coefficient of variance of QT dispersion measurements in the seven various positions. ME, ECG recordings on maximum expiration in study A; MI, ECG recordings on maximum inspiration in study A; SIT, ECG recordings when sitting in study A; STA-A/B, ECG recordings when standing in study A/B; SUP-A/B, ECG recordings in the supine position in study A/B.
Changes in posture diminished the reproducibility of most of the conventional ECG and QTd measurements with exception of QRS duration. Also, the reproducibility of PR interval in the standing position was not significantly altered. All QTd measurements were significantly less reproducible in the standing position than in the supine or sitting positions.
Different effects of the respiratory cycle on the QTd and conventional ECG measurements were found. Inspiration significantly diminished the reproducibility of all measurements, while expiration only diminished the reproducibility of QT and QTc intervals in comparison with the supine position. The reproducibility of global QTd and global QT-SD was lower in expiration than in inspiration, and was similar to that in the supine position.
LONG TERM REPRODUCIBILITY
The long term reproducibility, expressed as the relative errors between the subsequent recordings, is presented in table 3. The relative error of heart rate was higher (7.9%) than other conventional ECG measurements. All other conventional ECG measurements were highly reproducible, with negligible relative errors ranging from 1.8% to 3.8% in both supine and standing position. In contrast, we found relatively poor reproducibility of QTd measurements between subsequent recordings, with relative errors ranging from 27.4% to 31.0% in the supine position, and from 27.1% to 34.4% in the standing position. The global and precordial QT-SD measurements appeared to be slightly more reproducible than global and precordial QTd in the supine position. However, no significant differences in the relative errors were found between any QTd indices, or between any recordings in the supine and standing positions.
Relative error (%) for QT dispersion and ECG measurements
STABILITY OF QTd AND STANDARD ECG MEASUREMENTS
The numerical values of all QTd and conventional ECG measurements are given in table 4. No significant differences in any measurement were found between the initial recordings (study A) and the repeat recordings (study B).
Mean values of the QT dispersion and conventional ECG measurements
Changes in posture significantly altered most of conventional ECG measurements, and the precordial QTd and QT-SD measurements, but not global QTd and global QT-SD (table 4).
Inspiration increased the heart rate and consequently reduced other conventional ECG measurements, except QTc. Expiration did not alter heart rate but reduced the numerical values of other ECG measurements except QTc. All QTd measurements remained stable in inspiration, while precordial QTd and precordial QT-SD measurements were slightly reduced in expiration (table 4).
IMPROVEMENT IN SHORT TERM REPRODUCIBILITY OF QTd MEASUREMENTS
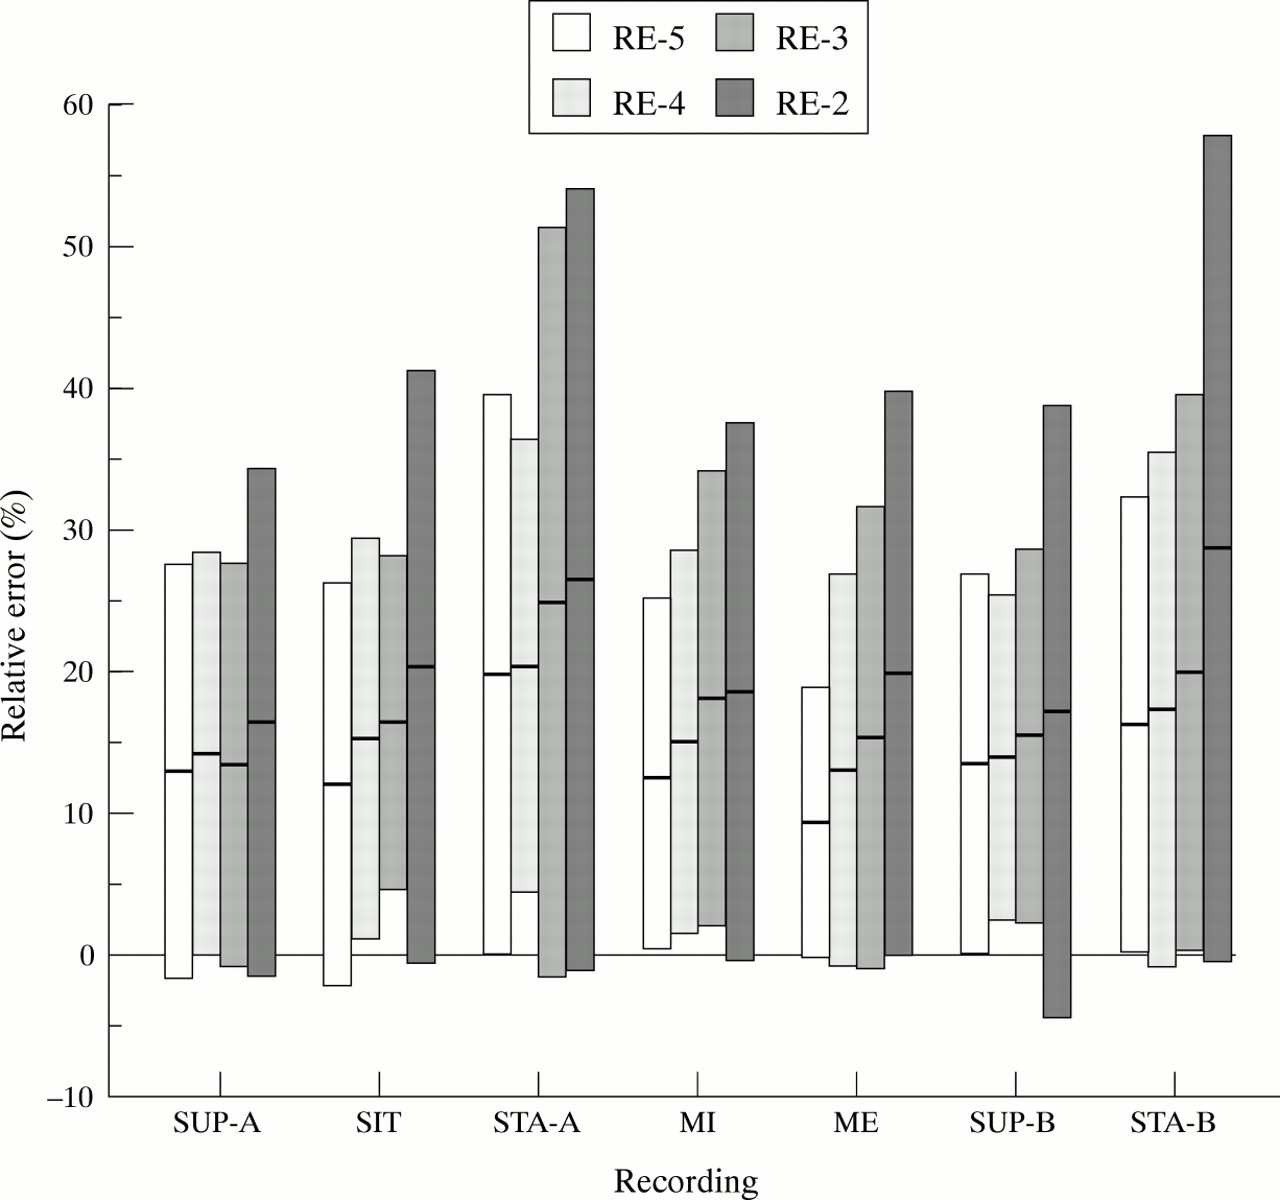
A trend of increasing reproducibility was found when the number of recordings which were used to calculate the mean of any of the measurements was increased in steps (fig 2). There were significant differences in the relative errors between averaging two and averaging five measurements of global QTd and global QT-SD in all positions (p < 0.05) except in the supine position (table 5). However, no significant difference in the relative error of precordial QTd was found between recordings in different positions except in expiration (p = 0.04). More variable differences in the relative error of precordial QT-SD were found in the supine and sitting positions (p = 0.02 and 0.01 respectively) and in expiration (p = 0.01) in study A, and in standing (p = 0.01) in study B. Generally, the reproducibility of QTd measurement tended to be higher when more recordings were averaged.

Relative errors for global QT dispersion measurement in seven various conditions. RE-2 (RE-3, RE-4, or RE-5): relative error calculated using the formula ‖A–B‖/[(A+B)/2], where the first measure A was obtained by averaging the measures of the first two (three, four, or five) of the 10 consecutive ECG recordings, and the second measure B was obtained by averaging the next two (three, four, or five) recordings. ME, ECG recordings on maximum expiration in study A; MI, ECG recordings on maximum inspiration in study A; SIT, ECG recordings when sitting in study A; STA-A/B, ECG recordings when standing in study A/B; SUP-A/B, ECG recordings in the supine position in study A/B.
Comparison of the short term reproducibility (relative errors %) of QT dispersion and conventional ECG measurements
COMPARISON OF NUMERICAL VALUES OF MEASUREMENTS IN SUBGROUPS
Comparison of measurements between genders
The QRS duration was shorter (p < 0.05), and the QTc interval longer (p = 0.01) in women than in men when standing. No differences in QTd indices were found between men and women in study A or study B.
Comparison of measurements between age groups
Conventional ECG measurements were similar in the two age groups (⩽ 35 v > 35 years) with exception of QRS duration, which was longer in subjects ⩽ 35 years than in those > 35 years (92 (8) v 88 (7) ms, p < 0.05). There was no significant difference between the age groups in the QTd measurements taken in any position except for standing in study B (p < 0.05 compared with all QTd measurements). Although a weak but significant correlation was found between age and global QTd and global QT-SD in the supine position in study A (r = −0.25, p < 0.05 for both), no such a correlation was found in the supine position in study B (r = −0.05 and −0.08, p = NS for global QTd and global QT-SD, respectively), or in any of the other recordings (r = −0.18 to −0.007, p = NS).
RELATION BETWEEN THE MEASUREMENTS
A very strong correlation was found between global QTd and global QT-SD (r = 0.996, p < 0.001; fig 3A), and between precordial QTd and precordial QT-SD (r = 0.997, p < 0.001; fig 3B). There was also a significant but relatively weak correlation between global QTd and precordial QTd in supine recordings (r = 0.378, p < 0.002, for study A; r = 0.608, p < 0.001, for study B), and between global QT-SD and precordial QT-SD in the supine recordings (r = 0.413, p < 0.001, for study A; r = 0.675, p < 0.001, for study B).

The correlation between the measurements of global QT dispersion and global QT standard deviation (A); and between the measurements of precordial QT dispersion and precordial QT standard deviation (B).
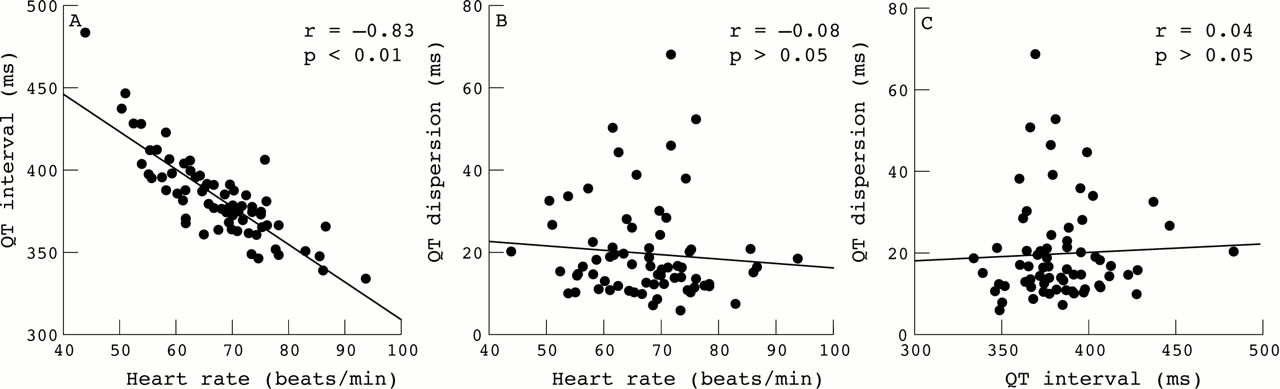
A significant correlation between QT interval and heart rate was found as expected (fig 4A). The global QTd was not correlated with heart rate (fig 4B) or with the QT interval (fig 4C). A similar relation was observed in global QT-SD (r = −0.022, p = NS for the correlation with heart rate; r = −0.052, p = NS for QT interval). A significant but relatively weak correlation was found between precordial QTd or precordial QT-SD and heart rate (r = −0.281 and −0.282, p < 0.05, respectively), and QT interval (r = 0.342 and 0.341, p < 0.005, respectively). However, the variation in heart rate or QT interval explains just over 8.0% (r 2 = 0.079) or 11.7% (r 2 = 0.117) of the total variation in precordial QTd or precordial QT-SD. The correlation between precordial QTd or precordial QT-SD and heart rate was lost in study B (r = −0.173 and −0.155, p = NS, respectively); other relations remained the same in study B.
The correlation between the measurements of QT interval and heart rate (A); between global QT dispersion and heart rate (B); and between global QT dispersion and QT interval (C). All measures presented here are from study A in the supine position.
Discussion
This study shows that computerised measurements of all conventional ECG indices from standard 12 lead ECGs are highly reproducible. However, the computerised QTd measurements are significantly less reproducible than conventional ECG measurements. In general, although changes in posture and respiration do not affect the global QTd measurements, the reproducibility of many of the QTd measurements was significantly affected by posture and respiration. No gender related differences in any QTd measurements were observed, and the QTd measurements appear not to be dependent on age. The global and precordial QTd measurements could be well substituted by the global and precordial QT-SD respectively, and vice versa. Thus speculation proposing the use of standard deviation based measures of QT dispersion and criticising the use of only extreme values of QT interval as insufficient seems to be poorly founded, at least in data from healthy volunteers.
Despite the potential importance of QTd assessment in risk stratification, there are reservations about its clinical application because of concerns over the stability and reproducibility of its measurement. Previous studies have drawn conflicting conclusions,3 ,12 ,13 ,15 ,16 which may have arisen because of the various techniques used in these studies and the different populations involved. Van de Loo et al found acceptable reproducibility using manual measurement of QTd both in normal subjects (intraobserver relative error 14%) and in patients with acute myocardial infarction (intraobserver relative error 15%).3 In contrast, poor reproducibility of manual assessment of QTd has been reported in both healthy volunteers (intrasubject relative error 25% to 35%)12 and myocardial infarction patients (relative error of 35% to 40%).15 Moreover, Glancy et al found poor reproducibility of automated assessment of QTd in postinfarction patients (relative error 19.8% to 35.7%).13 This is in broad agreement with our study, where the reproducibility of computerised QTd was somewhat disappointing (relative errors of 27.4% to 31.0% between subsequent recordings in the supine position). These data suggest that QTd has a wide range of variation even in normal subjects.
Superficially, it might be argued that our quoting only the relative errors ignores the absolute errors, the numerical values of which might look more favourable when comparing the reproducibility of QTd indices with that of other ECG indices. Unfortunately, such an argument is a misunderstanding since in principle any measurement precision needs to be expressed in relative terms (for example, a precision of ±2 cm is excellent when measuring a size of a garden but clearly insufficient when measuring a the diameter of a bolt.)
It remains uncertain what factors are responsible for the variation in QTd. The most probable explanation for the lack of reproducibility of QTd is that the wide variety of T wave patterns generally presented over 12 leads makes identification of T wave offset difficult in some leads, not only in manual but also in computerised measurement, thus providing the potential for great variability in QTd measurements.4 ,13 ,15 Although there should be no “intraobserver” variability for automated measurement on the same recording, changes in duration or morphologies of the T waves will cause “intrasubject” variability of QTd when analysing repeated recordings.
It has long been recognised that the autonomic nervous system influences the QT interval.17 ,18 Although no significant correlation between the QT interval duration and dispersion was observed in our study, a significant association between QTd and T wave duration was shown in a study on normal subjects.16 The duration of the T wave is modulated by autonomic tone and changes in the T wave duration have been suggested as the primary cause of QT changes. Thus alterations in autonomic tone may cause variability in QTd.
Whether posture or respiratory cycles may have an influence on the variation of QTd—by alteration of anatomical orientation of the heart in the thorax—has not previously been investigated. Computerised QTd measurement, by eliminating the variability in visual identification of a particular point to measure, should focus on physiological variation of repolarisation in healthy subjects. Our results show that changes in posture altered the measurements of precordial QTd slightly, but that the global measurements remained constant in various positions. These findings do not support the speculation that QTd or variability in QTd may result from variation in cardiac orientation, particularly in the case of global measurement in the supine position. There may be a physiological variability of repolarisation dispersion19 owing to alteration of sympathovagal tone.17
For a potential risk predictor to be useful, the measurements need to be reproducible. Although some factors which may have an adverse effect on the measurement cannot be controlled for, an attempt has be made to improve the short term reproducibility by increasing the number of samples. Our results indicate that it may be feasible to improve the reproducibility of QTd in this way.
The numerical values of QTd measurements—in particular precordial QTd—were relatively lower than in previous studies,3 ,4 ,12 which may have resulted from the exclusion of lead V1 at the default setting. It has been shown that about 30% of the measurements of minimum QT intervals are made in lead V1,12 and omitting this may cause a large relative error in measurements from a 12 lead ECG.20 Caution should be taken when comparing our results with others, although this may not influence the assessment of the stability and reproducibility of the QTd measurement significantly.
The technical and numerical reasons for the low reproducibility of QTd measurements should also be considered. The analysis of digital ECGs from the MAC VU electrocardiograph operates with 250 Hz sampling, making it possible to measure the individual QT intervals on a discrete scale with 4 ms steps. As the values of precordial QTd were often just 4 ms, the difference between the longest and shortest precordial QT interval was precisely one step on the measurement scale. In such a case, the difference of ±1 measurement step leads to relative errors of 200% and 67%, respectively, which, of course, influences the statistics greatly. It is reasonable to assume that in recordings of cardiac patients in whom a greater values of QTd might be expected this problem will not exist, or will at least be expressed to a lesser extent.
For the same technical reason, rather than averaging the QTd measurements from sequential recordings as was attempted in our study, it might be more appropriate to average the QT interval measurements across all beats in individual leads and to use these averages in QTd computation. We did not use this approach because it was beyond the capabilities of the present version of the commercial software.
PRACTICAL IMPLICATIONS
Our findings show that global QTd measurements are relatively stable under various condition and independent of heart rate, suggesting that it may not be necessary to use simultaneous ECG recordings for evaluation of QTd in practice. In addition, our findings provide relevant information for the dynamic assessment of the QTd during a 24 hour period. The results obtained from recordings during standing should be interpreted with caution because of their lower reproducibility in the upright position.
Even though the variability in QTd results in a large measurement overlap between normal subjects and cardiac patients, QTd still can distinguish normal people from patients because of the significantly increased values under pathological conditions.21Therefore QTd has the potential to be used as a non-invasive marker when incorporated into risk stratification algorithms.
Our data suggest that the reproducibility of the computerised QTd measurement needs further investigation in cardiac patients, in whom more complex repolarisation patterns are expected. Averaging of results from several serial measurements should be used whenever possible in order to improve the reproducibility of the assessment.
Acknowledgments
We thank all volunteers who participated in this study for their corporation and effort. This study was supported in part by the National Heart Research Fund, the British Heart Foundation, and an educational grant by Marquette Medical Systems.