Article Text

Abstract
OBJECTIVES To estimate the cost effectiveness of statin treatment in preventing coronary heart disease (CHD) and to examine the effect of the CHD risk level targeted and the cost of statins on the cost effectiveness of treatment.
DESIGN Cohort life table method using data from outcome trials.
MAIN OUTCOME MEASURES The cost per life year gained for lifelong statin treatment at annual CHD event risks of 4.5% (secondary prevention) and 3.0%, 2.0%, and 1.5% (all primary prevention), with the cost of statins varied from £100 to £800 per year.
RESULTS The costs per life year gained according to annual CHD event risk were: for 4.5%, £5100; 3.0%, £8200; 2.0%, £10 700; and 1.5%, £12 500. Reducing the cost of statins increases cost effectiveness, and narrows the difference in cost effectiveness across the range of CHD event risks.
CONCLUSIONS At current prices statin treatment for secondary prevention, and for primary prevention at a CHD event risk 3.0% per year, is as cost effective as many treatments in wide use. Primary prevention at lower CHD event risks (< 3.0% per year) is less cost effective and unlikely to be affordable at current prices and levels of health service funding. As the cost of statins falls, primary prevention at lower risk levels becomes more cost effective. However, the large volume of treatment needed will remain a major problem.
- coronary artery disease
- cost effectiveness
- statins
- primary prevention
- secondary prevention
Statistics from Altmetric.com
The results of recent controlled trials with hydroxymethyl glutaryl coenzyme A (HMG-CoA) reductase inhibitors (statins)1-3have radically altered attitudes to cholesterol lowering treatment for the prevention of coronary heart disease (CHD). These trials justify the use of statins for secondary1 ,2 and primary3 prevention of CHD on the basis of clinical effectiveness. Statin treatment will deliver substantial benefits to patients and potential savings to health services. Their wide use, however, will have major implications in terms of the number of subjects to be treated and the cost of treatment.4Clinicians and purchasers of healthcare will have to develop policies for treatment, and among other factors these policies should take into account the cost effectiveness of statin treatment in different patient groups. Without a clear policy there is a danger of poorly targeted and inefficient prescribing.
The use of statins for secondary prevention of CHD is relatively straightforward because patients with established coronary disease have a high risk of further events, and attain large benefit from treatment. Thus the Scandinavian simvastatin survival study (4S) showed substantial benefits in patients who had a myocardial infarction or angina and total cholesterol ⩾ 5.5 mmol/l, with only 13 patients needing to be treated with simvastatin for five years to prevent one major coronary event.1 We have estimated that perhaps 930 000 patients in England will benefit from statins for secondary prevention of CHD.4 Several studies have estimated the cost effectiveness of statin treatment for secondary prevention,5-10 and perhaps the best is a well designed economic analysis by the 4S trialists.5 This estimated the cost per life year gained by simvastatin treatment at £5502, and concluded that secondary prevention was cost effective when compared to other treatments that are widely used. It should be noted that this analysis assumed treatment for only five years, and indeed none of the studies published5-10 has considered lifelong treatment, which is the likely consequence of initiating statin treatment. Calculations based on a shorter treatment duration may underestimate the cost effectiveness of treatment.
The use of statins for primary prevention is more complex. The results of the west of Scotland coronary prevention study (WOSCOPS)3 have shown that people with a CHD event rate of 1.5% per year will benefit from pravastatin treatment, but the number needed to treat (NNT) to prevent a major coronary event, 40, is much higher than for secondary prevention. There may be 3.8 million people in England who have this level of CHD risk and who might benefit from statin treatment for primary prevention.4 So far the debate on the use of statins for primary prevention has tended to adopt an “all or nothing” approach, with some arguing that treatment should be reserved for secondary prevention,11 while others argue that treatment should be made available for primary prevention to all who may benefit.12
The total cost of providing statin treatment for such large numbers in the population4 has underlined the importance of examining the cost effectiveness of statin treatment in subgroups of the population. Published estimates of cost effectiveness of statin treatment for primary prevention6 ,13-15 show extreme variation in the cost per life year gained, from £14 000 in US men with serum cholesterol at the 90th centile treated with lovastatin,13 to £297 000 for men 45–54 years old with serum cholesterol 6.6–7.2 mmol/l treated with simvastatin.6 These estimates for primary prevention were based on treatment targeted at threshold concentrations of serum cholesterol, which leads to treatment of many people who have a very low CHD risk, and a failure to treat many at high CHD risk.4 ,16 ,17
Cholesterol and other lipid fractions are by themselves very weak predictors of coronary risk,16 and there is broad agreement in recent guidelines that treatment is better targeted at a specified level of CHD risk than at an arbitrary cholesterol threshold.18-22 This approach is based on evidence that the relative risk reduction with statin treatment remains approximately constant,4 ,17 ,20 provided that low density lipoprotein cholesterol concentration is above 3.2 mmol/l2 so that the absolute benefit from treatment is determined by the absolute CHD risk. It follows that absolute CHD risk will also be a major determinant of cost effectiveness of treatment. A principal objective of this paper was to estimate the cost effectiveness of statin treatment in subgroups of the population at different levels of CHD risk.
A second major determinant of cost effectiveness of treatment is the cost of statin drugs. In the main analysis we have calculated the cost effectiveness of treatment with simvastatin at the mean dose used in 4S,1 and at the current price of £555 per year. However, the cost of statin treatment is likely to vary because of changes in the price of the drugs already available and the introduction of new statins, and also from country to country. We have therefore estimated the cost effectiveness of treatment with the price of statin treatment varying over the range £100 to £800 per year. These estimates of gross cost effectiveness, related to absolute CHD risk and to different prices for statins, will be applicable to different populations and different healthcare systems.
A third major determinant of cost effectiveness may be savings to health services as a result of statin treatment. In the outcome trials1-3 myocardial infarctions, coronary artery bypass grafts (CABGs), and percutaneous transluminal coronary angioplasties (PTCAs) were reduced by statin treatment, and corresponding reductions in hospital admissions and procedures are anticipated. The net cost effectiveness of treatment takes account of these savings, but cannot be generalised between populations or healthcare systems because savings will depend on procedure rates and their costs in different countries. We have estimated the net cost effectiveness of statin treatment using costs of healthcare for the UK, but present this as a sensitivity analysis because it is not generaliseable to other countries.
In summary, our main objectives were to examine the cost effectiveness of statin treatment in subgroups of the population at different levels of absolute CHD risk, and at different prices for statin treatment, assuming that treatment will be lifelong.
Methods
POPULATION GROUPS
The cost effectiveness of statin treatment was estimated for four groups of patients at different levels of CHD risk. (Throughout, we have defined CHD as definite plus probable or suspected fatal and non-fatal coronary events,1 ,3 excluding silent myocardial infarction.) The four groups are: CHD risk of 4.5% per year—secondary prevention; primary prevention at CHD risk of 3.0% per year; primary prevention at CHD risk of 2.0% per year; and primary prevention at CHD risk of 1.5% per year.
CHD risk of 4.5% per year—secondary prevention
Estimates of cost effectiveness of statin treatment in this group were based on patients in the 4S trial, who had a CHD risk of approximately 4.5% per year. We have estimated that patients requiring secondary prevention represent about 4.8% of the UK adult population.4 Included in this group also are subjects for primary prevention who have a similar very high CHD risk (4.5% per year) because of a combination of risk factors. Very few subjects for primary prevention have this level of CHD risk—approximately 0.3% of the UK adult population.4 Cost effectiveness in this group is assumed identical to that in the 4S trial because the absolute benefit from statin treatment is determined by the absolute CHD risk.
Primary prevention at CHD risk of 3.0% per year
Subjects for primary prevention at or above this level of CHD risk represent approximately 3.4% of the UK adult population.4For this group there is no direct trial evidence on which to calculate cost effectiveness, and our estimates are based on interpolation from the 4S and WOSCOPS trials.
Primary prevention at CHD risk of 2.0% per year
This level of risk was examined because it was targeted in the guidelines for lipid management of the European joint task force18; it has also been examined recently in a subgroup analysis of the WOSCOPS data.23 Again there is no direct trial evidence for this group, and estimates of cost effectiveness are based on interpolation from the 4S and WOSCOPS trials. Subjects for primary prevention above this level of risk represent about 11.0% of the UK adult population.
Primary prevention at CHD risk of 1.5% per year
This is the average level of CHD risk observed in the placebo group in the WOSCOPS trial. Estimates of cost effectiveness of statin treatment in this group are therefore based on data from WOSCOPS. Subjects for primary prevention above this level of risk represent about 19.6% of the UK adult population.4
CALCULATION OF COST EFFECTIVENESS
The current life table method was used to estimate the cost per life year gained by statin treatment in cohorts of patients of the same average ages as those in the 4S and WOSCOPS trials.24 All the patients in the WOSCOPS trial were men, and the number of women in 4S was too small to estimate reliably the effect of statin treatment on total mortality, so that direct estimates of cost per life year gained were only possible for men. However, the relative risk reduction in coronary events by statin treatment in women is at least as high as that in men,1 ,2 and absolute benefit and cost effectiveness will therefore be independent of sex at any given level of absolute risk. The method used to calculate cost per life year gained is described in detail later.
ASSUMPTIONS USED IN CALCULATING COST EFFECTIVENESS
Drug doses and costs
For each of the four risk groups the cost per life year gained was estimated assuming treatment with simvastatin at the average dose used in the 4S trial (27.4 mg daily). Drug costs were taken from the British National Formulary (March 1997)25 and were £1.52 per day (£555 per year). We assume that the relative risk reduction by simvastatin for primary prevention will be the same as that observed with pravastatin in WOSCOPS.3 This may be conservative, because simvastatin reduced cholesterol by 25% in 4S1compared to the 20% reduction with pravastatin in WOSCOPS3 and the cholesterol and recurrent events (CARE) trial.2 In the sensitivity analysis estimates of cost per life year gained are presented for treatment with pravastatin at the dose used in WOSCOPS, and CARE (40 mg daily), at a cost of £2.22 per day (£811 per year).
Duration of treatment
In the main analysis the cost effectiveness of statin treatment was calculated assuming that patients are treated for life, and that the relative risk of dying in the statin and placebo groups remains constant throughout life at the level observed during the trials. It is improbable that benefit would increase after the trial period, and therefore life years gained are unlikely to be greater than this. In a sensitivity analysis it was assumed that treatment was for five years, which was approximately the duration of the trials, and that the relative risk of dying reverted from that observed during the trials to 1—that is, an equal risk in both patient groups—immediately after treatment stopped. In practice treatment is unlikely to be stopped after five years and we consider this to be a realistic minimum estimate of the cost effectiveness of statin treatment. However, this requires fewer assumptions because trial evidence is available only for five years of treatment. (The worst case scenario for cost effectiveness would be statin treatment continued for life but with no benefit after five years. We have not estimated cost per life year gained for this very pessimistic assumption.)
Effectiveness of statin treatment in the four CHD risk groups
Secondary prevention
For the life table a cohort of men of the same average age (58 years) as the 4S cohort was used. The annual probability of dying at any age was calculated from age specific mortality rates for men in the UK population provided by the government Actuary’s Department. The mortality of men on placebo during the 5.4 years of the 4S trial was 1.74 times that of men aged 58–64 years in the UK general population. That ratio (1.74) was assumed to remain constant for life. The annual probability of dying in any given year in the cohort treated with simvastatin was calculated by multiplying the annual probability in the placebo cohort by the relative risk of all cause mortality observed for treated men in the 4S trial, which was 0.66. Again this was assumed to remain constant for life.
Primary prevention at 1.5% annual CHD risk—The cohort used in the life table was men of the same average age (55 years) as the WOSCOPS cohort. The mortality of men on placebo during the 4.9 years of the WOSCOPS trial was 0.87 times that for men aged 55–69 years in the UK general population. (The lower mortality of placebo treated men in WOSCOPS than in the UK general population is presumably a consequence of exclusion from the trial of many high risk patients. For example, patients with previous myocardial infarction were excluded from WOSCOPS but are present in the general population.) This ratio (0.87) was assumed to remain constant for life. The annual probability of dying in any given year in the statin treated cohort was calculated by multiplying the annual probability in the placebo cohort by the relative risk of all cause mortality for men observed in WOSCOPS (0.78). Again this was assumed to remain constant for life.
Primary prevention at 2.0% and 3.0% annual CHD risk—There is no direct trial evidence on which to base calculations of cost effectiveness for primary prevention in subjects at these levels of CHD risk. Interpolation from the 4S and WOSCOPS trials was therefore used as described below. The cohorts used were men aged 55 years. The CHD mortality of untreated men was calculated assuming that the ratio of coronary deaths to coronary events was 0.25, as observed in WOSCOPS. Non-coronary mortality was assumed equal to that observed in WOSCOPS. Given these assumptions, mortality on placebo was estimated as 1.29 times that for men aged 55–60 years in the UK population for the 3.0% annual CHD risk cohort, and 1.03 times for the 2.0% annual CHD risk cohort. These ratios were assumed to remain constant for life.
The annual probability of dying in any given year in the statin treated cohorts was calculated by multiplying the annual probability in the placebo cohorts by the relative risk for all cause mortality during statin treatment. The all cause mortality relative risk during statin treatment was estimated by interpolating from the 4S and WOSCOPS trial results. Since the relative risk reduction in coronary deaths and events produced by statins is constant, reduction in overall mortality is higher in populations at higher risk of CHD. Using published data26 we found the relation between CHD risk and relative risk for all cause mortality to be approximately linear between annual CHD event risks of 1.5% and 4.5%. This line predicts all cause mortality relative risks of 0.72 and 0.76, respectively, for primary prevention at 3.0% and 2.0% annual CHD risks.
CALCULATION OF COST PER LIFE YEAR GAINED
Calculation of life years gained using the life table method
The survival curves for placebo and statin treated patients during the 4S and WOSCOPS trials were used to calculate life years gained with statin treatment by extrapolating the survival curves beyond the end of the trials, assuming first that statin treatment would be lifelong, and second that treatment would continue for five years only. The life table method involves construction of a table to calculate the mortality experience of a cohort of people. The cohorts used were 1000 men on simvastatin with the same average age as patients in 4S, and 1000 men on pravastatin with the same average age as subjects in WOSCOPS. In each cohort the mortality experience predicted for men on statin treatment was compared with that of men on placebo. The life years gained by treatment are the difference between the total life years lived by those on statin treatment and those on placebo. In each instance the 1000 men were assumed to be the same age. In the first year a small number of each cohort will die, calculated by multiplying the annual mortality rate for men of that age by the number alive at the beginning of the year. The number surviving at the beginning of the following year is then 1000 minus the number who died during the first year. The number dying during each of the following years is calculated in the same way. The number of life years lived in each year is then the number of men who are alive at the end of each year plus half of the deaths during that year. The deaths in a given year will occur at varying times, some early and some late. It is assumed that they occur halfway through the year, on average, so that each death contributes half a year towards the total of life years lived. The total life years for each cohort is the sum of the life years lived for each year. The life years gained by statin treatment are the total life years lived by the statin cohorts minus the life years lived by the placebo cohorts.
Cost per life year gained
The cost per life year gained is the cost of statin treatment for the whole cohort divided by the number of life years gained. The total drug costs were based on the number of patients alive and eligible to receive treatment at the start of each year of follow up—that is, the total number of treatment years provided multiplied by the annual cost of drugs per patient. Excluded were any costs relating to medical, nursing, or laboratory services.
Calculation of possible savings
Cost effectiveness may be calculated as gross cost per life year gained, which ignores any savings to the health service, or net, which takes account of savings which may accrue. In both trials myocardial infarction, CABGs, and angioplasties were reduced by statin treatment, and a corresponding reduction in hospital admissions is expected. Health service savings on procedures and admissions may partly offset the costs of drug treatment. These savings were estimated using UK data for the costs of hospital treatment from Newcastle-upon-Tyne in 1991.27 According to data from the Audit Commission28 the cost of CABG has risen by approximately 28% since 1991, and we have therefore inflated the costs reported from Newcastle-upon-Tyne by this amount. These updated costs were: for CABG £5500; PTCA £3517; admission for myocardial infarction £1887; and admission for other CHD diagnoses £1471. These costings were applied to events as reported in the primary WOSCOPS report.3 For the 4S cohort, events reported in detail in a follow up paper were used.29 The CABG rate in Scandinavia is approximately double that in the UK,28 and it was therefore assumed that only half of the CABGs and angioplasties prevented in 4S would be avoided in UK practice. It may be argued that the lower UK rate represents suboptimal practice, but the difference does exist and should be taken into account when calculating potential savings. Estimates of net cost effectiveness are presented as a sensitivity analysis because savings may not be realised, and because they cannot be generalised to other populations or healthcare systems.
Discounting of costs and benefits
Costs and benefits occurring in the future may be valued less than those occurring now. The cost effectiveness estimates were therefore calculated using a 6% per annum discount rate for drug costs, potential savings, and life years gained, as recommended for public expenditure by the UK Treasury.30 There is considerable debate over whether health benefits should be discounted, and therefore the undiscounted estimates are also presented.
SENSITIVITY ANALYSES
The main analysis presented is the gross discounted cost per life year gained assuming lifelong treatment with simvastatin. For primary prevention the relative risk for all cause mortality was assumed to be 0.72 at CHD event risk of 3.0% per year, and 0.78 at CHD event risk of 2.0% per year, as described above. To test the robustness of the results with different values for key variables31 the following sensitivity analyses are also presented:
net rather than gross cost effectiveness
five year treatment rather than lifelong treatment
undiscounted rather than the 6% discount rate
costs for pravastatin rather than simvastatin treatment
for primary prevention at annual CHD risks of 2.0% and 3.0%, calculations using relative risk for all cause mortality of 0.66 (4S) or 0.78 (WOSCOPS), rather than the interpolated relative risks used for the main results.
Results
The gross discounted cost per life year gained assuming lifelong treatment with simvastatin is shown for groups at the four CHD risk levels in table 1. This table shows the marginal cost per life year gained when treatment is extended from a higher to a lower CHD risk threshold for treatment. Marginal costs are shown because average costs will disguise the effects of extending treatment to groups at lower CHD risk, where benefit may be very expensive. For secondary prevention, and by extrapolation, for primary prevention in subjects with a very high annual CHD event risk of 4.5%, the gross discounted cost per life year gained is £5100. For primary prevention in subjects with a 3.0% annual CHD event risk, the gross discounted cost per life year gained is £8200; at a 2.0% annual CHD event risk it is £10 700; and at a 1.5% annual CHD event risk it is £12 500.
Implications of targeting statin treatment at four CHD risk levels, showing cost per life year gained at 4.5% annual CHD risk, and marginal cost per life year gained by extending treatment to 3.0%, 2.0%, and 1.5% annual CHD risk levels
Estimates of the net cost per life year gained (table 1) are lower than the gross estimates, indicating that cost effectiveness will increase if health service savings related to events prevented by statin treatment are actually realised. This enhancement of cost effectiveness is most notable for secondary prevention, with cost per life year gained falling from £5100 to £4300. In relative terms, cost effectiveness is enhanced less for primary prevention treatment at the lowest CHD event risk (1.5% per year), from £12 500 to £11 800. The results of the other sensitivity analyses are also shown in table1. The undiscounted estimates of cost per life year gained are considerably lower than those discounted at 6%. If one assumes only five years of treatment and no continuing benefit the estimates of cost per life year gained are considerably higher than those for lifelong treatment. For example, for primary prevention at a CHD event risk of 3.0% per year the cost per life year gained by five years’ treatment is £15 800 compared to £8 200 for lifelong treatment.
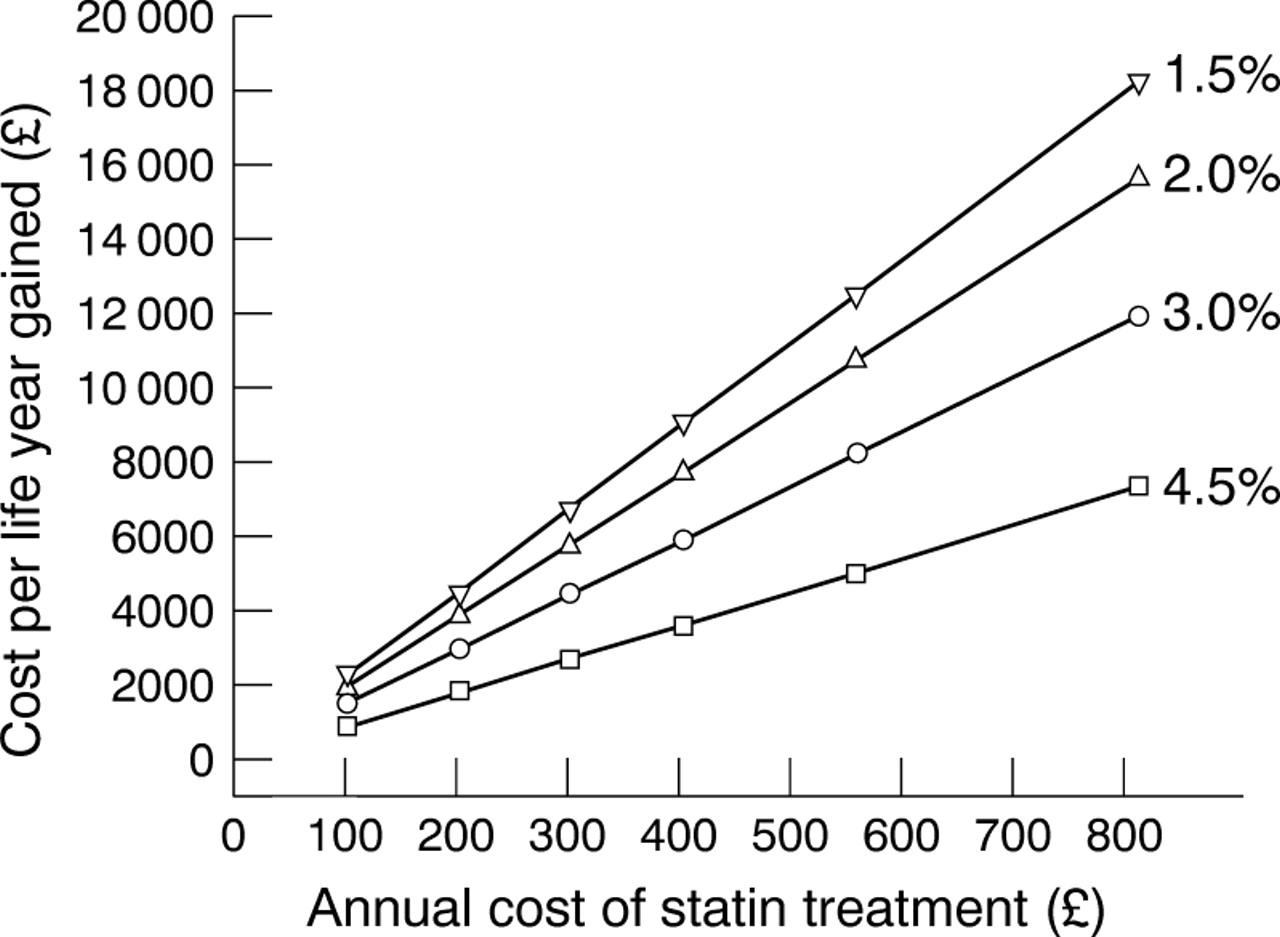
Estimates of cost per life year gained, assuming treatment with pravastatin at a dose of 40 mg daily, are considerably higher than those for treatment with simvastatin at a dose of 27.4 mg daily. If simvastatin treatment for primary prevention at the 3.0% and 2.0% annual CHD event risks produced the relative risk reduction observed in 4S (0.66), the cost per life year gained would be lower (£6600v £8200 for 3.0% per year, and £7300v £10 700 for 2.0% per year). If simvastatin treatment produced the relative risk reduction observed with pravastatin in WOSCOPS (0.78), the cost per life year gained would be higher (£10 700 v £8200 for 3.0%, and £11 800 v £10 700 for 2.0% per year). Setting aside questions on discounting and potential savings, and assuming lifelong treatment, the most important influences on cost per life year gained are the level of CHD risk targeted for treatment and the cost of statin treatment. The effect of the CHD risk targeted for treatment on estimates of cost effectiveness is shown in fig 1. The influence of the cost of statin treatment over a range £100 to £811 annually for the different levels of CHD risk targeted is shown in fig2.
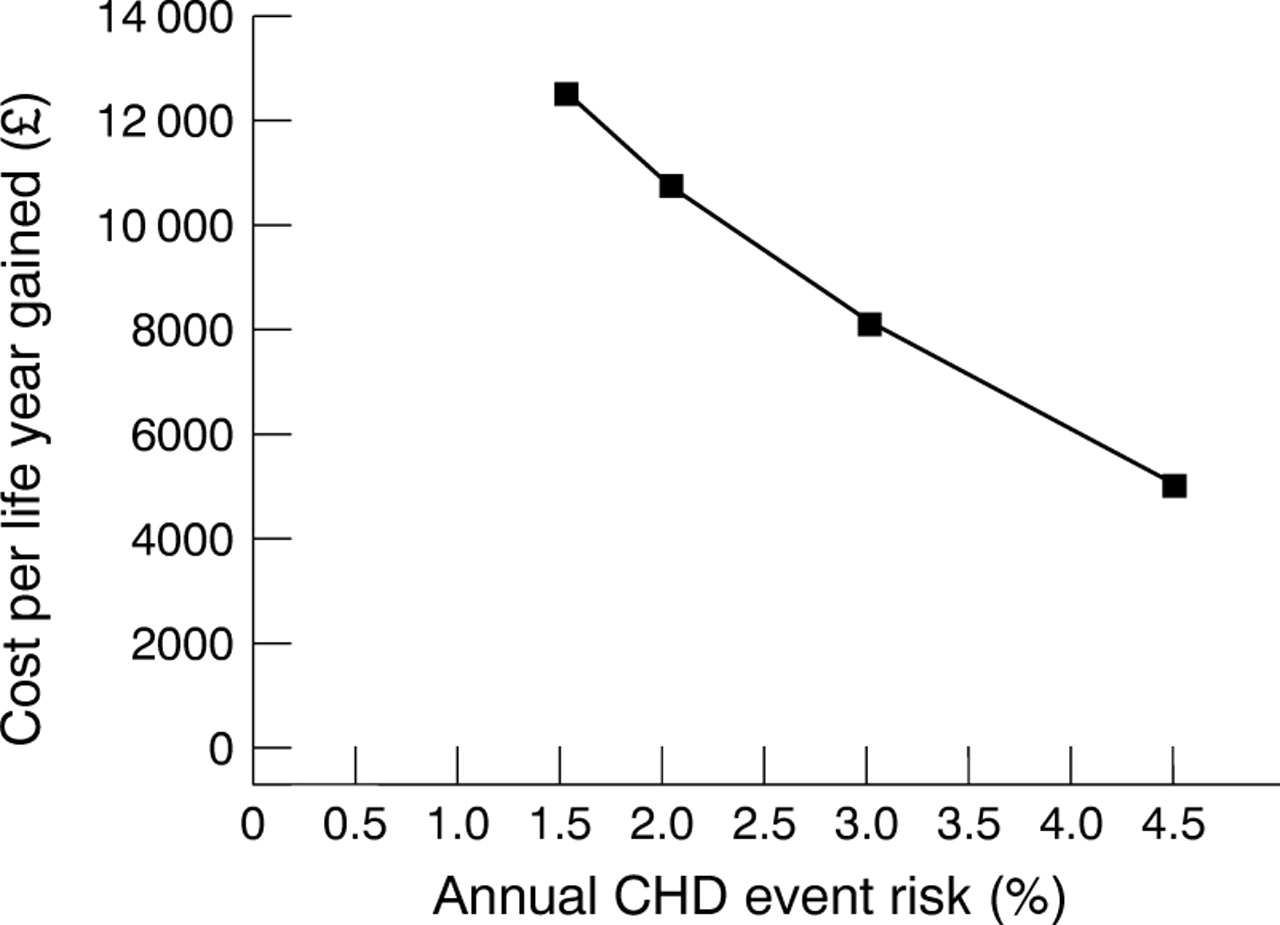
Cost per life year gained related to the annual risk of CHD targeted for treatment, assuming lifelong treatment with simvastatin.

Marginal cost per life year gained assuming lifelong treatment with a statin, related to the annual cost per person of statin treatment, at CHD event risks of 4.5%, 3.0%, 2.0%, and 1.5% per year.
Discussion
This analysis highlights three important determinants of the cost effectiveness of statin treatment, namely the level of absolute CHD risk targeted, the price of the drug used, and possible savings in health service costs.
ABSOLUTE CHD RISK TARGETED
The benefits and cost effectiveness of statin treatment are higher at higher levels of CHD risk (fig 1), which can be used to estimate cost effectiveness at levels of CHD risk different from those presented. Our estimate at a CHD event rate of 4.5% per year, £5100 per life year gained, represents the cost effectiveness of secondary prevention with simvastatin after myocardial infarction, and is similar to previous estimates5-10— for example, £5502 per life year gained for five years’ treatment,5 or £6000 per life year gained in men aged 55–64 years for 10 years’ treatment.6 Our estimate is slightly lower because we have assumed lifelong treatment, which is the likely consequence of starting treatment. Previous analyses of the cost effectiveness for primary prevention with statins have varied widely, between £14 00013 and £297 0006 per life year gained, because they were based on treating cholesterol thresholds and not CHD risk thresholds. Treatment is better targeted at estimated CHD risk, which determines benefit,4 ,16-22 and cholesterol per se is a very weak predictor of CHD risk.16 We estimate that the cost per life year gained for simvastatin treatment at a CHD event risk of 3.0% per year is £8200. This risk stratum includes people free from overt vascular disease who require primary prevention (approximately 3.4% of the UK adult population4) and also patients with established vascular disease but a CHD risk lower than those included in the 4S study. For example, patients with previous myocardial infarction and relatively low serum cholesterol2 or with stable angina32 have approximately this level of risk. Treatment targeted at a CHD event risk of 2.0% per year, as suggested in previous European task force guidelines18 and in a subgroup analysis of WOSCOPS,23 would cost £10 700 per life year gained. Treatment targeted at a CHD event risk of 1.5% per year, the average for men included in WOSCOPS,3 cost £12 500 per life year gained.
COST OF STATIN TREATMENT
As expected, the cost effectiveness of statin treatment is sensitive to the price of the drug used. The relation between the cost per life year gained and the annual cost of drug treatment for the four levels of CHD risk examined is shown in fig 2. This figure can be used to assess cost effectiveness when the price of statins changes, as it inevitably will do, but with important caveats. The cost of any statin considered must be the cost of the dose that will lower serum cholesterol by an average of 20–25%, as was the case with simvastatin and pravastatin in the outcome trials.1-3 Additional assumptions necessary are that the benefits of statin treatment are a class effect, and not specific to simvastatin and pravastatin, and that other statins are equally safe during long term treatment. Figure 2shows that treatment at the lower CHD risk levels, 1.5% or 2.0% per year, is expensive at the current cost for pravastatin (£888 per year) or simvastatin (£555 per year). However, the spread of cost effectiveness over the four CHD risk groups will narrow considerably as the cost of statin treatment falls. If the cost of statin treatment falls to £300 per year or lower, treatment of those with a CHD event risk of 1.5% per year would become as cost effective as other treatments in wide use.33
In calculating the cost of statin treatment we have assumed 100% compliance, even though in the trials compliance fell to about 70% by five years. Since we do not know when trial patients became non-compliant, we cannot calculate the exact cost of the benefits seen in the trial. We have therefore estimated costs assuming 100% compliance, a conservative assumption in line with published recommendations.34
SAVINGS IN HEALTH SERVICE COSTS
The estimates of gross cost effectiveness related to CHD risk at different prices of statin treatment should be largely generaliseable to different populations and healthcare systems. However, those for net cost effectiveness are not generaliseable and may also be less reliable. It is not certain that savings will actually be realised, and furthermore the estimates are highly dependent on the costs of healthcare and rates of interventions in different countries. Table 1shows that estimated savings using costs of healthcare for the UK have a relatively small impact, increasing cost effectiveness by only £600 to £800 per year at all levels of CHD risk examined. Thus at current prices the cost effectiveness of treatment at a CHD event rate of 1.5% per year remains relatively low, even when potential savings are considered. The impact of healthcare savings on cost effectiveness may be substantially greater in countries that have higher rates than the UK for coronary intervention procedures.
DEVELOPING TREATMENT POLICY
Cost effectiveness is only one of several important considerations when developing a treatment policy.4 Others include the NNT, a simple and useful measure of absolute benefit from treatment35; the proportion of the population that will be treated as a consequence of any policy4; and the total cost of treatment.4 These variables have been examined previously,4 ,36 and are summarised for the four levels of CHD event risk in table 2. The data in table 2 provide a sound basis from which to formulate treatment policy, and we believe that similar analyses should be performed for other treatments or interventions. The figures for NNT and gross cost effectiveness should be generaliseable to different populations or healthcare systems, whereas the proportion of the adult population to be treated and the total cost of treatment are specific to the UK.4 In populations with a lower prevalence of CHD risk factors, or lower CHD risk in relation to the major risk factors, the proportion of the population to be treated and total cost of treatment will be lower than for the UK. This is likely to be the case for Mediterranean and Far Eastern countries.
Implications of targeting statin treatment at four CHD risk levels, showing the number needed to treat, cost effectiveness, and implications for the UK population
From the data shown in table 2 we have suggested21 ,22that a realistic policy for the UK would be to target for treatment initially all patients with overt atherosclerotic vascular disease (secondary prevention) and those free from vascular disease who have an estimated CHD event risk of 3.0% per year. The NNTs (13 and 20) and cost per life year gained (£5100 to £8200) for these groups are comparable to those of other treatments in wide use.33 For example, published studies have estimated the cost per life year gained by CABG in men with severe angina and three vessel disease to be approximately £8000.33 However, complete implementation of statin treatment for these high risk groups alone will entail treating about 8% of the adult population of the UK, and an annual cost equivalent to 25% of the present expenditure on community prescribed medicines at current prices.36
Table 2 shows that implementing treatment at lower levels of CHD risk—for example, primary prevention at 2.0% or 1.5% per year—will present considerable difficulty in the UK. The NNTs (30 and 40) may well be acceptable to individuals, but the cost per life year gained (£10 700 to £12 500) is relatively high. Furthermore, the proportion of the adult UK population requiring treatment at these CHD risk levels (16–25%) is daunting, particularly considering that the use of lipid lowering drugs is starting from a very low baseline in the UK. Benefits from statin treatment have more recently been shown in patients at CHD risks as low as 0.5% per year37 and even larger proportions of the UK population would be eligible for treatment using this threshold. The annual cost of full implementation at a CHD event risk of 1.5% per year in the UK would consume almost 90% of the current expenditure on drugs, and at a CHD event risk of 2.0% per year about 50% of the current community drug bill.36 It would seem unrealistic to implement these policies immediately, unless the costs of statin treatment were to fall substantially (fig 2). The evidence from the recent controlled trials with statins thus presents an immense dilemma for countries such as the UK that have a very high CHD risk. Treatment with statins at a CHD event rate of 1.5% per year is clearly evidence based, yet Archie Cochrane’s plea38that all effective treatments be made available appears unsustainable at current levels of funding and health service resources.
A treatment policy based on absolute risk cannot succeed unless simple practical methods for estimating CHD risk are available for doctors in ordinary practice. Statin treatment will be prescribed largely in primary care, and experience with other treatments has shown the difficulty of ensuring priority for patients who will benefit most, and that treatment is made available to all who should receive it.39 ,40 There is general agreement that the first priority should be treatment of those who already have overt vascular disease, because of their high CHD risk, and these patients can be identified with relative ease. For primary prevention treatment decisions should not be based on levels of cholesterol or lipid fractions alone,16 nor on intuitive assessment of CHD risk which is generally inaccurate.41 ,42 The Sheffield table16 ,20 ,21 is a simple method that identifies those free from vascular disease who should have their cholesterol measured, and identifies those who have an annual CHD event risk of approximately 3% who should be considered for statin treatment.
Acknowledgments
We acknowledge the help of the government Actuary’s Department, the support team of the Trent Working Group on Acute Purchasing, ScHARR, and Mrs Lizzie Lister.