Article Text

Abstract
OBJECTIVE To assess independent determinants of beat to beat variation in left ventricular performance during atrial fibrillation.
DESIGN Prospective study.
SETTING University hospital.
PATIENTS Seven patients with chronic non-valvar atrial fibrillation.
INTERVENTIONS Invasive and non-invasive haemodynamic variables were assessed using a non-imaging computerised nuclear probe, a balloon tipped flow directed catheter, and a non-invasive fingertip blood pressure measurement system linked to a personal computer.
MAIN OUTCOME MEASURES Left ventricular ejection fraction, left ventricular volume, ventricular cycle length, pulmonary capillary wedge pressure, and measures of left ventricular afterload (end systolic pressure/stroke volume) and contractility (end systolic pressure/end systolic volume) were calculated on a beat to beat basis during 500 consecutive RR intervals. A statistical model of the beat to beat variation of the ejection fraction containing these variables was constructed by multiple regression analysis.
RESULTS Positive independent relations with ejection fraction were found for preceding RR interval, contractility, and end diastolic volume, while inverse relations were found for afterload, preceding end systolic volume, and preceding contractility (all variables, p < 0.0001). A relatively strong interaction was found between end diastolic volume and afterload, indicating that ejection fraction was relatively more enhanced by preload in the presence of low afterload.
CONCLUSIONS The varying left ventricular systolic performance during atrial fibrillation is independently influenced by beat to beat variation in cycle length, preload, afterload, and contractility. Beat to beat variation in preload shows its effect on ventricular performance mainly in the presence of a low afterload.
- atrial fibrillation
- contractility
- haemodynamic variables
Statistics from Altmetric.com
The randomly irregular ventricular response to atrial fibrillation1 not only causes an irregular but also an unequal pulse.2 ,3 Beat to beat variation in ventricular performance has been ascribed to variations in the length of the preceding heart period,2 beat to beat variation in preload by means of the Frank–Starling mechanism,4 beat to beat variation in afterload,5 ,6 beat to beat variation in contractility, acting either by the interval–contractility relation7 or by means of postextrasystolic potentiation,8 or a combination of these factors.9 In a previous study of left ventricular beat to beat performance in patients with non-valvar atrial fibrillation, we showed that the interval–force relation rather than the Frank–Starling mechanism explained the varying left ventricular systolic performance during atrial fibrillation over the entire range of RR intervals.9 The contribution of beat to beat variation in preload—that is, the Frank–Starling mechanism—to varying left ventricular function during atrial fibrillation was limited to short preceding intervals. The contribution of aortic impedance, that is afterload, as well as other beat to beat regulatory mechanisms, including the positive and negative effects of ejection10 ,11 and the preceding beat contraction history12 could not be evaluated owing to the absence of simultaneous measurement of left ventricular volume and (aortic) pressure measurement on a beat to beat basis.
Our aim in the present study was therefore to assess the proportion to which the haemodynamic regulatory mechanisms determine the beat to beat variation in left ventricular performance during atrial fibrillation. For this purpose we used a non-imaging computerised nuclear probe13 ,14 which allowed beat to beat left ventricular volume measurement and invasive and non-invasive haemodynamic monitoring. In this way we collected extensive haemodynamic data on a beat to beat basis in a large number of consecutive beats.
Methods
PATIENTS AND STUDY PROTOCOL
Seven patients with chronic atrial fibrillation were included (table 1). To avoid blunting of cycle length dependent haemodynamic changes by valvar heart disease, in particular mitral stenosis,3 ,4 only patients with non-valvar atrial fibrillation were studied. Before the study, all patients underwent M mode and Doppler echocardiography. All antiarrhythmic drugs, including digitalis and calcium antagonists, were stopped at least five drug half lives before the study. The study was approved by the institutional review board and written informed consent was given by all seven patients.
Baseline characteristics of the seven study patients and mean (SD) values of measured and calculated independent variables determining left ventricular ejection fraction over 500 consecutive cycles, arranged by ejection fraction
NUCLEAR PROBE
To measure relative left ventricular volumes on a beat to beat basis, a commercially available non-imaging computerised nuclear probe (Nuclear Stethoscope, Bios, Valhalla, New York, USA) was used.14 ,15 Methods have been described previously by our group.9 ,16 In short, equilibrium blood pool labelling was obtained by the in vivo labelling of red blood cells with 20 mCi99mTc. To search for the optimal position of the detector, the technique recommended by the manufacturer was used—monitoring of the continuously displayed values of stroke counts and ejection fraction.14 At the optimal left ventricular position, the values of stroke counts and ejection fraction were maximal, and minimal for the background position. The analogue output from the probe, as well as the ECG, was fed into a personal computer with custom developed software. This system allowed continuous real time display and permanent recording of a simultaneously acquired high temporal resolution radionuclide left ventricular time–activity curve (or background activity level), and an ECG signal. After final probe positioning, beat to beat data were acquired during 500 consecutive beats. Beat to beat analysis of the time–activity curve allowed instantaneous assessment of relative left ventricular volume.
HAEMODYNAMIC MEASUREMENTS
A balloon tipped flow directed catheter (Swan-Ganz) was used to measure pulmonary capillary wedge pressure on a beat to beat basis. Directly before the start of the recording of 500 consecutive beats per patient, cardiac output was measured using the thermodilution method. The mean value of three measurements was used to calculate the individual factor which allows the conversion of measured counts to millilitres. This factor equals the ratio of cardiac output and the product of stroke counts and heart rate. Peripheral blood pressure was assumed to change in parallel with aortic pressure. To measure peripheral blood pressure a non-invasive fingertip blood pressure measurement system (Finapres, Ohmeda TM 2300, Inglewood, Colorado, USA) was used which allows accurate measurement of systolic and diastolic blood pressure on a beat to beat basis (comparable with intra-arterial measurement17). In essence, the method is based on a control loop, consisting of an inflatable finger cuff equipped with an infrared photoplethysmographic device to measure the finger artery blood volume under the cuff.18 The system is set to maintain a null transmural pressure. Changes in arterial blood volume caused by pressure changes, detected by plethysmography, are counteracted by means of a fast electropneumatic servo system which modulates the cuff pressure.
DATA PROCESSING.
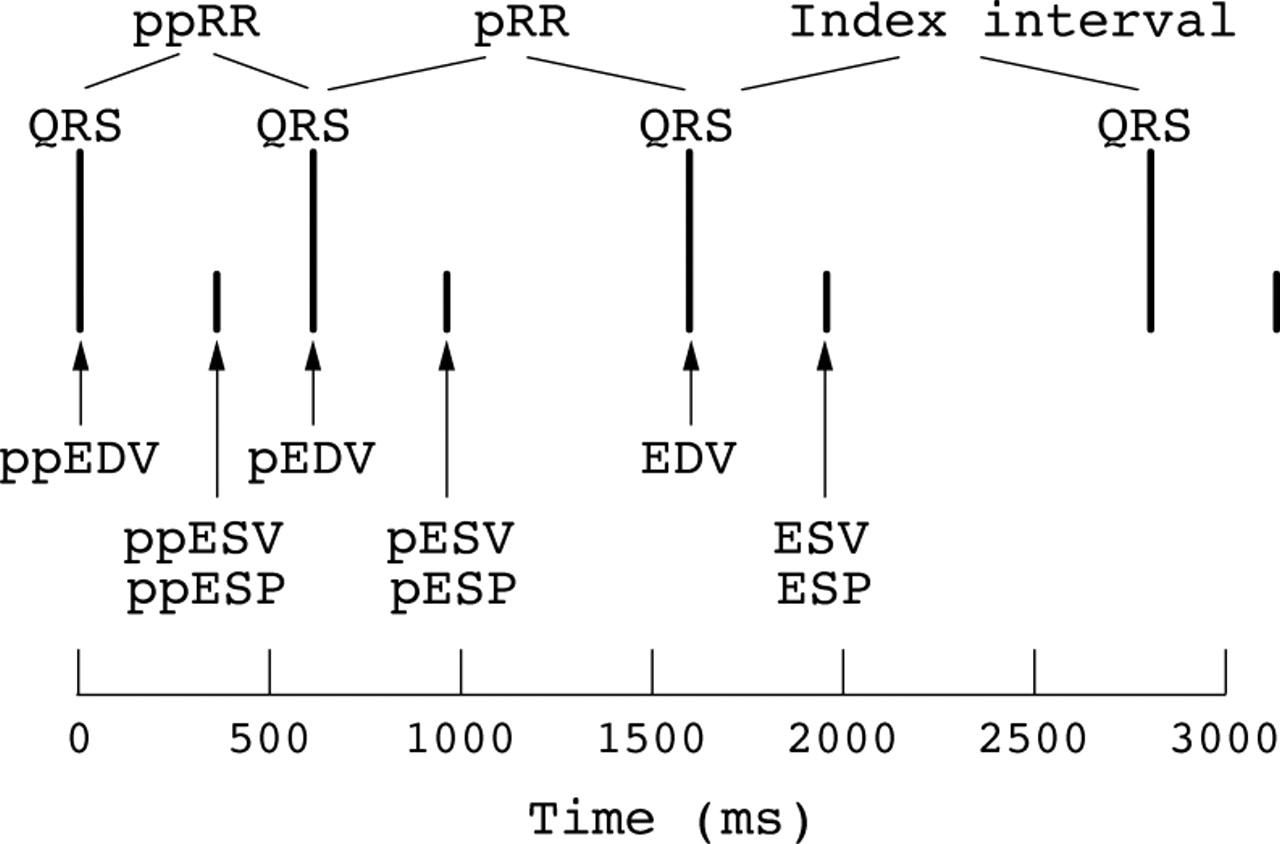
The data obtained were simultaneously fed into a personal computer, enabling accurate beat to beat calculation (and storage) of ejection fraction, left ventricular volume, left ventricular cycle length, pulmonary capillary wedge pressure, and peripheral blood pressure in a large number of consecutive beats (fig 1). Using these pressure and volume data, left ventricular afterload of the index interval was defined as the ratio of end systolic pressure and stroke volume (ESP/SV),19 ,20 and left ventricular contractility of the index interval as the ratio of end systolic pressure and end systolic volume (ESP/ESV).21 In this way, left ventricular afterload and left ventricular contractility values of the index interval, preceding interval, and pre-preceding interval were calculated on a beat to beat basis. Pulmonary capillary wedge pressure (PCWP) and end diastolic volume (EDV) were used as indices of left ventricular preload of the index interval.

Schematic drawing showing the relation between the QRS complex on the ECG, the definition of the index interval, preceding and pre-preceding interval (pRR and ppRR, respectively), and the timing of the volume and pressure measurements. During the index interval, EDV (end diastolic volume), ESP (end systolic pressure), and ESV (end systolic volume) were measured. During the preceding interval, pEDV, pESP, and pESV (indicating preceding EDV, ESP, and ESV, respectively), and during the pre-preceding interval ppEDV, ppESP, and ppESV (indicating pre-preceding EDV, ESP, and ESV, respectively) were measured.
STATISTICAL ANALYSIS
The validity of a multivariate model of left ventricular beat to beat performance in atrial fibrillation, described previously by our group,9 was tested using the same non-invasive haemodynamic variables measured in the present patients—that is, preceding RR interval, pre-preceding RR interval, end diastolic volume, and preceding end systolic volume. A measure of the fit of a model to the data, in this study left ventricular ejection fraction, was the model correlation (R 2).
To estimate univariate associations with the dependent variable left ventricular ejection fraction, the independent factors from our previous model were analysed together with the following newly measured and calculated factors: pulmonary capillary wedge pressure, afterload, contractility of the index cycle, contractility of the preceding cycle, and contractility of the pre-preceding cycle. The significant variables describing ejection fraction in our previous model were complemented by the haemodynamic factors obtained in the present study which showed significant univariate associations with ejection fraction (p < 0.05), to assess independent determinants of the ejection fraction in a mixed effects model. In this model the variation between the patients was included as an additive variation term. Using a backward selection method, variables with at test parameter < 10 were deleted from the model. Clinically relevant potential one way interaction terms were evaluated in addition. The independent variables were introduced as centred terms, by subtracting the mean.
Results
The same results as before were derived when the non-invasive variables describing a previous multiple regression model of left ventricular ejection fraction9 were obtained from the present patients and fitted into the previous model. The model correlation (R 2) was now 0.70, comparable to the value found previously (0.73). After adding the new variables (pulmonary capillary wedge pressure, left ventricular afterload, left ventricular contractility of the index beat, contractility of the preceding beat, and contractility of the pre-preceding beat), the final model used the following equation:

where EF is the left ventricular ejection fraction; P1to P7 are effects for the seven patients; β1to β7 are regression coefficients for the independent variables and their interaction terms, which determine left ventricular ejection fraction; pRR is the preceding RR interval; EDV is end diastolic volume; pESV is preceding end systolic volume; ESP/SV is the ratio of end systolic pressure and stroke volume; and ESP/ESV and pESP/pESV are the ratios of end systolic pressure and end systolic volume of the index beat and of the preceding cycle, respectively. In addition, the model shows one interaction term. The model correlation (R 2) in the new model was 0.87.
Baseline characteristics of the seven study patients, individual echocardiographic dimensions, ejection fractions, and haemodynamic measurements, as well as their ranges during 500 consecutive cardiac cycles, are shown in table 1. Table 2 summarises the results of the univariate correlation analysis. Pulmonary capillary wedge pressure was the only variable which had only a weak correlation with ejection fraction in the univariate analysis (p > 0.01). All other variables tested had significant univariate correlations with ejection fraction (p < 0.01). The strongest univariate correlations were present between ejection fraction and preceding RR interval, end diastolic volume, contractility, and afterload (all ttest parameters > 10). The relations between these independent variables and the dependent variable left ventricular ejection fraction and are illustrated in figs 2 to 5. Figure 2 shows the positive relation between preceding RR interval and ejection fraction in one of the patients. Figure 3 shows the positive relation between end diastolic volume and ejection fraction in the same patient. Figure 4shows an example of the positive relation between contractility of the index cycle (ESP/ESV) and left ventricular ejection fraction. Figure 5shows an example of the inverse relation between afterload (ESP/SV) of the index cycle and left ventricular ejection fraction.
Independent variables and their univariate associations (t values) with left ventricular ejection fraction

Positive relation between preceding RR interval and left ventricular (LV) ejection fraction in one of the patients. There is a curvilinear relation with ejection fraction, remaining rather constant at long RR intervals.
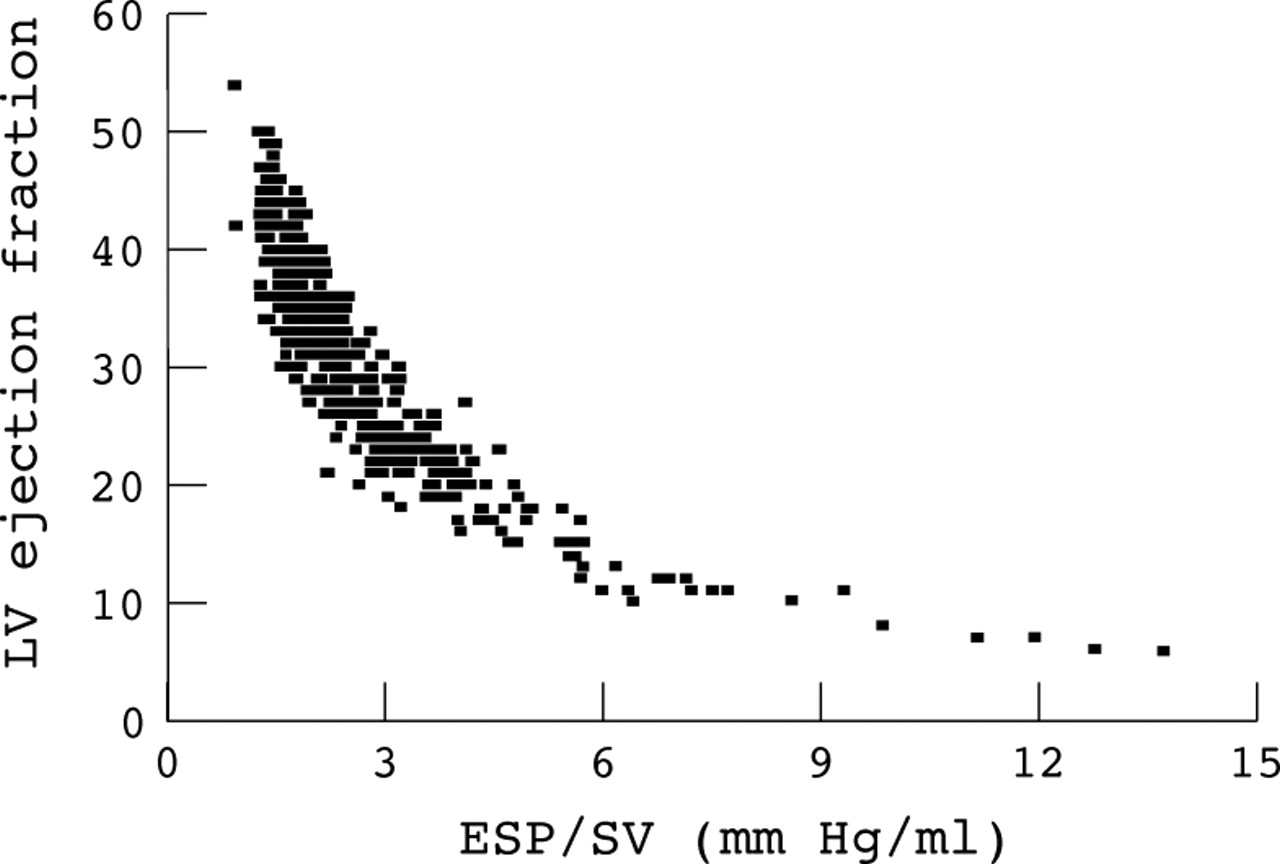
Example of the negative relation between left ventricular (LV) afterload of the index cycle (ESP/SV indicates the ratio of end systolic pressure and stroke volume) and LV ejection fraction.
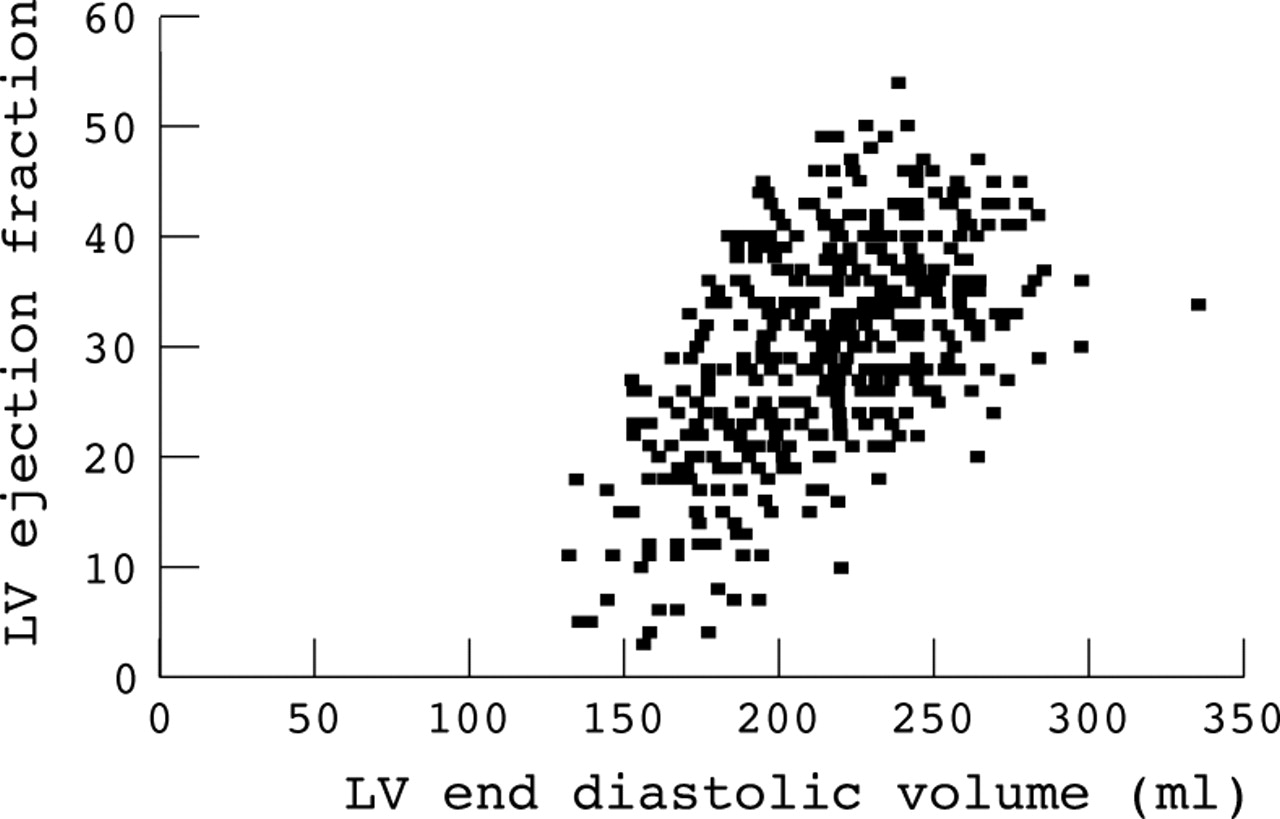
Positive relation between left ventricular (LV) end diastolic volume and LV ejection fraction in the same patient as in fig2.

Example of the positive relation between left ventricular (LV) contractility of the index cycle (ESP/ESV indicates the ratio of end systolic pressure and end systolic volume) and LV ejection fraction in the same patient as in fig 2.
MULTIPLE REGRESSION ANALYSIS
Table 3 summarises the factors to which ejection fraction was significantly related in the multiple regression analysis. Preceding RR interval, left ventricular end diastolic volume, and left ventricular contractility of the index beat showed an independent positive relation with ejection fraction, whereas the preceding end systolic volume, the left ventricular afterload of the index beat, and the contractility of the preceding beat showed an independent inverse relation with ejection fraction.
Independent variables and their association with left ventricular ejection fraction with multiple regression analysis 3-150
EFFECTS OF INTERACTIONS ON LEFT VENTRICULAR EJECTION FRACTION
There was one separate statistically significant one way interaction term which met the criteria for staying in the final model (table 3). Figure 6 illustrates the influence of the interaction between left ventricular end diastolic volume and afterload of the index beat. For a given end diastolic volume, the ejection fraction was relatively less enhanced if the afterload was high, whereas with low afterload, end diastolic volume had a greater effect on the ejection fraction.

Effect of the interaction between left ventricular (LV) afterload (ESP/SV indicates the ratio of end systolic pressure and stroke volume) and LV end diastolic volume (EDV) on LV ejection fraction. The curves are based on the multiple regression model. All other variables were fixed on their mean value. With rising afterload, ejection fraction decreases. The interaction shows that with low afterload, the effect of end diastolic volume on the ejection fraction is relatively large, whereas with high afterload the ejection fraction was relatively less influenced by end diastolic volume.
Discussion
Our study describes a statistical model of the beat to beat variation of ejection fraction in atrial fibrillation. In this multivariate model of the beat to beat changes in ejection fraction, beat to beat variation of contractility, preceding contractility, as well as preload and afterload determined ejection fraction of the index beat. The most important t test parameter of the multiple regression analysis appeared to be contractility of the index cycle. The present model filled in the previously described model,9 and the addition of measures of preload, afterload, and contractility improved the strength of the model markedly.
EFFECT OF CONTRACTILITY ON EJECTION FRACTION
The finding that left ventricular beat to beat variation of contractility during atrial fibrillation is strongly related to beat to beat variation of left ventricular ejection fraction is in agreement with results of previous studies.3 ,7 ,8 ,22 ,23 In addition, ejection fraction was related to contractility of the preceding cycle. This observation confirms earlier reports which showed that cardiac performance might be dependent on the mechanical events of more than one preceding beat.8 ,12 In the univariate analysis, left ventricular ejection fraction was positively influenced by preceding contractility. However, multivariate analysis showed an inverse relation between left ventricular ejection fraction and preceding contractility. The positive univariate relation between these variables is apparently described by other parameters in the multivariate model, so that in the multivariate model the true negative relation is exposed. The positive univariate relation between preceding contractility and the ejection fraction may be explained by the model described by Hardman et al, in which the effect of postextrasystolic potentiation decays over a number of beats.8 The positive relation between contractility of the preceding beat and the ejection fraction was, however, not demonstrated in the present multivariate model. This may be because measures of contractility of the index beat show a relatively strong effect on left ventricular ejection fraction compared with the contractility of the preceding cycle.
The origin of the remaining negative multivariate relation between the contractility of the preceding cycle and the left ventricular ejection fraction is more difficult to establish, although it may be found in the same model by Hardman et al.8 A short pre-preceding cycle will be poorly restituted mechanically, and is followed by a weak contraction. The following ejection will be strengthened owing to postextrasystolic potentiation. However, the scope of the present model does not allow such conclusions to be drawn. In order to elucidate the origin of the complicated relation between left ventricular ejection fraction and preceding contractility, a study needs to be performed into the relative dependency of left ventricular contractility, preceding contractility, and cycle length fluctuations.
EFFECT OF PRELOAD AND AFTERLOAD INDICES ON EJECTION FRACTION
The positive relation between left ventricular end diastolic volume and ejection fraction confirms findings of previous studies in which the effect of the Frank–Starling mechanism on ejection fraction in patients with non-valvar atrial fibrillation was demonstrated.4 ,5 ,9 In a previous study by our group this contribution of the Frank–Starling mechanism to the varying ejection fraction was, however, limited to situations of short preceding cycle lengths and long pre-preceding cycle lengths.9 The interactions between end diastolic volume and preceding and pre-preceding RR interval were, however, not demonstrable in the present model and were described by the remaining interaction between end diastolic volume and afterload.
The interaction between left ventricular end diastolic volume and afterload indicates that the ejection fraction was relatively more influenced by variations in preload in the presence of a low afterload compared with the influence of preload in the presence of a high afterload. This suggests that the role of the Frank–Starling mechanism in the determination of the ejection fraction in patients with atrial fibrillation is restricted to situations in which afterload is low, which may be the situation in the presence of a short pre-preceding RR interval. After a short pre-preceding interval only a small volume of blood will be ejected and the rise in aortic pressure will be small. As a result, the runoff in the aorta will be considerable and aortic impedance (that is, afterload) during the next beat will be relatively low, resulting in an increased ejection fraction.5 ,6
EFFECT OF CYCLE LENGTH FLUCTUATIONS ON LEFT VENTRICULAR EJECTION FRACTION
After the addition of the above mentioned determinants of contractility and afterload to our previous model,9 the influence of the preceding RR interval on left ventricular ejection fraction, measured by its t test parameter, tended to be less in the present multivariate model. In addition, the relation between pre-preceding RR interval and ejection fraction did not even achieve a t test parameter value high enough to remain in the final model. Part of the relation between preceding RR interval and ejection fraction and the entire relation between pre-preceding RR interval and ejection fraction were apparently described by other parameters which had not been included in our previous model. In our opinion, this is related to the predominating effect of the interval–force relation determining the variable left ventricular performance in atrial fibrillation. In the presence of a long preceding RR interval, mechanical restitution will be complete and the following ejection will be strengthened, whereas in the presence of a short pre-preceding RR interval contractility of the index beat will be high (“postextrasystolic potentiation”).8 ,24 ,25These cycle length fluctuations influence ejection fraction indirectly by their effect on contractility, but also by their effect on afterload. Taking contractility and afterload into account when assessing the origin of the fluctuations of ejection fraction in atrial fibrillation, this strongly replaces the influence of random cycle length fluctuations.
CLINICAL IMPLICATIONS
The effects of beat to beat variations of cycle length, contractility, preload, and afterload on the variation of the pulse during atrial fibrillation have been described in earlier reports.8-10 These mechanisms are probably responsible for the adverse haemodynamics produced by the irregularity of the pulse in atrial fibrillation.26 ,27 The mutual proportions in which these mechanisms contribute to the beat to beat left ventricular systolic performance in patients with non-valvar atrial fibrillation, as measured by left ventricular ejection fraction, are demonstrated in our present study. In order to optimise haemodynamics in patients with atrial fibrillation, the origin of the beat to beat variations of contractility, preload, and afterload—that is, random cycle length fluctuations—may be a starting point for therapeutic options, as was demonstrated for transcatheter ablation of the atrioventricular junction and pacemaker implant resulting in a regular ventricular rhythm.28 Another starting point for therapeutic options in these patients may be optimisation of left ventricular afterload without reduction of preload and contractility. The latter option, however, remains to be investigated.
LIMITATIONS
First, although patients with valvar heart disease were excluded from this study, patients were still relatively heterogeneous with respect to underlying heart disease. This, and the small number of patients, precluded subgroup analysis. Moreover, this was not the primary target of the present study. Second, the description of contractility and afterload by ESP/ESV and ESP/SV depends on the accuracy of the approximation of end systolic aortic pressure by non-invasive measurement of peripheral blood pressure. Although the values of ESP equal that of intra-arterial blood pressure measurement,18 they differ significantly from aortic systolic pressure on physiological grounds. However, the beat to beat variability of ESP will equal that of aortic systolic pressure. Therefore, the approximation of aortic systolic pressure by ESP would change the values of the regression coefficients of the multiple regression analysis for afterload, contractility of the index cycle, and contractility of the preceding cycle, but not the value of thet test parameter.
CONCLUSIONS
The varying left ventricular systolic performance measured by left ventricular ejection fraction in atrial fibrillation is dominated by variations of contractility, probably caused by the interval–force relation. Beat to beat variations in preload and afterload play a more modest role. The presence of preload and afterload variations may result from random cycle length fluctuations as well. Beat to beat variations in preload, consistent with the Frank–Starling mechanism, show their effect on ventricular performance mainly in the presence of a reduced afterload.