Article Text

Abstract
OBJECTIVE To assess the dynamic changes in left atrial volume by transthoracic three dimensional echocardiography and compare the results with those obtained by magnetic resonance imaging (MRI).
DESIGN AND PATIENTS 30 healthy children (15 boys and 15 girls, aged 8 to 13 years) underwent examination by three dimensional echocardiography and MRI.
METHODS Three dimensional echocardiography of the left atrium was performed using rotational acquisition of planes at 18° intervals from the parasternal window with ECG gating and without respiratory gating. Volume estimation by MRI was performed with a slice thickness of 4–8 mm and ECG triggering during breath holding in deep inspiration. A left atrial time–volume curve was reconstructed in each child.
RESULTS Left atrial maximum and minimum volumes averaged 24.0 ml/m2 and 7.6 ml/m2 by three dimensional echocardiography, and 22.1 ml/m2 and 11.9 ml/m2 by MRI. The greater left atrial minimum volume in the latter was at least in part a result of breath holding. Dynamic changes in left atrial volume during the heart cycle were detectable by both methods. The higher temporal resolution of three dimensional echocardiography allowed a more precise evaluation of different phases.
CONCLUSIONS Three dimensional echocardiography and MRI were both useful methods for studying the physiological volume changes in the left atrium in children. These methods may be used for further study of the systolic and diastolic function of the heart.
- three dimensional echocardiography
- magnetic resonance imaging
- left atrial volume
- children
Statistics from Altmetric.com
The left atrium serves as a reservoir, a conduit, and a booster pump for blood returning from the lungs to the heart. Changes in the left atrial size and function have been observed in various heart diseases.1-3 Left atrial size has mostly been studied with contrast angiography and either cross sectional or M mode echocardiography. Cyclic changes in left atrial volume are not directly observable by these methods as the shape of the left atrium changes during the heart cycle. Recent studies on left atrial size by magnetic resonance imaging (MRI) have provided data on atrial volumes and their cyclic changes in healthy adults,4 in patients with cardiomyopathy,1 and in those with myocardial infarction.5 There is little information on the left atrial volumes in children.6-10
Echocardiography is the most commonly used non-invasive imaging technique in children with heart disease. It is easy to perform and can be repeated. The measures commonly used are the sagittal diameter of the left atrium in cross sectional echocardiography, and the ratio of the diameters of the left atrium and the aortic root in M mode. However, the data obtained by cross sectional echocardiography and M mode recording give only crude estimates of left atrial size. Three dimensional echocardiography is a new non-invasive imaging technique that has been shown to be accurate in determining end systolic and end diastolic volumes of both left and right ventricles.11-14To our knowledge there are no published data on the dynamic changes of left atrial volume in adults or in children assessed by three dimensional echocardiography.
We assessed left atrial volumes during the heart cycle in healthy children by transthoracic three dimensional echocardiography and by MRI. Our goal was to test whether these new non-invasive methods could produce additional data on the physiological events during the heart cycle and whether the accuracy of the measurements justified further studies on patients.
Methods
The study was carried out in Kuopio University Hospital from April to November 1998. Informed consent for the study was obtained from the parents or the subjects. The study was approved by the research ethics committee of the hospital.
STUDY POPULATION
Thirty healthy children were enrolled in the study. Weight, height, and pubertal status of all subjects were recorded and body surface area (BSA) was calculated.15 Clinical cardiovascular examination was performed. Blood pressure was recorded at phase I and V Korotkoff sounds. All children underwent MRI and two echocardiographic examinations on the same day without sedation. The clinical details of the children are shown in table1.
Clinical details of the children
THREE DIMENSIONAL ECHOCARDIOGRAPHY
Transthoracic echocardiographic examination was performed with the patient lying supine or in the left lateral semirecumbent position. Examinations were performed by two independent observers on the same day using a GE Vingmed System (Horten, Norway) FiVe ultrasound scanner. Transducer frequency was 3.5 MHz or 5 MHz, either or both being used for each patient. Standard parasternal, apical, and subcostal views were used to confirm the presence of normal cardiac anatomy. An ECG trace was recorded simultaneously with the echocardiogram. Echocardiographic data were saved in digital form on the hard disk of the ultrasound scanner for later analysis.
Three dimensional echocardiography was performed using rotational image acquisition from a parasternal view, with ECG gating and without respiratory gating. The subjects breathed normally during the scanning of three dimensional cineloops. The normal transducer was fixed to a light weight, computer controlled, motorised carriage that was easy to hold in the hand. An optimal acoustic window was first selected by cross sectional scanning. Pressing a button in the motorised carriage initiated three dimensional data acquisition. The transducer rotated in a semicircle of 180° around the central axis of the imaging plane, producing a conical dataset. Ten images were collected during the rotation. Scanning of a plane took place if pulse rate was within ± 20 beats/min of average. Thus automatic selection of scanning times by RR intervals allowed adequate recordings of the cardiac cross sections. Three dimensional cineloops (10 views, median 54 frames/heart cycle, range 40–80 frames/heart cycle) were digitally stored. Three dimensional datasets were saved on magneto-optic disks.
Later, seven subjects were re-examined to study the effects of breath holding on left atrial maximum and minimum volumes. Owing to loss of acoustic window with full lungs, maximum inspiration was not used during the three dimensional image acquisition.
The three dimensional datasets were analysed using a detached computer. Volume estimation in three dimensional echocardiography started with interactive manual contour depiction on the computer display. Planar contours were selected and drawn with a mouse before the object was reconstructed and visualised in three dimensions. From the given set of contours a polyhedron was reconstructed by cubic spline interpolation and the volume calculated by disk summation.16 Both observers analysed two three dimensional datasets in each child.
The left atrial appendage and the pulmonary vein inlets were excluded from the left atrial volume. The mitral annulus was taken to be the atrioventricular border. The frame with the largest cavity size when the mitral valve was still closed was chosen as the maximum volume. The minimum volume was calculated from the frame at the beginning of the R wave on the ECG. The left atrial boundaries at maximum and minimum size were traced manually. Left atrial edges between these two extremities were interpolated automatically by the software. The accuracy of the interpolation was checked at every frame during the heart cycle, and approximately every third frame needed manual correction.
MRI METHODS
MRI was performed with a 1.5 T whole body imaging system (Magnetom Vision, Siemens Medical Systems, Erlangen, Germany), using a circularly polarised phase array coil. All scans were obtained during breath holding in deep inspiration, and ECG triggering was used. The left atrium was imaged with a cross sectional, fast, low angle shot (FLASH) type of gradient echo cine sequence: time of repetition (TR) = 100 ms, time of echo (TE) = 4.8 ms, field of view (FOV) = 300 × 300 mm, imaging matrix = 162 × 256, flip angle = 20°. The sequence applied ninefold k space segmentation, four echoes were shared, and a bandwidth of 195 Hz/pixel was used. In plane resolution was 1.85 × 1.17 mm and two phase images were acquired in every TR interval. To ensure ECG triggering, after every R wave the number of phases was selected at the beginning of data acquisition so that the mean product of TR and the number of phases was 100 ms below the RR interval. As the heart rate slowed down during data acquisition, the respective value was 200 ms at the end of the study. On average, 10 slices (range 8–16) were obtained during the heart cycle.
Transverse and coronal single slice turbo FLASH scout images were obtained (TR = 1100 ms, TE = 2.3 ms, FOV = 400 × 400 mm, and matrix = 128 × 256). Based on the scout images, 4–10 single FLASH acquisitions were needed to cover the entire left atrium. The slices were positioned parallel to the long axis of the right atrium to ensure optimal visualisation of the atrioventricular valve. In the first 12 subjects a slice thickness of 8 mm was used, which produced suboptimal image quality. Therefore the remaining 18 subjects were imaged with a slice thickness of 4 mm.
Left atrial boundaries were traced manually in every image acquired during the heart cycle. Volumes were achieved using the slice summation method, which is based on summation of the volume of each slice taking the slice thickness and interslice distance into account.
LEFT ATRIAL VOLUMES
The maximum and minimum left atrial volumes of each subject were calculated as mean values of four analyses. Their difference was taken as the left atrial cyclic volume change. The atrial stroke volume is the volume reduction from the onset of atrial systole to the minimum volume at the end of diastole. The last 15% of the heart cycle was chosen to represent this time period of diastole.17Passive emptying of left atrial volume was defined as the left atrial maximum volume minus the left atrial volume at the onset of atrial systole. The relation of atrial stroke volume to cyclic volume change was calculated (fig 1).

Left atrial time–volume curve in a 9 year old boy. (a) Minimum volume. (b) Maximum volume. (c) Mid-diastolic volume (15% from the end of the heart cycle). c–a, atrial stroke volume; b–a, cyclic volume change.
Peak atrial filling rate (PFR) represents the greatest volume change per unit time during five echocardiographic frames in the filling phase of the time–volume curve. Peak emptying rate (PER) represents the greatest volume change per unit time during five frames in the early emptying phase of the time–volume curve. The rate of the volume change is normalised by dividing the actual figure (ml/s) by the cyclic volume change (ml). PFR and PER could not be calculated from MRI data because too few measurements (8–16) were made during the heart cycle.
Mean time–volume curves were calculated to obtain a visually informative way of representing the volume changes in the 30 subjects. For each patient we first calculated the time intervals from R wave to maximum volume and from maximum volume to the end of heart cycle. Both time intervals were divided into 20 equal parts (5%). The respective volumes were interpolated at each time point. Data on the 30 subjects were then averaged to obtain a sum curve that represents the times from the R peak on the ECG (by 5% intervals before and after the maximum volume point) and the respective volumes.
STATISTICAL ANALYSIS
Interobserver and intraobserver variability of three dimensional echocardiography was determined. Bland-Altman analysis was used to identify possible bias (mean difference between the two methods) and the limits of agreement (2 SD of the difference).17Interobserver analysis was calculated between examinations made by observer 1 and observer 2. For the intraobserver analysis, eight patients were reanalysed by observer 1. The echocardiographic data produced by the two observers—consisting of two separate examinations and four independent analyses—were averaged for further analysis. Volumes determined by echocardiography were then compared with MRI by Pearson's correlation. Bland-Altman analysis was used to compare the results of three dimensional echocardiography and MRI recordings. Group means were compared with Student's paired ttest. The data are given as the mean (SD) and, when considered informative, as the range of individual measurements.
Results
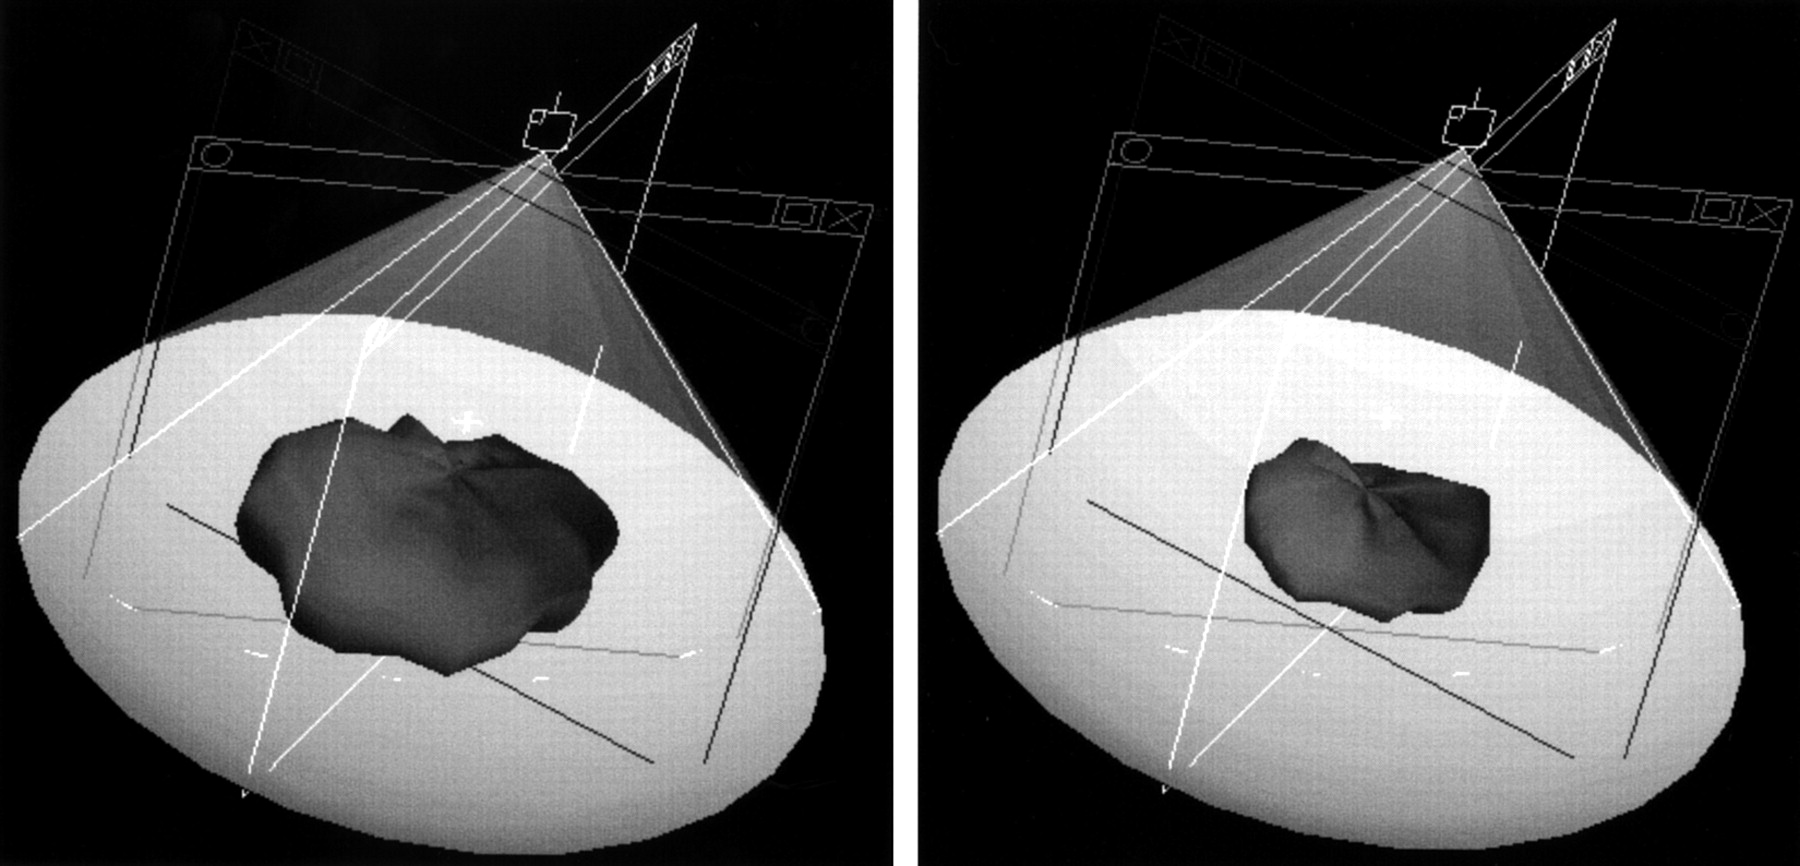
All three dimensional echocardiographic examinations were carried out successfully, and manual tracing of images was possible. In some image planes the borders were not properly detectable, but the endocardial borders could be traced with the aid of a computer according to adjacent image planes. Figure 2 shows the oval shape of the left atrium as reconstructed by the three dimensional software. The acquisition time for a three dimensional echocardiographic dataset was 10 to 15 seconds, depending on the frame rate used and the heart rate. Image transfer to the computer took two to three minutes. Tracing of left atrium and determination of the volumes took 30 to 60 minutes, depending on image quality and the number of frames. The acquisition time for an MRI dataset was 10 to 15 minutes. Tracing and determination of the volume of the left atrium took 30 to 45 minutes.

Reconstruction of left atrial maximum and minimum volumes produced by the three dimensional software when 10 scanning planes were used.
REPRODUCIBILITY OF THREE DIMENSIONAL ECHOCARDIOGRAPHY
Interobserver variability (mean (SD)) of left atrial maximum and minimum volume estimates by three dimensional echocardiography was −3.3 (12.8) ml and −1.0 (4) ml, respectively. Intraobserver variability for left atrial maximum volume was 0.9 (5.5) ml, and for left atrial minimum volume −0.6 (2.3) ml. In repeated analysis, left atrial maximum and minimum volumes correlated closely (r = 0.94 andr = 0.89, respectively).
VOLUMES DURING THE HEART CYCLE BY THREE DIMENSIONAL ECHO AND MRI
All the volumes calculated for left atrium were normally distributed. Correlation coefficients between three dimensional echocardiography and MRI were 0.48 and 0.72 for left atrial maximum volume and left atrial minimum volume, respectively. Three dimensional echocardiography resulted in slightly higher maximum volumes than MRI. In agreement analysis, the bias was 2.4 (7.2) ml, but the difference was not significant (p = 0.07) (fig 3). For left atrial minimum volumes the bias was larger (−5.4 (3.3) ml) and the difference was statistically significant (p < 0.001) (fig 4). The correlation coefficients of left atrial maximum and minimum volumes to body surface area were 0.71 and 0.76 when assessed by three dimensional echocardiography, and 0.57 and 0.72 when assessed by MRI, respectively.

Bland-Altman agreement plots for left atrial maximum volume estimation by three dimensional echocardiography (3DE) in comparison with MRI. Dotted line represents the mean difference (bias). Dashed line represents ±2 SD from the mean between the two techniques.

Bland-Altman agreement plots for left atrial minimum volume estimation by three dimensional echocardiography (3DE) in comparison with MRI. Dotted line represents the mean difference (bias). Dashed line represent ±2 SD from the mean between the two techniques.
Figure 5 shows the time–volume curves for the left atrium estimated by three dimensional echocardiography (fig 5A) and MRI (fig 5B). The different phases in atrial volume changes are clearly seen in the curves. Rapid atrial filling (the time from the beginning of atrial filling to left atrial maximum volume) lasted on average for 50% of the heart cycle in both three dimensional echocardiography and MRI (0.38 and 0.30 seconds, respectively). The mean heart rate was 94 beats/min at the beginning of MRI examination and 80 beats/min at the end, and 76 beats/min during three dimensional echocardiography scanning.

Averaged left atrial time–volume curves during the heart cycle in 30 children. (A) Assessment with three dimensional echocardiography. (B) Assessment with MRI: a, heart rate at the beginning of MRI scanning; b, heart rate at the end of MRI scanning.
Data on left atrial volumes assessed by both methods are given in table2. Examination by MRI produced slightly smaller left atrial maximum volumes and larger minimum volumes than with three dimensional echocardiography. These differences resulted in a smaller cyclic volume change when the measurements were performed using MRI. Owing to the restriction of scanning phases to ensure scanning at every heart beat, it was not possible to evaluate the effect of atrial contraction in MRI time–volume curves. Peak filling rate and peak emptying rate calculated from three dimensional echocardiography data were 4.0 (0.4) l/s and −7.1 (0.7) 1/s, respectively.
Left atrial volumes measured by three dimensional echocardiography and magnetic resonance imaging (MRI) in 30 healthy children aged 8–13 years
BREATH HOLDING
Table 3 shows the maximum and minimum volumes of the left atrium in seven subjects restudied by three dimensional echocardiography at a later visit. Maximum left atrial volumes during breath holding and during normal breathing did not differ. However, the minimum volumes were significantly greater during breath holding.
Left atrial volumes in seven children assessed by three dimensional echocardiography
Discussion
Our study shows that both three dimensional echocardiography and MRI are suitable methods for assessing left atrial volumes during the heart cycle. A previous study has shown that MRI can quantify left atrial volumes and the phasic volumetric function of the left atrium in adults.4 However, the temporal resolution used (50 ms) was not sufficient for determining peak rates of volume change during left atrial filling and emptying. In our study three dimensional echocardiography produced a significantly higher temporal resolution (40 to 80 frames/heart cycle, which corresponds on average to 15 ms between frames) than MRI (8 to 16 time–volume points). The peak rates of volume change during left atrial filling and emptying were obtainable only from three dimensional echocardiography data. Dynamic changes in left atrial volume may be better evaluated from three dimensional echocardiography than from MRI time–volume curves.
At present no method is generally accepted as the gold standard for measuring left atrial volume. Angiographic studies are based on two imaging views. There are no data on the use of ultrafast computerised tomography, and MRI still has limited temporal resolution. None of the three methods is easily used in children. The size and shape of the left atrium are different in a live person from in a heart specimen in vitro. Thus interpretation of data gained by new technologies such as three dimensional echocardiography should be made with caution. However, digitised three dimensional echocardiography has the potential to become the primary method of studying dynamic changes in left atrial volume in the future.
To our knowledge the present study is the first to provide data on the use of three dimensional echocardiography for evaluating left atrial size. Left atrial volumes in children have previously been studied with angiography.6 ,7 In our study the volumes obtained by both three dimensional echocardiography and MRI were smaller than those obtained by angiography. In healthy adults the estimates based on cross sectional echocardiography were similar to our results in the present study.18
The atrial appendage is a true part of the left atrium. However, its location may vary and the volume of the hooked and tube shaped appendage is not always easy to measure. In angiographic studies in children it has either been excluded6 or included.7 Studies based on cross sectional echocardiography do not discuss the role of the atrial appendage.2 ,3 ,9 ,10 ,19 In an MRI study in adults the appendage was included in the left atrial volume.4 As a reliable assessment of the left atrial appendage was not always possible in the present study, its volume was excluded from the reported left atrial volumes.
The left atrial maximum volumes measured by MRI were slightly, but not significantly, smaller than those obtained by three dimensional echocardiography. The peak in left atrial volume lasted only for a short time (fig 5A). Therefore, at least in part of the MRI recordings the true maximum volume probably appeared during the 50 ms periods between data acquisition phases. In a previous study a relation between heart rate and left atrial maximum volume was found.4 In our study the mean heart rate slowed during the period of MRI data acquisition, which lasted for 15 minutes, but even at the end of the examination it was still 4 beats/min higher than during the echocardiographic recording. This could in part explain the smaller maximum left atrial volume estimates by MRI.
The left atrial minimum volumes obtained with three dimensional echocardiography were significantly smaller than those obtained with MRI. We assumed that this could partly be caused by breath holding. We therefore re-examined seven subjects with three dimensional echocardiography to evaluate the effect of breath holding. Owing to the loss of acoustic window in nearly maximal inspiration, the lungs were not so fully inflated as during the MRI data acquisition. We found that the minimum atrial volumes during breath holding were indeed 20% greater than during normal breathing. The slightly differing calculation protocols used (see Methods) and the presumably different accuracy in edge detection by the two methods, especially at the pulmonary vein inlets, may explain some of the systematic difference in the results.20
Transthoracic examination with the new digitised three dimensional echocardiography is easy to perform and the scanning time is short enough to enable one to study even younger children than in the present study. A high temporal resolution allows a thorough study of left atrial function during the heart cycle. Thus digitised three dimensional echocardiography is superior to the previous three dimensional echocardiographic imaging method, which uses analogue data from the video output of the ultrasound machine. However, manual tracing of a large number of images is time consuming. Thus true on-line three dimensional echocardiography scanning will be needed if this method is to be adopted for general clinical use. In selected cases and in clinical trials the methodology now available may already be suitable as an aid to clinical decision making.
In MRI examination the need for breath holding is a major limiting factor in young children. The time needed for the examination is quite long. However, in our study the youngest children were eight years old and they cooperated well. Especially in patients with a poor echocardiographic window, MRI acts as a valuable method for estimating left atrial size and cyclic volume changes.
We found that in 8–13 year old children the left atrial volume change produced by atrial contraction is small. The left atrial stroke volume was 4 ml/m2, which represented 21% of total atrial emptying. In an MRI study in adults the respective values were 10 ml/m2 and 36%.4 The difference between adults and children may be caused by factors such as increasing myocardial stiffness with age and lower heart rate in adults.21 Accurate estimates of left atrial volumes and their changes during the heart cycle may prove to be practical tools for evaluating cardiac function in various clinical conditions. Their use may help in the diagnosis and follow up of disease processes causing diastolic dysfunction of the ventricles, such as cardiomyopathies. The grade of left atrial enlargement may also be assessed by three dimensional echocardiography in operated or unoperated congenital heart disease, and the severity of acquired mitral regurgitation may be indirectly quantified.
CONCLUSION
Three dimensional echocardiography is an accurate and non-invasive method of studying left atrial volumes and function in children. MRI produces similar data but has a limited temporal resolution and is a less convenient method in clinical practice. The clinical value of estimating the magnitude and timing of phasic left atrial volume changes in assessing cardiac function awaits study in patients.
Acknowledgments
This study was supported by Sydänlapset ry, Finland.