Article Text

Abstract
OBJECTIVE To develop a simple risk model as a basis for evaluating care of patients admitted with acute myocardial infarction.
METHODS From coronary care registers, biochemistry records and hospital management systems, 2153 consecutive patients with confirmed acute myocardial infarction were identified. With 30 day all cause mortality as the end point, a multivariable logistic regression model of risk was constructed and validated in independent patient cohorts. The areas under receiver operating characteristic curves were calculated as an assessment of sensitivity and specificity. The model was reapplied to a number of commonly studied subgroups for further assessment of robustness.
RESULTS A three variable model was developed based on age, heart rate, and systolic blood pressure on admission. This produced an individual probability of death by 30 days (P30) where P30 = 1/(1 + exp(−L30)) and L30 = −5.624 + (0.085 × age) + (0.014 × heart rate) − (0.022 × systolic blood pressure). The areas under the receiver operating characteristic curves for the reference and test cohorts were 0.79 (95% CI 0.76 to 0.82) and 0.76 (95% CI 0.72 to 0.79), respectively. To aid application of the model to routine clinical audit, a normogram relating observed mortality and sample size to the likelihood of a significant deviation from the expected 30 day mortality rate was constructed.
CONCLUSIONS This risk model is simple, reproducible, and permits quality of care of acute myocardial infarction patients to be reliably evaluated both within and between centres.
- acute myocardial infarction
- risk model
Statistics from Altmetric.com
Quality assurance and audit of medical practice are important and hence much debated public health issues. From the simple analysis of crude outcome data, hospital league tables have been drawn up for a number of common illnesses and operations, with low ranking hospitals gaining much adverse publicity. However, these interhospital and intrahospital comparisons have little additional impact because the risk profiles of the patients (case mix) are not adequately taken into account. Without some form of clinically acceptable adjustment, comparison of hospitals inevitably favours those treating a lower risk population. Leyland and Boddy1 recently showed that outcome data derived from hospital coding and mortality registries exclusively are inadequate tools to assess quality of care in different hospitals. Iezzoni and colleagues,2 who compared various previously published models, concluded that those based on administrative data were particularly inaccurate. A number of risk models that include clinical variables, and that seek to adjust for case mix, have been published.3-5 However, most of these models concentrate on selected subgroups, are restricted to one or a limited number of traditional risk factors, use administrative data without clinical details, or fail to distinguish adequately between comorbidities and complications. Lee and colleagues3 examined the cohort of patients recruited for the GUSTO–I (global utilization of streptokinase and t-PA for occluded coronary arteries—I) study. However, selection of patients eligible for inclusion in a study of thrombolytic treatment would certainly exclude a significant proportion of patients with a much higher risk profile. This is adequately shown by comparing the GUSTO-I 30 day mortality (7%) with an unselected acute myocardial infarction (MI) population (15–25%). Other investigations concentrate on selected age groups.4 ,5 Examination of patient subgroups necessarily changes the make up of the risk model, making it less broadly applicable to routine clinical care.
National bodies and others responsible for health service delivery are increasingly recognising the need for ensuring basic standards of care as well as developing robust approaches to determining whether agreed clinical standards are actually being met. The UK Department of Health has recently published the National service framework for coronary heart disease,6 ,7 which aims to coordinate efforts to improve medical care of patients by the implementation of minimal standards of care and audit. As part of this audit process, it is intended that the 30 day sex and age standardised mortality of patients aged 35–74 years with a diagnosis of acute MI be assessed. This basic performance indicator is thought likely to reflect the quality of inpatient and associated early outpatient care. However, no clinical or laboratory patient characteristics are taken into account. Furthermore, the elderly population (over 75 years), with a worse prognosis and comprising nearly 50% of acute MI admissions, is not considered.
The aim of our study was to develop an objective and robust risk model, using parameters routinely measured at hospital admission, to predict the 30 day mortality of consecutive patients of all ages admitted throughout the hospital with an eventual diagnosis of myocardial infarction.
Methods
PATIENT POPULATION
Over a three month period (1 September to 30 November 1995) 3684 potential cases of acute MI were identified in 20 adjacent hospitals comprising all units admitting such patients in the former Yorkshire Region. Cases were sought from coronary care registers, clinical coding, and biochemistry records of cardiac enzyme assay requests. Medical records were evaluated and 2153 consecutive cases of acute MI were confirmed, of whom 1643 patients were discharged from hospital alive after a first event. Consecutive patients of all ages with confirmed acute MI, according to the World Health Organization criteria, were included in the study.
A 250 item case record form of demographic, clinical, and treatment variables was completed for each patient according to a standardised operations manual and entered on a computer database; all consecutive acute MI patients were included regardless of age or place of care within the hospital. Only the first presentation (during the recruitment window) with acute MI was included and patients transferred to a tertiary centre were counted only once for the index admission. Clinical characteristics on admission were taken from the following sources in order of preference: emergency department medical notes; admitting medical team's first clerking; and nursing notes.
Quality of data abstraction from case notes and data entry on the computerised database were formally assessed. After a pilot phase of data abstraction from case notes, the interobserver agreement was 98% without any systematic bias. The accuracy of data entry on the database was excellent, with less than 1% discrepancy and without systematic bias.
RISK MODEL CONSTRUCTION: CANDIDATE VARIABLES
Summary demographic and clinical details of the 2153 consecutive patients studied are detailed in table 1. Candidate predictor variables were selected from literature review5 ,6 and clinical experience. Only variables routinely measured in most hospitals were included in the analysis. Randomly determined reference (n = 1092) and test (n = 1061) cohorts were formed by retrospective computer generation. The reference cohort was used for univariate logistic regression analysis for each variable with 30 day all cause mortality as the dependent variable. Variables with a Wald score greater than 15 were then selected and repeated multivariable logistic regression analyses with forwards stepwise elimination of factors were then performed. Data were frequently missing for site of myocardial infarction (14%) and for smoking status (12%), but these variables were included, without recoding, into the analyses. For all other analysed variables less then 2.5% of the data were missing.
Baseline characteristics of 2153 consecutive patients with acute myocardial infarction (MI) admitted over a three month period to 20 adjacent hospitals. The population was dichotomised to indicate patients who would be included (⩽ 74 years) or excluded (> 74 years) from the 30 day mortality performance indicator outlined by the UK national service framework
To judge the quality of the model, the area under the receiver operating characteristic (ROC) curve (AROC) for the reference cohort was calculated before application to the test cohort of patients. ROCs, plots of sensitivity against 1–specificity, allow direct evaluation of test power, with the area under the curve providing an estimation of the accuracy of a test.
The risk model was applied to the incident population of patients admitted to each of the participating hospitals to determine a predicted 30 day mortality. Observed versus expected 30 day mortality ratios (standardised mortality ratios (SMRs)) and their confidence intervals8 ,9 were then calculated. Hospital rankings were determined, based firstly on the observed, crude 30 day mortality rates and then on the SMRs. To validate the model further, subpopulations were also evaluated with the AROCs calculated: those above and below the age of 75 years; patients identified by hospital coding only; patients cared for by coronary care unit/cardiologist or not; and those admitted in the first versus second half of the study period.
Results
We performed univariate analysis on 29 baseline variables describing patient characteristics at the time of hospital admission (table 2). Of these, 10 had a χ2 Wald score of more than 15, with 19 variables with a χ2 Wald score of less than 15. After repeated multivariate logistic regression analyses by stepwise elimination of factors, we produced a five variable risk model based on the admission characteristics of age, systolic blood pressure, heart rate, previous use of antiarrhythmic drugs, and presence or absence of chest pain. Importantly, the sex of the patient provided no additional useful information in predicting 30 day mortality. Risk models that fail to be useful in a clinical setting can be regarded as invalid; therefore, after review of the model from a clinical and practical perspective it was restricted to the three continuous variables: age, heart rate, and systolic blood pressure. This information is easily available from ambulance or casualty cards, being objective and impartial, with very little room for varying interpretation or manipulation. This produced a probability of death by 30 days (P30, range 0–1) value for each patient, where P30 = 1/(1 + exp(−L30)) and L30 = −5.624 + (0.085 × age) + (0.014 × heart rate) − (0.022 × systolic blood pressure).
Univariate analysis of 30 day mortality
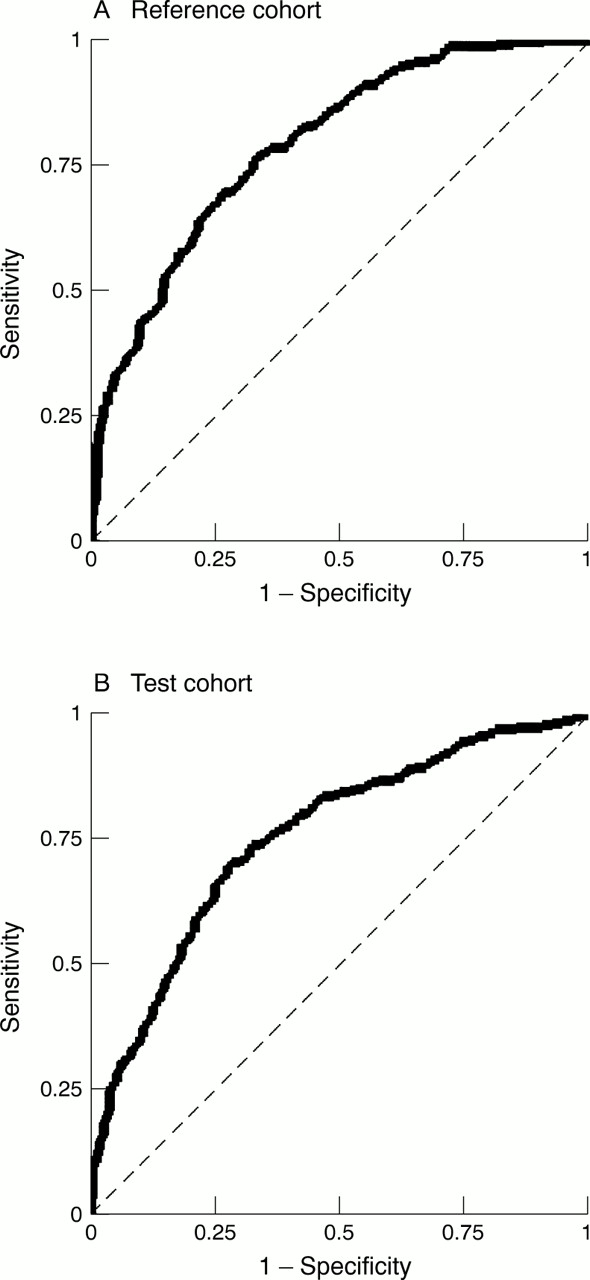
The AROCs for the three factor model were 0.79 (95% CI 0.76 to 0.82) and 0.76 (95% CI 0.72 to 0.79) for the reference and test cohorts (fig1), respectively. The AROC for a model based on age alone for the combined population was 0.71 (95% CI 0.69 to 0.74) compared with 0.77 (95% CI 0.75 to 0.80) for the three factor model. For the five variable risk model the respective AROC values were 0.79 (95% CI 0.76 to 0.83) and 0.78 (95% CI 0.74 to 0.81). The AROCs of the various non-randomly selected subgroup populations (detailed above) were calculated with values ranging between 0.71 and 0.79. With a pragmatic three factor risk model, expected 30 day mortality for the reference cohort was 23.5%, the observed mortality being 24.5% (SMR 1.04). The corresponding values for the test cohort were 23.9% and 24.2%, respectively (SMR 1.01). For the complete cohort of patients studied the expected 30 day mortality was 23.5% and the observed 24.4%, giving an SMR of 1.04. Figure 2, derived from the total population, shows patient numbers and their actual outcome arranged into 10 groups according to their calculated P30value.

Receiver operating characteristic curves of sensitivity versus 1−specificity for the three variable risk model for the reference and test cohorts. The areas under these curves are 0.79 and 0.76, respectively. This model is based on admission characteristics of age, systolic blood pressure, and heart rate.

Patient numbers and outcome for the whole cohort, arranged into 10 groups according to the calculated probability of death at 30 days (P30 value).
The 20 hospitals were ranked, based firstly on crude mortality rates and secondly on the SMR of each hospital. Comparison of the two approaches indicated that the rankings changed appreciably in both directions by an average of 3.5 places (range 0–10). Figure 3 shows the SMR for each participating centre as a function of the number of patients treated at each centre. In addition, we calculated the SMRs versus sample size, beyond which a centre is significantly different from the mean (50%, 10%, and 5% significance levels). It can be seen that none of the centres studied were significantly different from the mean at the 5% level of significance.

Normogram relating the standardised mortality ratio (SMR) and sample size of each participating centre to the likelihood of significant deviation from the expected 30 day mortality rate. The 50%, 10%, and 5% significance levels beyond which the SMR is statistically different from the mean have been calculated.
Discussion
In this study we have developed and validated a simple model that predicts 30 day mortality after admission for acute MI. The model is based on data from the medical records of consecutive patients of all ages admitted to all parts of the hospital and not restricted to subgroups of the acute MI population. The elaboration of this model is based on average care of the reference cohort of patients. As shown in the PRAIS-UK (prospective registry of acute ischaemic syndromes in the UK) study standard patient care may not be ideal, and this may therefore be a limitation of the method.10 With this proviso, any deviations from “average” care are even more likely to be significant. Compared with previously published models it has a similar predictive performance (AROC value 0.76) while using fewer variables.5-7 Areas greater than 0.75 are generally agreed to indicate good accuracy; the larger the AROC, the greater the discriminating power of the risk model.11 Such models derive an individual predictive risk (range 0–100%); in this case, expected 30 day mortality following acute MI. Patients, however, have one of two potential outcomes, therefore risk models become less applicable to individual cases. Smaller models, in addition to practicality, are less likely to give overoptimistic predictions than large models based on many variables.12 ,13 They are also less likely to suffer the risk of overfitting with too few events per variable. For clinical purposes, a predictive model based on a small number of variables is a desirable feature, particularly if this risk is calculated for individual patients at the bedside.
We have focused on true admission characteristics and not the occurrence of subsequent complications, which might partially reflect the quality of the care provided and hence confound the results. Jollis and Romano14 have pointed out that including complications as outcome predictors leads to overoptimistic conclusions of the apparent performance of risk adjustment models because these complications are often the immediate cause of death. The factors we have used are easily available from ambulance cards or emergency room case notes, and measure objective information that is not open to interpretation or easy manipulation. The Parsonnet score, used to predict mortality following adult cardiac surgery, contains many fields that seem to be highly subjective. Data that are not clearly objective are open to manipulation with subsequent overprediction of expected risk. Figure 2 shows that our model accurately reflects outcome, even at extremes of the calculated P30 value.
The change in hospital ranking, after adjustment for risk and based on the SMRs, indicates the limitations of the crude, uncorrected mortality data frequently used in the assessment of care, highlighting the need to adjust more effectively for presenting clinical characteristics. A good example of the general volatility inherent in ranking performance is the centre ranked 18th based on crude mortality. It had an observed 30 day mortality of 30%, which is 7% higher than average.15 However, after risk adjustment the observed mortality was no different from the predicted mortality and its ranking changed to ninth. On the other hand, the hospital ranked third based on crude mortality might be wrongly judged as providing high quality care as after risk adjustment its rank changed to 12th.
The centre ranked 20th by both methods had the highest SMR (1.55) of all participating centres but treated only 30 patients. If this reflected true quality of care, then 70 patients would be required for the ratio to fall outside the 95% confidence limits. Given the rate of admissions to centre 20, such an audit would take seven months.
If information used to assess performance is heterogeneous then comparisons between centres are invalid. With our three factor model only a few, non-manipulable parameters need to be collected, an achievable and relevant objective for clinical audit. Furthermore, the simplicity of our approach readily permits either retrospective or prospective application. The national service framework6aims “to examine the quality of care offered to patients with myocardial infarction, and to allow valid comparisons to be made between hospitals.” It has a core data set of about 50 items, nearly all of which are investigation and treatment parameters. However, the 30 day mortality performance indicator is corrected for age and sex alone. We consider that without the inclusion of baseline clinical information valid comparison of care is not possible. A recently published report on mortality rates after surgery for congenital heart defects16 concluded that the development of quality standards would be difficult because of the complexity of defects, the different types of operations, and the few patients in each subgroup. In contrast, most hospitals are not restricted by myocardial infarction patient numbers and, using our model, it should be possible for individual centres to run audit cycles evaluating consecutive patient care. The model is not restrictive and appears to hold even when non-random subgroup populations are investigated. These subgroups include those above and below 75 years of age, patients identified through hospital coding, as well as those cared for in a coronary care unit (or not) or by a cardiologist (or not). Examining these subpopulations is a harder test of our model than random splitting, which may lead to populations identical other than through chance variation. The normogram depicted in fig 3 provides a basis for assessment of the quality of clinical outcome (adjusted 30 day mortality) in groups of patients. However, comparative or individual evaluation of quality of care based on consultant involvement might prove more difficult because many health professionals often contribute to the care of each patient.
Nevertheless, by using a more individualised, patient based approach, it is possible for our risk model to highlight patients who died although their predicted mortality was low and patients who survived despite a high predicted mortality rate. Case review might then make it possible to identify negative or positive aspects of the care of these extreme cases.
There are some potential limitations to this approach. The acute MI population has to be identified before the application of any mortality estimate. Furthermore, prospective and external validation showing both reproducibility and transportability is desirable. There is no yardstick with which to compare model performance, making it necessary to rely on indirect parameters, such as the AROC. Further comparison of our model with other published work is difficult because these studies are limited to patient subgroups3 ,4 and use different predictor variables.17 There is no doubt that the precision of our model would be increased by including further predictors such as additional ECG information,18laboratory findings,19 or results of coronary angiography.20 Our aim was to construct an uncomplicated and practical risk model that can be applied to an unrestricted acute MI population to form the basis of a simple but validated indicator of standard of care in disparate centres as well as consecutive individual patients. We consider that these objectives have been achieved and that this approach might significantly improve care were it to be integrated into routine clinical practice.21-23
Acknowledgments
This project was commissioned and funded by the National Health Service Research & Development programme. RJS thanks Merck Sharp & Dohme for partial financial support and K Woods and J Cowley for early advice. We wish to thank all the staff in the biochemistry departments, coronary care units, audit and coding departments, pharmacies and medical records departments and all non-cardiology consultants of the 20 acute hospitals in the former Yorkshire Region as well as M Allen at the Office for National Statistics.
structure of the EMMACE study group
Principal investigators—Alistair S Hall, Michael B Robinson; clinical coordinator—Robert J Sapsford; research assistants—Beryl M Jackson, Christine Morrell; statistical advisor—Darren C Greenwood; database management—J Oldham; key investigators—RJI Bain, SG Ball, PD Batin, KE Berkin, RM Boyle, JL Caplin, RS Clark, JC Cowan, J Dhawan, D Garg, G Kaye, S Khan, H Larkin, RV Lewis, AF Mackintosh, J McLenachan, MA Memon, LCA Morley, GW Morrison, MS Norrell, EJ Perrins, MM Pye, G Reynolds, NP Silverton, JH Smyllie, U Somasundram, RN Stevenson, J B Stoker, AP Tandon, LB Tan, CJP Welsh, C Weston, GJ Williams, PT Wilmshurst, JI Wilson, AV Zezulka.