Article Text

Abstract
Objective: To establish through analysis of the radial pressure pulse waveform the dose dependent effects of glyceryl trinitrate (GTN) on properties of different blood vessels.
Design: Radial pulse waveform was measured in randomised order before, during a five hour application of a GTN patch delivering 0.104–0.625 mg/h, and for two hours after patch removal. The radial pressure waveform (Millar applanation tonometer) was convolved into an ascending aortic wave using a generalised transfer function (SphygmoCor process) enabling measurement of aortic systolic, diastolic, pulse, mean, and augmented pressure and left ventricular ejection duration in addition to standard brachial cuff pressures.
Setting: Fu Wai and Ren Ming hospitals in Beijing, China.
Patients: 46 recumbent hospitalised patients aged 56 (9) years, awaiting electrophysiological or other diagnostic studies, fasting, and with other treatments suspended.
Major outcome measures: Conventional brachial pressure measures and data from the synthesised aortic pulse.
Results: There was no consistent change in heart rate or brachial pressures except for a decrease in systolic and pulse pressures (p < 0.01) at dose > 0.416 mg/h. In contrast, there were substantial and significant (p < 0.0001) decreases in aortic systolic, pulse, and augmented pressures at all doses, mean pressure (p < 0.001) at doses > 0.416 mg/h, and ejection duration (p < 0.001) at doses > 0.208 mg/h.
Conclusions: Pulse waveform analysis exposes dose dependent effects of GTN on the aortic waveform, suggesting muscular conduit arterial dilatation with reduced wave reflection at the lowest dose, arteriolar dilatation and decreased peripheral resistance at the highest dose, and venous dilatation at the intermediate dose.
- glyercyl trinitrate
- pulsed waveform analysis
- aortic pressure waveform
Statistics from Altmetric.com
In 1879, William Murrell described the use of glyceryl trinitrate (GTN) as an antianginal agent and illustrated his paper with sphygmographic records showing a progressive decrease in amplitude of the late systolic peak and incisura of the radial pulse (fig 1).1 Shortly before, Broadbent,2 and shortly after, Osler,3 advised administering GTN for increased arterial pressure, as gauged from palpation or graphic recording of the arterial pulse.

Radial artery sphygmographs published by Murrell in 1879,1 showing the effects of glyceryl trinitrate (GTN) as a decrease in the amplitude of the second systolic shoulder of the pulse and in the height of the incisura.
GTN has never enjoyed popularity as an antihypertensive agent, except in acute emergencies. Introduction of the cuff sphygmomanometer in 1896 failed to show any consistent alteration in brachial systolic or diastolic pressure with GTN, even though the drug proved very effective in relieving angina pectoris and symptoms of cardiac failure.
The actions of GTN have proved very difficult to quantify and interaction with other drugs is even more difficult to measure. Current texts usually describe GTN as predominantly a venodilator, with localised actions as a coronary arterial dilator and minimal effects on arteriolar resistance vessels except at high dosage. In clinical studies of ischaemic heart disease, the benefit of GTN is assessed from improvement in exercise capacity with repeated formal stress tests.4,5
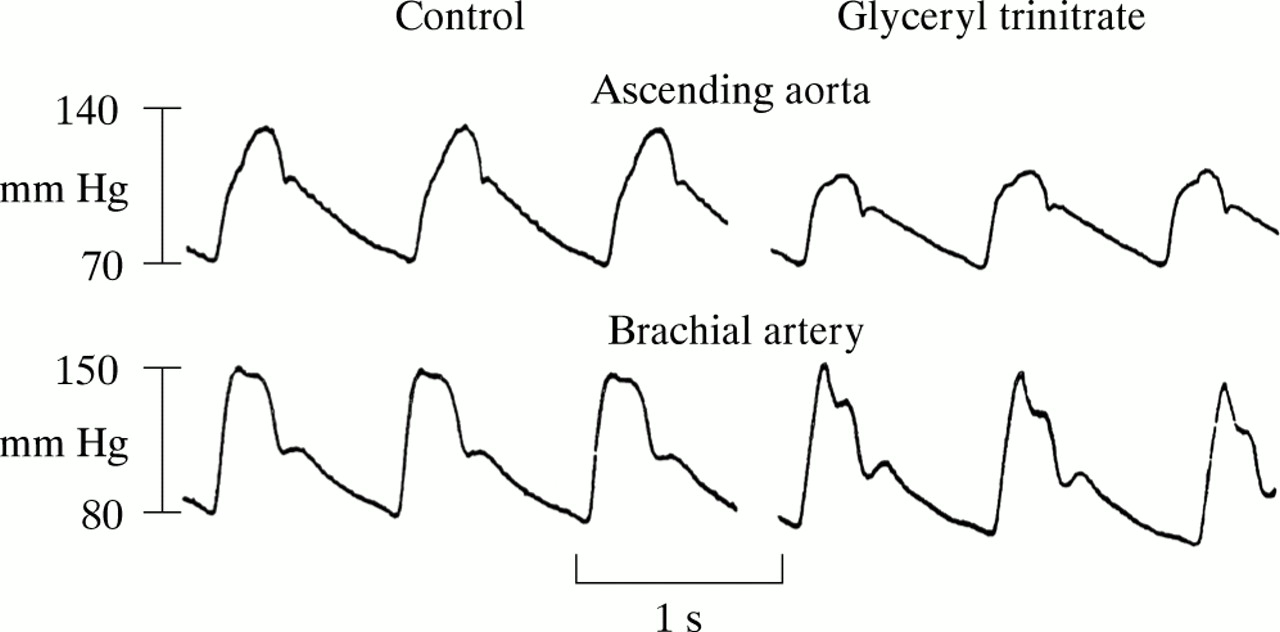
We have adapted Murrell's pulse waveform analysis of 18791 to quantify the action of GTN on systemic arteries, arterioles, and veins. We have pursued this after showing that changes induced by GTN on the radial pulse waveform are consistently associated with a reduction in aortic (though not upper limb) systolic pressure (fig 2).6,7

Pressure waves recorded with Millar micromanometer catheters in the ascending aorta (above) and brachial artery (below) at diagnostic cardiac catheterisation in a 54 year old man under control conditions (left) and after sublingual administration of GTN 0.3 mg (right). Reproduced from Kelly et al6 with permission of the European Heart Journal.
METHODS
The study population consisted of 46 adult inpatients at either the Fu Wai or Ren Ming hospitals. Patients were under cardiovascular evaluation, with most awaiting electrophysiological studies for supraventricular arrhythmia. Exclusion criteria were instability of medical condition, need to continue active antihypertensive or other vascular treatment, cardiac failure, valvar or congenital heart disease, other severe organic disease, perceived inability to complete the restrictions imposed (fast and recumbency), and disinclination to participate. Table 1 gives details of the patients.
Details of patients
Before the beginning of the study, all vascular treatment was discontinued for at least 72 hours. Patients were studied supine over an eight hour period after an overnight fast. Patients were randomly assigned to receive placebo or a GTN patch (2.5–15 mg, Nitro-Dur, Schering Plough Inc) delivering 0.104, 0.208, 0.416, and 0.625 mg/h.
All patients gave informed consent. The study was approved by the research ethics committee of the Fu Wai and Renming hospitals, in conformity with the Declaration of Helsinki.
At the start of the study and every 30 minutes thereafter, recordings were taken on six separate occasions of the radial artery pressure waveform using applanation tonometry (Millar Co, Houston, Texas, USA). This technique has been validated against intra-arterial pressure recordings.8 Data were digitised and processed in a computerised system (AtCor Medical, Sydney, Australia). A series of radial pressure waves over an eight second period was ensemble averaged and calibrated for peak and nadir of the wave with the best estimate of upper limb systolic and diastolic pressures (using a cuff sphygmomanometer and phase I and V, respectively of Korotkoff sounds).
The SphygmoCor process uses a validated generalised transfer process9–12 to calculate the ascending aortic pressure waveform. From this was calculated ascending aortic pressure wave augmentation as height (in mm Hg ) from the early systolic shoulder to late systolic peak, together with peak aortic systolic pressure and left ventricular ejection duration.13 Mean pressure was calculated by arithmetic integration of the calibrated radial artery and aortic waveform, and separately from sphygmomanometer values only, as brachial diastolic pressure plus one third of pulse pressure. Values presented for all parameters at each interval were the average of six separate determinations. Recordings were taken on 15 separate occasions over the seven hour period (fig 3). Repeatability of this process has been found by us and by others13–17 to be equivalent to that of other measures, including determination of arterial pressure by cuff sphygmomanometry.
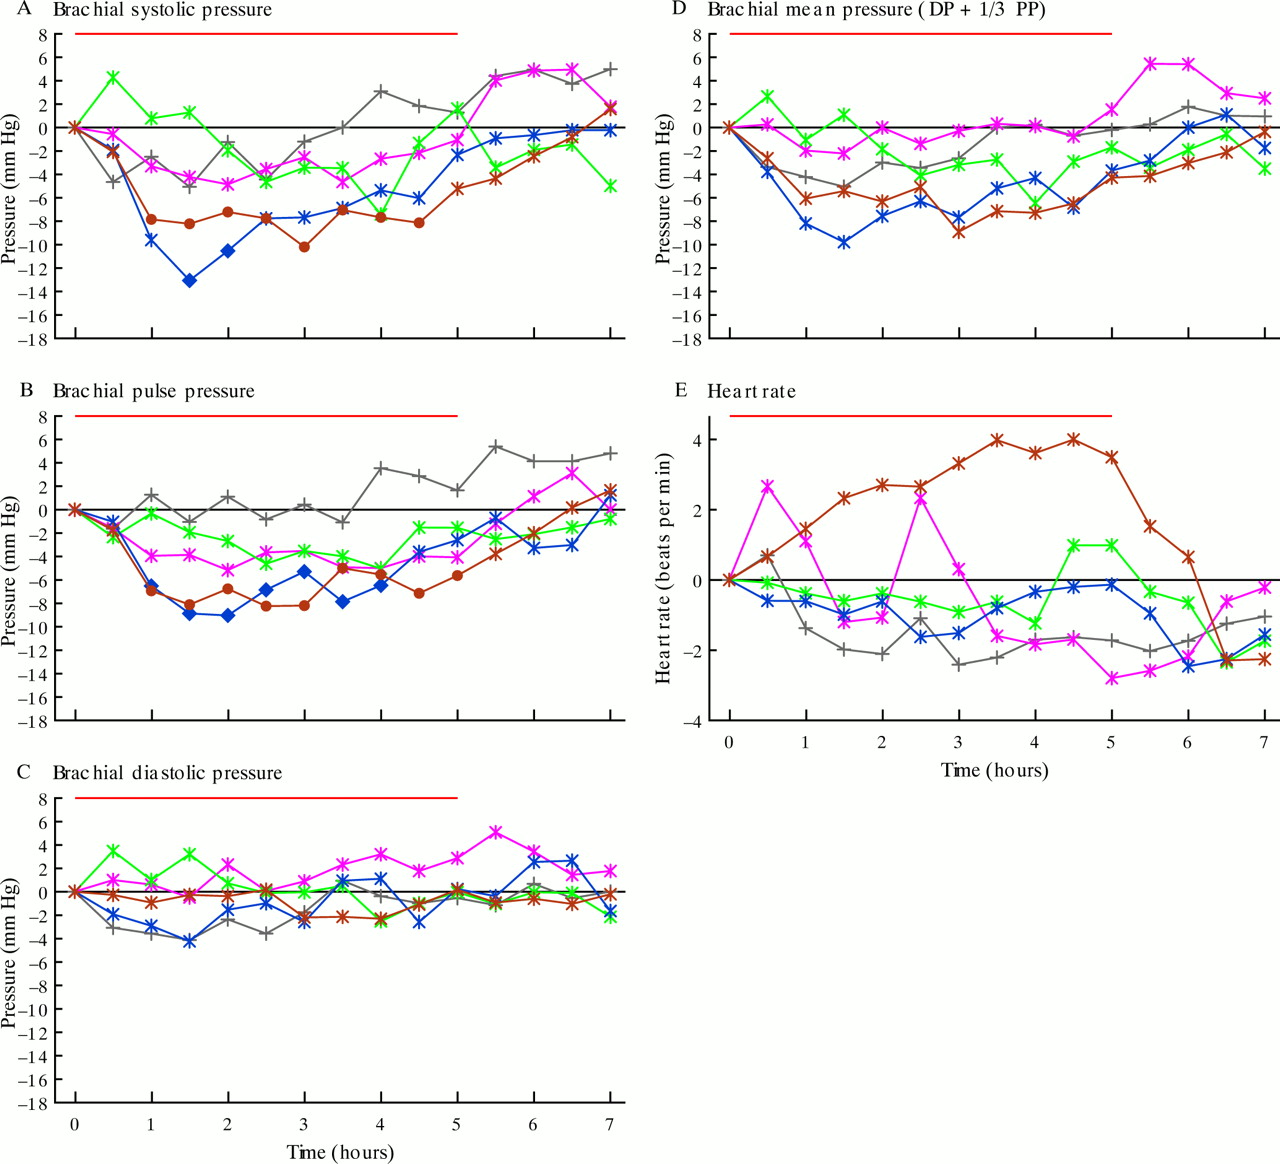
Change with time in conventional observations (brachial systolic pressure (A), pulse pressure (B), diastolic pressure (C), and mean pressure (D), calculated as diastolic plus one third pulse pressure) and in heart rate (E) before (time zero) and after application of a GTN patch delivering 0.104, 0.208, 0.416, and 0.625 mg/h and after removal of the patch at the fifth hour. Black symbols: placebo; pink: 0.104 mg/h; green: 0.208 mg/h; blue: 0.416 mg/h; brown: 0.625 mg/h. Small circles represent insignificant change from baseline, large circles represent significant differences (p < 0.01). Red line above each graph indicates the period during which the GTN patch was applied.
For statistical analysis, differences were expressed in relation to the original baseline determinations using analysis of variance. For multiple comparisons, a difference was considered significant only for p < 0.01.
RESULTS
Change with time in conventional indices
There was no significant change in diastolic or mean brachial pressure for any dose of GTN during patch application (fig 3). Brachial systolic and pulse pressures did not change with the two lower doses but did fall significantly with the higher GTN doses. Systolic and pulse brachial pressure fell between 60–90 minutes of patch application and returned to baseline within 60 minutes of patch removal. Heart rate did not change (p > 0.05). Results confirm that GTN has no effect on conventional vital signs at lower doses but causes modest changes in brachial systolic and pulse pressure only at higher doses.
Change with time in indices determined from the aortic pressure waveform
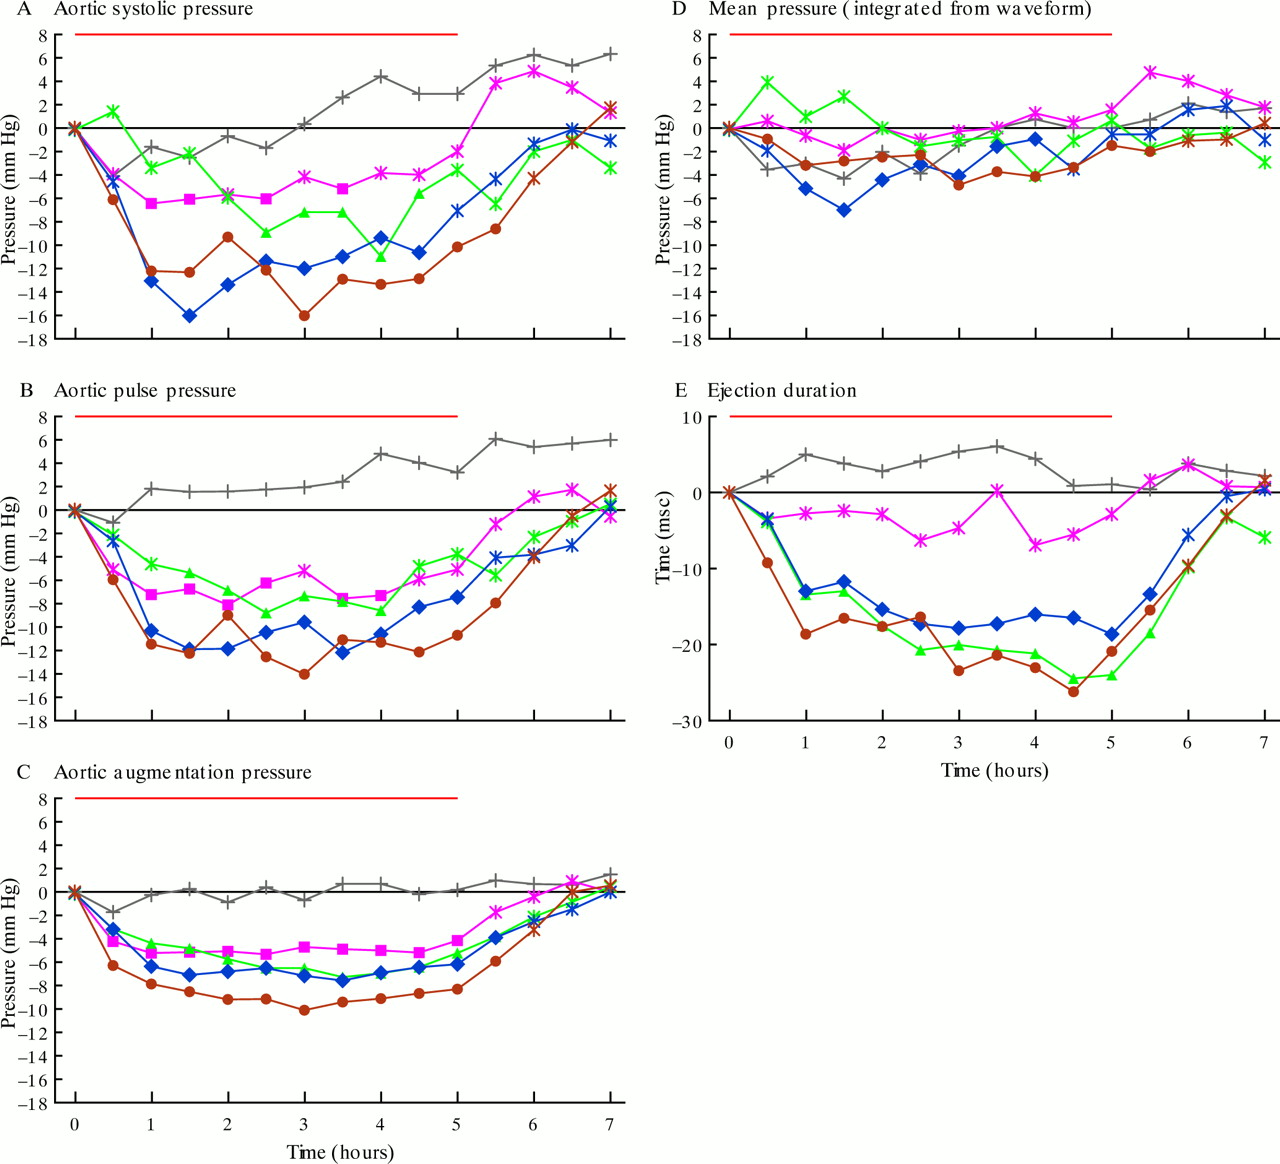
In contrast to the conventional indices, there were consistent and dose dependent changes in calculated ascending aortic augmented pressure, ascending aortic systolic and pulse pressures, mean pressure integrated from the radial pressure waveform, and left ventricular ejection duration (fig 4). These were associated with changes in contour of the radial artery pulse wave, as described by Murrell1 (fig 1) and as we6,13,18 (fig 2) and others7,19 have noted previously for the radial and brachial artery.

Aortic waveform analysis showing change with time in aortic indices derived from the pulse waveform. Indices are ascending aortic systolic (A) and pulse pressures (B), ascending aortic augmented pressure (C) (height from first systolic shoulder to peak), integrated mean pressure (D), and left ventricular ejection duration (E). See caption to fig 3 for key.
The lowest dose of GTN caused a substantial fall of 4–6 mm Hg in estimated aortic pressure augmentation. This effect was apparent within 30 minutes of patch application and remained relatively stable between 1–5 hours (when the patch was removed), reverting to baseline 1–2 hours thereafter. The higher doses of GTN caused slightly greater effects with the same time course. Calculated aortic systolic pressure fell to the same degree as augmented pressure with the 0.104 and 0.208 mg/h GTN doses but to a greater degree with the higher doses of 0.416 and 0.625 mg/h, in association with a fall in brachial systolic pressure. The time course was identical to the change in augmented pressure with a near maximal effect at one hour and with the effect wearing off within two hours of patch removal. While heart rate remained constant, ejection duration fell with the 0.208, 0.416, and 0.625 mg/h doses, with a maximal effect apparent somewhat later than pressure change and with the effect wearing off within two hours of patch removal. Mean pressure, integrated from the pressure wave, fell up to 10 mm Hg with the two higher doses but there was no significant change with the lower doses.
Dose dependent change
Changes were intriguing when graphed according to dose (fig 5). In fig 5, changes in pressure, heart rate, and ejection duration were averaged over 0.5–5.0 hours while the patch was applied. The decrease in aortic augmentation was greatest with the smallest initial dose of GTN. This occurred with no significant change in heart rate or ejection duration. The subsequent small decrease in augmented pressure with the higher doses of GTN was associated with a reduction in left ventricular ejection duration. A significant decrease in ejection duration was seen with the 0.208 mg/h dose and remained constant at higher doses. A decrease in calculated aortic systolic pressure with doses > 0.208 mg/h GTN paralleled the fall in the integrated mean pressure; this fell significantly only at the two higher doses. Heart rate did not change significantly (p > 0.05).

Averaged pressure change (between 0.5–5.0 hours) as a function of GTN dose for: (A) brachial systolic pressure (open circles), brachial diastolic pressure (open squares), and brachial mean pressure (open triangles); (B) estimated ascending aortic systolic pressure (open circles), augmented systolic pressure (open squares), and mean pressure integrated from the pressure waveform (open triangles); and (C) ejection duration (open diamonds). Solid symbols represent values where p < 0.01. For brachial systolic pressure (solid circles), p < 0.01. For aortic systolic (solid circles) and aortic augmented pressure (solid squares), p < 0.0001 at all doses. For aortic integrated mean pressure (solid triangles), p < 0.001 at dose > 0.416 mg/h. For left ventricular ejection duration (solid diamonds), p < 0.001 at doses > 0.208 mg/h.
DISCUSSION
It is now generally agreed that the principal therapeutic benefits of low dose GTN derive from the drug's effect on conduit arteries and on larger veins and venules.4,5 The effect on arterioles, with peripheral vasodilatation and reduction in peripheral resistance, is usually seen only with higher doses of the drug.4,5 Clinical effects of nitrates have proved extremely difficult to quantify on account of the absence of any accepted technique for measuring their effect on conduit arteries and veins. Therapeutic benefit has usually been assessed in patients with angina pectoris from repeated stress tests, on the ability to prolong exercise duration before the onset of angina,4 or in patients with heart failure, on the ability to increase stroke volume and cardiac output.13,20–22
Analysis of the arterial pulse waveform, as described here, does provide information about the effects of nitrates on conduit arteries, though this effect is modified by a change in venous return and on arteriolar dilatation at the higher doses.
Our earlier study on ascending aortic impedance18 from data obtained at cardiac catheterisation with low dose GTN found evidence of a reduction in peripheral wave reflection, which occurred in the absence of a fall in peripheral resistance. We attributed these changes to dilatation of peripheral muscular conduit arteries with subsequent reduction of wave reflection and leading to decreased aortic and left ventricular systolic pressures.13,20,23,24 In subsequent studies we showed that these effects were not apparent in the brachial systolic pressure on account of a concurrent change in contour of the aortic (and upper limb) pressure waveform (fig 2).6 These findings have been confirmed by others.7,19
The present study extends those done previously by showing that the effects of GTN are apparent in a dose dependent fashion on aortic pressure wave augmentation and on aortic systolic pressure. These effects can also be inferred from inspection of the radial pressure wave, recorded non-invasively, with attention to features in the wave that were first described over 120 years ago.1 Analysis of the pulse waveform also gives further information on left ventricular ejection duration and on the true integrated mean pressure.
The data presented suggest that the three mechanisms of nitrate action—on conduit arteries, on veins, and on arterioles—can be identified from analysis of the pulse waveform, in association with conventional sphygmomanometry. The initial fall in aortic augmented pressure with the 0.104 mg/h dose was not associated with any change in heart rate, left ventricular ejection duration, or brachial artery pressures. It cannot be attributed to a change in venous return or peripheral resistance, and so is attributable entirely to a reduction in wave reflection after conduit arterial dilatation, as previously described.6,13,18 At the higher doses, this effect was intensified but was associated with a reduction in left ventricular ejection duration. The reduction in left ventricular ejection duration is attributable to venodilatation with a reduction in venous return.25 There was no apparent change in the other factors (left ventricular contractility, heart rate) that alter ejection duration.25 At the highest doses (0.416–0.625 mg/h) there was a reduction in peripheral systolic and integrated mean pressures, in addition to a reduction in ejection duration, suggesting a reduction in peripheral resistance through arteriolar dilatation. We interpret the results as showing effects of GTN on conduit arteries at the lowest dose of 0.104 mg/h, with higher doses showing the same effect though modified by the influence of the drug on veins and venous return at doses over 0.208 mg/h. At higher doses, the additional reduction in peripheral systolic and integrated mean pressure is attributable to arteriolar dilatation.
These results are in line with other studies that have compared nitrate action on larger conduit and smaller resistive arteriolar vessels in the heart and that suggest that the greater sensitivity of conduit arteries to GTN4,5,20,24,26 is caused by the greater availability of sulfydryl group donors.27 Such effects have not been reported for other systemic arteries or veins. Previous studies18,13,23–25 indicate that the same difference in reactivity to GTN between conduit arteries and resistive arterioles is present throughout the circulation, not just in the coronary vessels, while our results presented here suggest that the reactivity of systemic veins is intermediate between that of arteries and arterioles. Such interpretation needs confirmation.
The study conducted here was deliberately undertaken in patients without evidence of cardiac failure. With cardiac failure, a reduction in afterload from conduit arterial dilatation may cause an increase in stroke volume and cardiac output, with an increase in ejection duration,13,21,22 and therefore venodilatation cannot be inferred from this parameter.
The technique described here of pulse wave analysis appears to have an important place in assessment of nitrate action and may prove useful in studying the interaction of nitrates with other drugs such as sildenafil.28,29 Sildenafil potentiates the action of GTN by reducing the breakdown of cyclic GMP, which is generated by GTN. The principal side effect of GTN used in conjunction with sildenafil (hypotension) is attributable to a decrease in venous return and to arteriolar dilatation.29 The arterial effect appears to be the predominant therapeutic action of GTN4,5 and can be achieved with dosages ≤ 0.104 mg/h. It is possible that dosages of GTN well under 0.1 mg/h will prove to be effective and safe in association with sildenafil—especially if monitored with a technique such as that used here,28 where information contained in the pulse waveform is exploited, as by Murrell over 120 years ago before the cuff sphygmomanometer had been introduced into clinical practice. Recent studies of finger photoplethysmography have yielded similar but less quantitative information.30
Interpretation of the arterial pulse, as practised for centuries,1–3 appears to have an important place for non-invasive monitoring of drugs such as GTN, and for determining their effects on different segments of the vascular tree.
Limitations
In this study there were differences in age, baseline blood pressure, number classified as hypertensive (systolic blood pressure ≥ 140 mm Hg or diastolic blood pressure ≥ 90 mm Hg), and sex in the five groups. There was no significant difference in response that could be attributed to any of these factors but the numbers of patients in the groups were small (9 or 10). The study had a parallel group rather than crossover design, which would have been more compelling, but logistic requirements for hospitalised patients made this impractical. The study was conducted with hospitalised patients so that we had complete control of diet and treatment (including herbs). Racial differences may exist but to date no significant difference in response to nitrates or other vasodilators has been shown between western and Chinese32 or Japanese subjects.7,30,31 All interpretations are made from conventional blood pressure measurements, complemented by pulse wave analysis. While interpretations are in line with previous studies, those on venous effects and arteriolar effect, particularly, require confirmation.
REFERENCES
Footnotes
-
↵* Founding director of AtCor Medical, Sydney, Australia