Article Text

Abstract
Objective: To assess right ventricular systolic function using indices derived from tricuspid annular motion, and to compare the results with right ventricular ejection fraction (RVEF) calculated from radionuclide angiography.
Design: Pulsed Doppler echocardiography indices were obtained from 10 patients with a normal RVEF (group 1) and from 20 patients whose RVEF was less than 45% (group 2).
Results: The patients in the two groups were similar in age, systolic blood pressure, and heart rate. There was a close correlation between the tricuspid annular motion derived indices (D wave integral (DWI), peak velocity of D wave (PVDW), and tricuspid plane systolic excursion (TPSE)) and RVEF (r = 0.72, 0.82, and 0.79, respectively). DWI was significantly higher in group 1 than in group 2. PVDW discriminated adequately between individuals with abnormal and normal right ventricular ejection fraction. The sensitivity and specificity of tricuspid annular motion derived indices were very good.
Conclusions: Indices derived from tricuspid annular motion appear to be important tools for assessing right ventricular systolic function.
- right ventricular ejection fraction
- tricuspid annular motion
- pulsed Doppler
- radionuclide angiography
- DWI, D wave integral
- MPAP, mean pulmonary artery pressure
- PVDW, peak velocity of D wave
- RVEF, right ventricular ejection fraction
- TPSE, tricuspid plane systolic excursion
Statistics from Altmetric.com
- DWI, D wave integral
- MPAP, mean pulmonary artery pressure
- PVDW, peak velocity of D wave
- RVEF, right ventricular ejection fraction
- TPSE, tricuspid plane systolic excursion
Assessment of the right ventricular ejection fraction (RVEF) is difficult owing to the complex structure and asymmetrical shape of the ventricle.1 In contrast to the left ventricle, the right ventricular cavity does not resemble a clear tridimensional geometrical solid to serve as a model for calculations.1–5
The ejection fraction calculated from radionuclide angiography is independent of a geometrical model and has become the standard method for determining right ventricular systolic function.6 Cross sectional echocardiography has been widely used for determining left ventricular function, though its role in the assessment of the right ventricular function remains uncertain. Kaul and colleagues, taking advantage of the fact that there is normally substantial motion of the tricuspid plane in the meridional (longitudinal) direction, showed that this motion reflected right ventricular systolic function.7,8 More recently, a technique has been described involving atrioventricular motion dynamics, using pulsed Doppler cross sectional echocardiography.9 This allows assessment of ventricular performance in the meridional direction. Our aim in the present study was to assess right ventricular function using indices derived from tricuspid annular motion and compare the results with RVEF calculated from radionuclide angiography.
METHODS
Study population
Thirty patients underwent radionuclide angiography for assessment of right ventricular ejection fraction. Immediately after the completion of the radionuclide study, all patients were submitted to pulsed Doppler cross sectional echocardiography. Blood pressure and heart rate were obtained before the echocardiographic study. Twenty patients were male (age range 29 to 77 years) and 10 were female (20 to 64 years). The patients were divided into two groups according to the right ventricular ejection fraction, measured by radionuclide angiography. Group 1 consisted of 10 patients (three women and seven men), mean (SD) age 47.4 (13.1) years, and with a normal RVEF (> 45%)10; this group was formed of patients without clinical, electrocardiographic, or echocardiographic evidence of heart disease. Group 2 consisted of 20 patients (seven women and 13 men), mean age 51.7 (16.2) years, and with an RVEF < 45%.10 This group was composed of nine patients with pulmonary hypertension, six with dilated cardiomyopathy, three with liver cirrhosis of viral aetiology and tricuspid regurgitation, one with severe systemic hypertension, and one with an atrial septal defect that had been surgically repaired. None of these patients had any evidence of previous myocardial infarction.
The study was approved by the ethics committee of the Hospital of the University of Campinas.
Acquisition of the radionuclide angiography data
All patients underwent radionuclide angiography for assessment of RVEF. These radionuclide studies used red cell labelling, achieved by an intravenous injection of stannous pyrophosphate followed by technetium-99 pertechnetate 15–20 minutes later. None of these patients had atrial fibrillation or frequent premature ventricular complexes.
Images were acquired with a scintillation camera equipped with a high sensitivity collimator. All patients were studied in the 45° left anterior oblique projection with caudal tilt to maximise chamber separation. Gated cardiac blood pool images were collected at a rate of six frames per cardiac cycle, for a total of 500 000 counts per frame. The total acquisition time ranged from 6–8 minutes.11,12
Processing of the radionuclide angiography data
Image analysis required a light pen delineation of regions of interest over the right ventricle in both end diastole and end systole. These frames were determined from a time–activity curve generated over the right ventricle. The RVEF fraction was calculated from the following equation:

The lower limit of normal for the RVEF is 45%.10 The reproducibility of the manual technique for RVEF determination has been defined in our department, with an interobserver agreement of 0.92.
M mode and cross sectional echocardiography data analysis
Our data were acquired using an ATL UltraMark 4 machine (Advanced Technology Laboratories, Bothel, Washington, USA), with 3 and 5 MHz transducers and Doppler. For hard copy we used a Sony video printer.
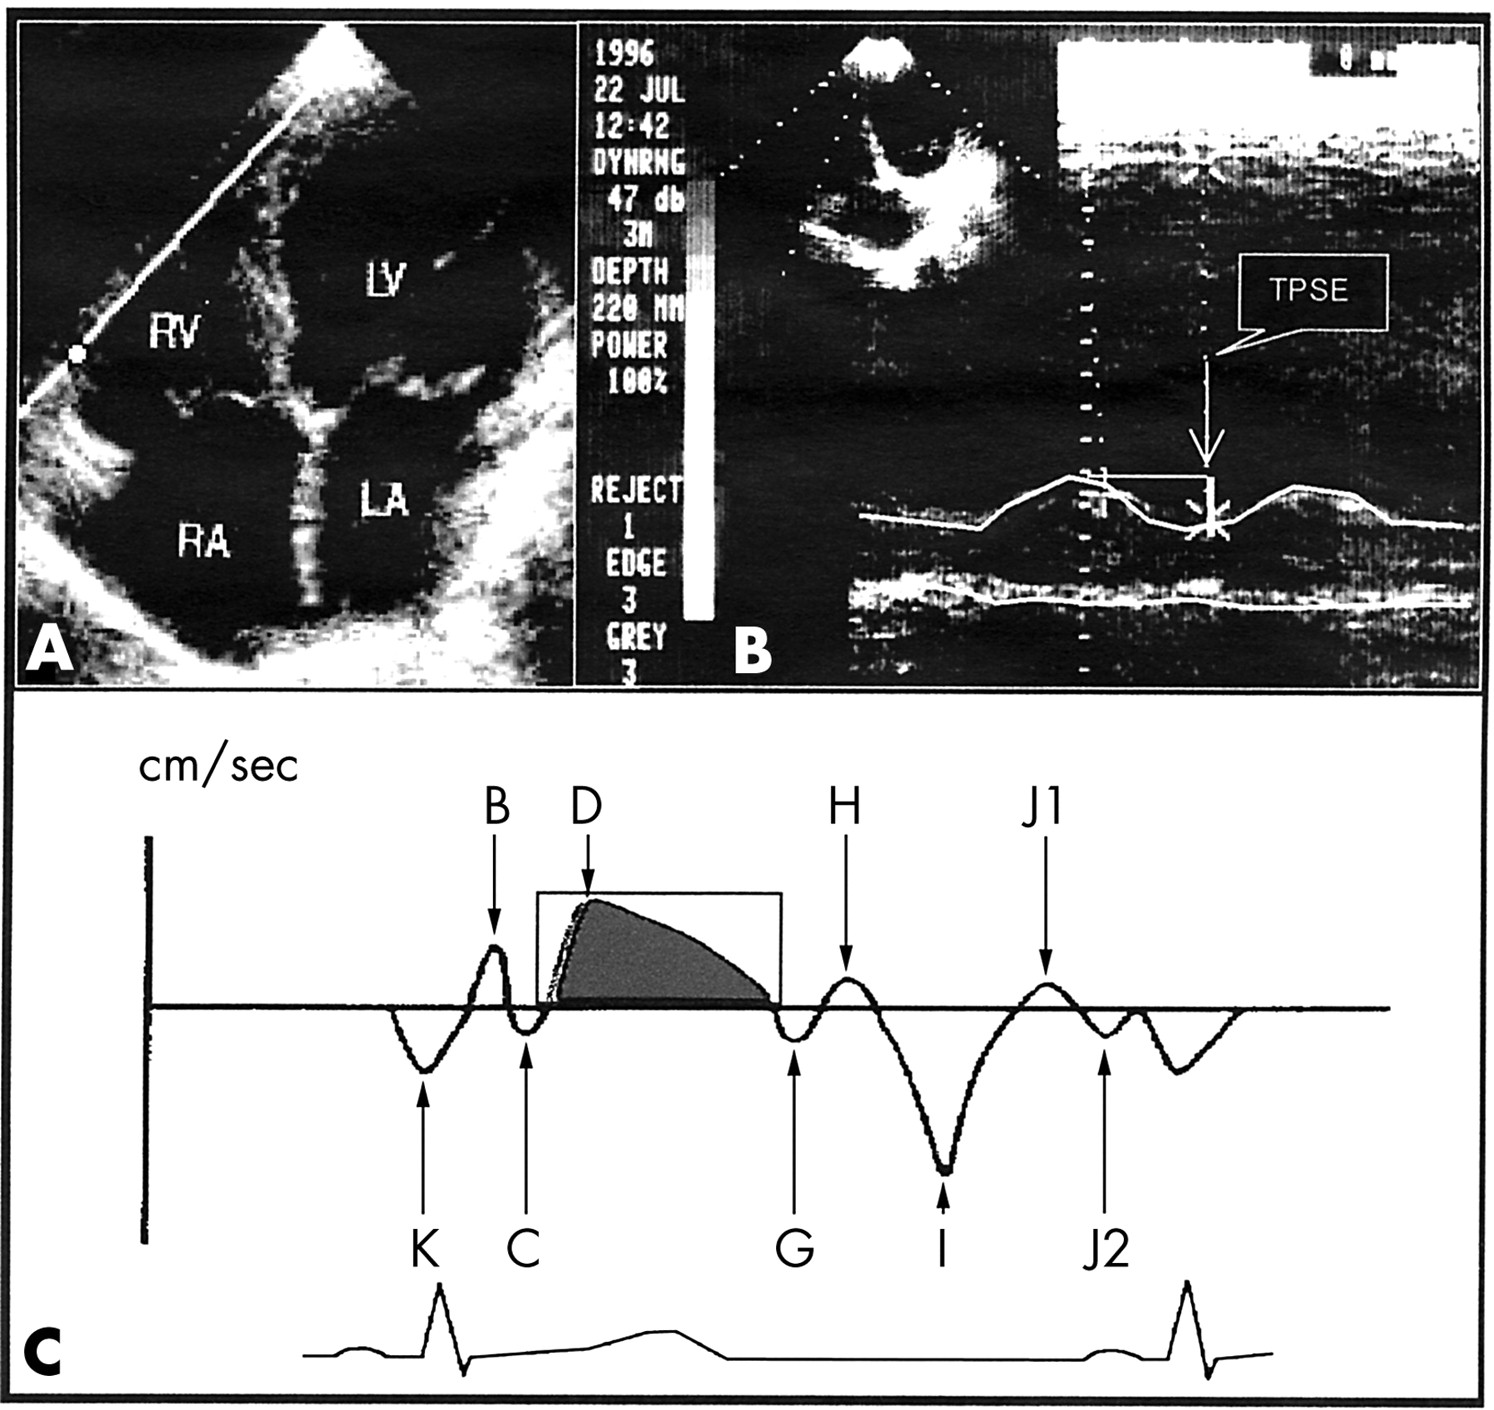
The M mode cursor was oriented to the junction of the tricuspid valve plane with the right ventricular free wall, using images of the apical four chamber view. This generates echoes that are received and registered as motion of the right ventricular base (fig 1A). Tricuspid plane systolic excursion (TPSE) was defined as the difference in the displacement of the right ventricular base during diastole and systole (fig 1B).7 Tricuspid plane excursion in M mode was measured on-line. Mean pulmonary artery pressure was estimated from the right ventricular outflow tract acceleration time.13

(A) A four chamber view in a patient: the M mode cursor or sample volume is located at the junction of the right ventricular free wall and the tricuspid annular plane. (B) Schematic illustration of atrioventricular plane motion by M mode. (C) Schematic illustration of atrioventricular plane motion by pulsed Doppler. Adapted from reference 9. LA, left atrium; LV, left ventricle; RA, right atrium; RV, right ventricle; TPSE, tricuspid plane systolic excursion.
Pulsed Doppler of tricuspid annular plane
From the cardiac image in the apical four chamber view, the pulsed Doppler sample volume with a fixed length of 10 mm was placed within the lateral margin of the tricuspid annulus (fig 1A). The echocardiographic cursor was oriented so that it was parallel to the direction of tricuspid annular motion. To record the low Doppler shift frequencies produced by the moving wall, the wall filter was set at 100 Hz and the gain control was reduced to magnify the quality of the graphic signal. Signals were differentiated from atrioventricular flows by their opposite direction, higher energy, timing, and unique audio signal. We calculated the mean value from three beats during held expiration.9 Measurements were obtained from the same echocardiographic tracing, but not necessarily the same beat, by one observer and later by the second observer.
Pulsed Doppler of tricuspid annular plane data analysis
During motion of the tricuspid annular plane, the Doppler signals showed a succession of positive and negative velocity waves (fig 1C). Positive waves corresponded to apically directed motion of the atrioventricular plane and negative waves to atrially directed motion. In systole, the Doppler signal showed a large positive wave related to the displacement of the tricuspid annular plane towards the apex, called the D wave. This wave was digitised. The peak velocity of the D wave (PVDW) was obtained. The area under the D wave—the D wave integral (DWI)—gave an estimate of the tricuspid plane systolic excursion (fig 1C).9 PVDW was measured on-line. We measured the area under the D wave as follows: first, the video printer film was scanned with a Genius CollorPage SP2X machine associated with a Pentium II 133 MHZ computer; second, the D wave trace was digitised and planimetered with a custom program developed at the University of Campinas Chemical Institute.
Statistical analysis
All data were expressed as mean (SD). Interobserver agreement was assessed by linear regression analysis, coefficient of repeatability, Pitman's test of difference in variance, and the Bland–Altman plot. Univariate and multivariate linear regression analysis were employed to assess the relation between the echocardiographic indices and the right ventricular ejection fraction. Pitman's test of difference in variance and the Bland–Altman plot were also employed to assess the differences between the echocardiographic indices and right ventricular ejection fraction when all these variables were standardised (mean = 0, standard deviation = 1). The ability of the indices to classify the patients according to normal and abnormal right ventricular function was assessed with univariate and multivariate linear discriminant analysis, which provided the optimal cut-off points for accuracy prediction and calculation of sensibility and specificity. Differences between the two groups were assessed using Student's t test. All analyses were considered significant at a probability value of p < 0.05. Data analysis was performed with S-PLUS 2000 software14 and Stata 6.0.15
RESULTS
Acquisition of the echo Doppler data was successful in all patients, so there were no exclusions because of inadequate examination. The demographic, clinical, eletrocardiographic, echocardiographic, and radionuclide angiography data are summarised in table 1. There were no significant differences in age, heart rate, or systolic blood pressure between groups 1 and 2 (table 2).
Clinical, demographic, electrocardiographic, echocardiographic, and radionuclide angiography data in the two study groups
Comparison between clinical and echocardiographic data in the two groups
Mean (SD) right ventricular ejection fraction was 51.7 (5.4)% in group 1 and 22.7 (10.4)% in group 2. Interobserver agreement and repeatability analyses of DWI showed that there was a significant difference between the two measurements:
-
positive Pitman's test of difference in variance: r = 0.650, p < 0.001
-
positive Pitman's variance ratio test: ratio of standard deviations = 1.5778, 95% confidence interval (CI) 1.2766 to 1.9501, t = 4.530, df = 28, p < 0.001
-
Bland–Altman plot (not shown): positive trend.
Interobserver agreement and repeatability analyses of PVDW showed that there was no significant difference between the two measurements:
-
negative Pitman's test of difference in variance: r = −0.147, p = 0.449
-
positive Pitman's variance ratio test: ratio of standard deviations = 0.9412, 95% CI 0.8039 to 1.1019, t = −0.785, df = 28, p = 0.439
-
Bland–Altman plot (not shown): no trend.
Univariate linear regression and correlation between RVEF and the echocardiographic indices were all statistically significant:
-
DWI = 0.04 + 0.014 RVEF, r2 = 0.52, r = 0.72, p < 0.001
-
TPSE = 0.016 + 0.019 RVEF, r2 = 0.63, r = 0.79, p < 0.001
-
PVDW = −0.12 + 0.035 RVEF, r2 = 0.68, r = 0.82, p < 0.001.
Multivariate linear regression analysis showed that a model including PVDW, TPSE, and their interaction had very strong significance, with r2 = 0.8445.
Bland–Altman plots of each of the echocardiographic variables in standardised form (mean = 0, standard deviation = 1) with RVEF, also in standardised form, showed no trends and no difference in variance (fig 2). Pitman's test showed that there was no difference in variance for standardised DWI: r = 0.00, p = 1; standardised TPSE: r = 0.00, p = 1; or standardised PVDW (r = 0.00, p = 1).

Bland–Altman plots of right ventricular ejection fraction. Top: standardised D wave integral (SDWI); centre: standardised tricuspid plane systolic excursion (STPSE); bottom: standardised peak velocity of the D wave (SPVDW). The horizontal lines represent mean and 2 SD of the calculated differences.
Univariate linear regression and correlation between mean pulmonary artery pressure (MPAP) and the echocardiographic indices were all significant and showed an inverse relation:
-
DW = 29.68 − 0.25 MPAP, r2 = 0.3541, r = −0.60, p < 0.005
-
TPSE = 24.32 − 0.23 MPAP, r2 = 0.3784, r = −0.61, p < 0.004
-
PVDW = 16.89 − 0.12 MPAP, r2 = 0.3896, r = −0.62, p < 0.000.
The linear regression and correlation between MPAP and RVEF was also significant and inverse: RVEF = 49.01 − 53.06 MPAP, r2 = 0.2586, r = − 0.51, p < 0.020.
Sensitivity, specificity, and test accuracy from univariate linear discriminant analysis were all above the 75% level (table 3). Multivariate linear discriminant analysis showed that the best discriminant model included PVWD and TPSE, in accordance with the multivariate linear regression analysis.
Discriminant regression analysis of the pulsed Doppler echocardiographic indices and group classification
DISCUSSION
Our study showed that indices derived from tricuspid annular motion—DWI, PVDW, and TPSE—were strongly correlated with radionuclide right ventricular ejection fraction. Individually, PVDW was the best index, followed by TPSE and DWI in that order, while multivariate regression analysis showed that a linear model involving both PVDW and TPSE had the greatest significance. These results were also mirrored by the ability of these indices to discriminate patients with good right ventricular function from those with abnormal function. Their sensitivity and specificity suggest that they are suitable for clinical use, especially considering the low cost, the short time required to acquire the images, and the simple and rapid analysis, in contrast to the radionuclide technique.
Kaul and colleagues, using cross sectional echocardiography and radionuclide angiography, observed that the measurement of tricuspid annular plane systolic excursion could reflect systolic function.7 Ghio and colleagues, using M mode cross sectional echocardiographic and thermodilution derived right ventricular ejection fraction measurements, demonstrated that tricuspid plane motion can be considered a physiological index of right ventricular function.16 More recently, Meluzin and colleagues and Moustapha and associates obtained similar results.17,18
Our results showed a significant inverse correlation between MPAP and RVEF, DWI, PVDW, and TPSE. This reflects the well known relation between pulmonary artery pressure and RVEF in pulmonary,19 myocardial,20 and valvar heart disease21 and results from the dependence of right ventricular systolic function on afterload.
Along with previous studies, our investigation appears to add new clinical significance to the physiological behaviour of tricuspid plane motion.7–9 The tricuspid annular plane systolic displacement seems to be important and is not influenced by its complex structure and asymmetrical shape. In the right ventricle, the atrioventricular plane to apex shortening is more pronounced. This has been documented by Rushmer and colleagues in animals.8 Similarly, methods using magnetic resonance myocardial tagging and tissue Doppler imaging have also shown a significant meridional motion of the right ventricle.1,9 Furthermore, the disposition of the muscles and other structures of the inflow region of the right ventricle suggest that movement occurs in the meridional plane during right ventricular contraction.2 It is known that the myocytes are disposed longitudinally in the inflow region and are therefore more sensitive to meridional stress.2
In this study, we did not obtain right ventricular systolic and diastolic areas, owing to lack of echocardiographic definition of the endocardial borders. The complex shape of the right ventricle limits the use of cross sectional echocardiography for assessing right ventricular function.22 The right ventricle is prone to considerable changes under abnormal preload and afterload, which makes the right ventricular cavity even more geometrically complex.1,2,23–25 In addition, inadequate definition of the endocardium impedes accurate calculation of the area of the right ventricular cavity. Similar difficulties have been reported by other observers.26,27
Radionuclide angiography has been considered the standard method for assessing the right ventricular ejection fraction because it does not depend on the complex geometry of the right ventricle.6,10,28 Nonetheless, this procedure requires injection of radionuclide markers and has a low spatial resolution. Furthermore, the technique suffers from attenuation artefacts, and differentiation between the right ventricle and the right atrium may be difficult.4,29 As well as radiation exposure to the patient, an additional drawback is that the cost is much greater than the echocardiographic study.
Possible limitations
Our indices only took account of meridional excursion during systole. Theoretically, the influence of the motion of the entire heart should be evaluated. However, we did not use any additional variables because of technical difficulties. Radial shortening and regional area reduction are dependent on the complex shape of the right ventricle.7,16 Pronounced translational movement of the heart is another cause of conflicting results.1 We need to consider the possibility that our measurements were inaccurate when the beam was not parallel but formed an angle between the M mode cursor (or the Doppler sample volume) and the meridional excursion of the lateral margin of the tricuspid plane.30
Difficulties in tracking the D wave edge are another possible limitation, and thus its integral and peak velocity—recorded by pulsed Doppler—may be overestimated.31
What would be the effect of a local segmental contraction abnormality of the right ventricle on these indices? In previous studies we showed that the left ventricular base descends in the direction of the cardiac apex and that the apex stays almost stationary during systole.32 In this context, if we imagine the heart to be divided into several segments in a longitudinal direction from base to apex, longitudinal movement of the base would be a summation of the excursion of each of these segments in a longitudinal direction and would thus represent global systolic performance. In this model each segment would add an equal share of contraction, irrespective of whether it is a basal segment or an apical segment. We think this model can also be applied to the right ventricle. The presence of a poorly contracting longitudinal segment—say the apical segment—will reduce the summation of movements and, accordingly, lead to a reduction in base descent. This reduced base descent should, in our view, be interpreted as a reduction in global performance. This emphasises that movement of the base in the direction of the apex measures global performance, not local behaviour of the basal segments. Where there is poor contraction of all segments, summation of the movements would still lead to a much more inadequate base descent. This hypothesis has been confirmed.33
We did not assess the influence of sustained expiration during acquisition of the variables derived from the longitudinal movement of the tricuspid plane. Nonetheless, there are published data showing that the measurement of indices derived from the tricuspid inflow during expiration are almost identical to those acquired during apnoea. Thus we do not think this is a cause of error. To minimise this possible problem and improve reproducibility we used data from at least three heart beats in each patient.34
Conclusions
Indices derived from tricuspid annular motion appear to be important clinical tools for assessing right ventricular systolic function. They are able to discriminate patients with normal right ventricular function from those with abnormal function, with good sensitivity and specificity.