Article Text

Abstract
Objective: To explore the application of a new 10 French intracardiac echocardiography (ICE) catheter with phased array and Doppler capable transducer for the assessment of epicardial and intramyocardial coronary blood flow.
Methods: The coronary arteries were detected by cross sectional imaging in seven closed chest dogs, and coronary blood flow visualised by colour Doppler. Blood flow velocities were recorded by pulsed Doppler at baseline for reproducibility of repeated measurements, and during hyperaemia for coronary flow reserve measurements. Comparisons were made with Doppler guide wire data obtained simultaneously. Intramyocardial coronary artery blood flow was assessed by colour flow mapping, and the blood flow velocities recorded using pulsed Doppler at baseline and during hyperaemia.
Results: Seven left main, six left anterior descending, seven left circumflex, and five right coronary arteries were visualised in the seven animals by cross sectional or colour Doppler imaging. Repeated measurements of coronary flow velocity showed a good correlation (mean diastolic velocity, r = 0.93, n = 22, p < 0.0001; peak diastolic velocity, r = 0.96, n = 22, p < 0.0001, respectively). Intraobserver/interobserver variability was satisfactorily low. Coronary flow reserve from ICE correlated highly with the value obtained from the Doppler guide wire (r = 0.90, n = 26, p < 0.0001). Intramyocardial coronary blood flow was identified in all seven dogs, and flow velocities were recorded at baseline and during hyperaemia in four animals.
Conclusions: This new ICE catheter provides high quality diagnostic resolution. It is useful for coronary blood flow assessment.
- intracardiac echocardiography
- Doppler echocardiography
- coronary circulation
- ICE, intracardiac echocardiography
- TOE, transoesophageal echocardiography
- TTE, transthoracic echocardiography
Statistics from Altmetric.com
- ICE, intracardiac echocardiography
- TOE, transoesophageal echocardiography
- TTE, transthoracic echocardiography
Intracardiac echocardiography (ICE) is a promising method for visualising cardiovascular structures as cross sectional images.1 It measures cardiac volume,2–4 assesses aortic valve and coronary ostial stenoses,5–8 can monitor ablation catheters,9,10 and can guide transcatheter atrial septal defect closure11 or trans-septal catheterisation in electrophysiological studies or balloon mitral valvuloplasty.12,13 However, as it is limited to cross sectional imaging and Doppler capable devices, it has not been used in humans, although modified transoesophageal probes have been introduced directly into animal vascular systems.14,15
A 10 French catheter equipped with a multifrequency phased array and a Doppler capable transducer has been developed and used in human haemodynamic studies.16,17 We explored the ability of this instrument to assess human epicardial and intramyocardial coronary blood flow using colour and pulsed Doppler imaging.
METHODS
Animal preparation
Seven closed chest beagle dogs (mean weight 7.7 kg, range 7.0–8.7 kg) were anaesthetised with sodium pentobarbitone (sodium pentobarbital) (10 mg/kg intravenously), intubated, and mechanically ventilated. Heart rate and ECG were monitored continuously. This protocol complied with the institutional board for animal study, Osaka City University.
Identification of epicardial coronary arteries
The 10 French ICE catheter was connected to echocardiographic equipment (Sequoia 512, Acuson Inc, Mountain View, California, USA). The imaging field was a unique longitudinal scan plane along the catheter shaft. Image resolution was excellent (3 mm at near field, 120 mm at field remote from the transducer surface). The Doppler sample volume could be positioned unless it was less than 5 mm from the transducer.
The ICE catheter with phased array transducer was advanced through an 11 French sheath from the femoral vein into the right atrium under ultrasound navigation. The catheter, which has a four way articulation control, was rotated or manipulated slightly, allowing optimal positioning for best cross sectional and Doppler images. Cross sectional echocardiograms were performed at 8.5 MHz or 10 MHz, and colour Doppler examinations were performed at 5.0 MHz. In colour Doppler flow mapping, the velocity range was 20–40 cm/s. Colour gain was adjusted to provide optimal images. First, the aortic root was imaged in the cross sectional plane, and then the orifice of the left main coronary artery, left anterior descending coronary artery, and left circumflex coronary arteries were visualised.
Detection of pulsed Doppler signals of the epicardial coronary artery
The sample volume (2 mm wide) was positioned on the colour signal in the proximal left anterior descending coronary artery, and Doppler spectral tracings of flow velocity were recorded. The ultrasound beam was almost parallel to the blood flow direction and the Doppler angle was near 0°.
To confirm reproducibility, we recorded coronary blood flow velocity twice under baseline conditions at the same sample position and compared the values obtained.
Following baseline recording, maximum hyperaemia was induced after an intravenous bolus of 20 μg/kg of adenosine 5‘-triphosphate (Torinosin S, Yamanouchi Pharmaceutical, Tokyo, Japan), and hyperaemic flow velocity was obtained. Colour Doppler signals and velocity spectra of the coronary blood flow were recorded on videotape and digital clip.
Doppler guide wire
A 5 French guiding catheter for percutaneous transluminal coronary angioplasty was advanced from left internal carotid artery through a 6 French sheath and engaged the left coronary artery orifice, guided by fluoroscopy and ultrasound navigation of ICE. A 0.014 inch (0.55 mm), 15 MHz Doppler guide wire (FloWire, JoMed Inc, Rancho Cordova, California, USA) was inserted through the guiding catheter into the proximal left anterior descending coronary artery. The tip of the wire was positioned near the pulsed Doppler sample volume (fig 1). Basal and hyperaemic blood flow velocities were obtained simultaneously with ICE and the Doppler guide wire. Coronary flow velocities were recorded on videotape using the Doppler guide wire and a velocimeter (FloMap, JoMed Inc).

Orientation of the intracardiac echocardiographic catheter and the Doppler guide wire. DGW, Doppler guide wire; GC, guiding catheter; ICE, intracardiac echocardiography; LAD, left anterior descending coronary artery; LCX, left circumflex coronary artery; LMCA, left main coronary artery; RCA, right coronary artery.
Blood flow assessment of intramyocardial coronary artery
An apical view showing the left ventricular apex from the right atrium or a long axis view from the right ventricle was obtained in cross sectional images, for identification of the intramyocardial coronary arteries. Imaging depth was decreased with a colour Doppler frequency of 5.0 or 6.0 MHz. For colour flow examination, the colour flow velocity range (Nyquist limit) was adjusted to a low level (10–20 cm/s), the Doppler velocity filter was set at middle level, and the colour persistence and gain settings were adjusted for optimal intramyocardial coronary flow images.
The sample volume (2 mm wide) was located within the linear colour Doppler signal for as much of the cardiac cycle as possible. A pulsed Doppler signal from the intramyocardial coronary artery flow was identified as having a characteristic, predominantly diastolic, flow pattern which discriminated the flow in small coronary arteries from that in veins.
Data analysis
Experienced investigators analysed each study. Measurements were performed by tracing pulsed Doppler signal contours using software (View ProNet, Acuson Inc). Mean and peak diastolic velocities, obtained as coronary flow velocity parameters, were averaged over three cardiac cycles.
The coronary flow velocity spectrum recorded on videotape by Doppler guide wire was also digitised by an off-line personal computer. Digitised velocity spectra of mean diastolic velocity were averaged over three cardiac cycles. Coronary flow reserve was calculated as the ratio of the mean diastolic velocity during maximum hyperaemia to that at baseline, using ICE and Doppler guide wire data.
Intraobserver and interobserver variability
To determine the variability of the coronary flow velocity measurements made using ICE, Doppler velocity recordings (n = 30), selected randomly in two dogs, were remeasured with the same system by the same observer at different times (more than one month apart) and by two independent observers, each without knowledge of the other results obtained.
Statistical analysis
Data are expressed as means (SD). Student’s t test for paired samples was used to compare hyperaemic flow velocity with basal flow velocity. Pearson’s correlation coefficient and linear regression analysis were used to analyse correlations between repeated measurements of coronary flow velocity, and between coronary flow reserve determined by ICE and by Doppler guidewire. Bland–Altman plots were used to assess the limits of agreement between two measurements of coronary blood flow velocity by ICE.18 Results were considered significant at p < 0.05.
RESULTS
Detection of epicardial coronary arteries
Figure 2 shows left and right coronary artery images using cross sectional and colour flow images. We were able to visualise the orifice and the proximal portion of the coronary artery. Cross sectional and/or colour Doppler images allowed visualisation of seven left main coronary arteries, six left anterior descending coronary arteries, seven left circumflex coronary arteries, and five right coronary arteries in the seven animals.

Cross sectional (upper left panel) and colour flow imaging (upper right panel) of the left main, left anterior descending, and left circumflex coronary arteries, and cross sectional imaging of the right coronary artery (lower left panel) in the short axis view of the aortic root. Ao, aorta; LAD, left anterior descending coronary artery; LCx, left circumflex coronary artery; LMCA, left main coronary artery; PA, pulmonary artery; RCA, right coronary artery; RVOT, right ventricular outflow tract.
Reproducibility of repeated measurements of coronary flow velocities
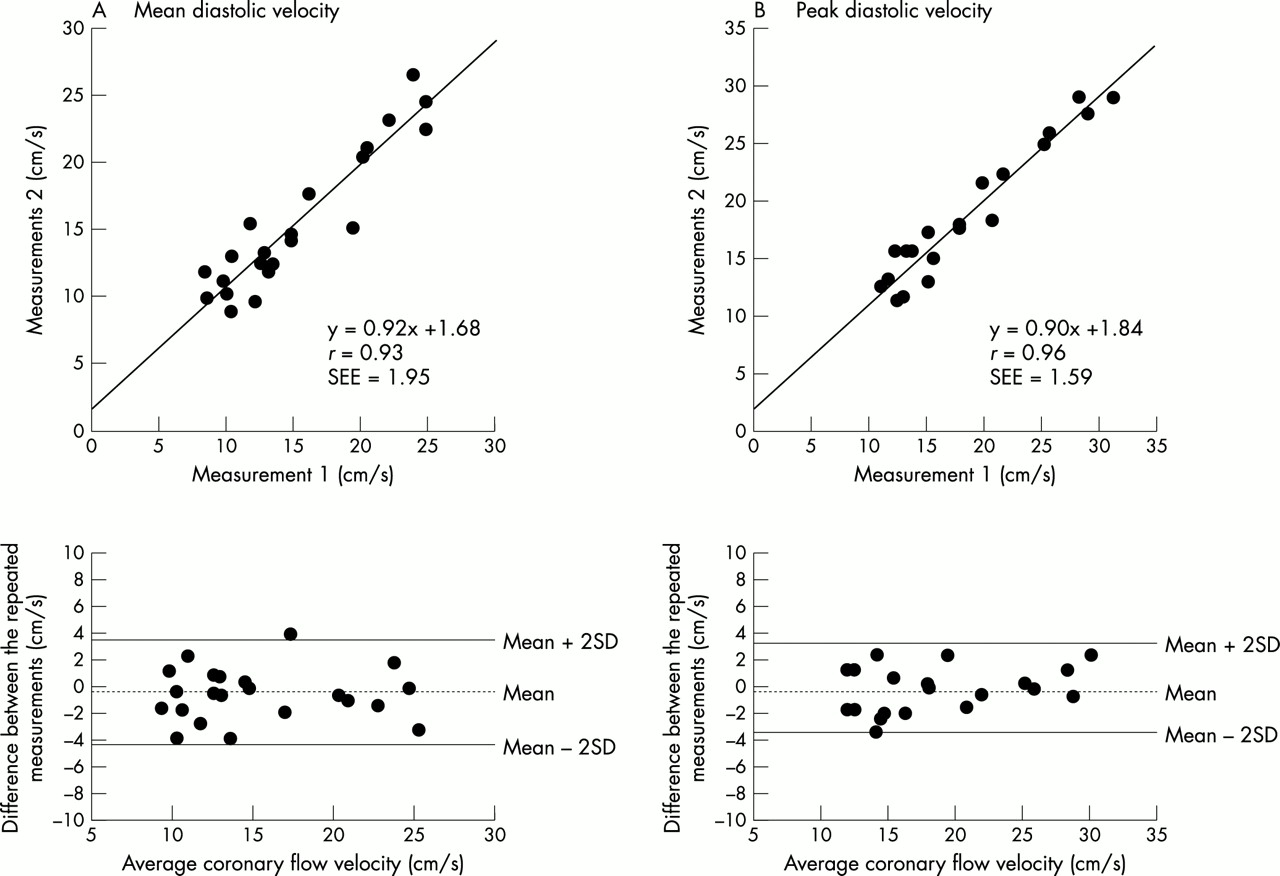
There was good correlation and agreement between first and second mean and peak diastolic coronary flow velocities under baseline conditions (mean diastolic velocity, measurement 1 v 2, r = 0.93, n = 22, p < 0.0001; peak diastolic velocity, measurement 1 v 2, r = 0.96, n = 22, p < 0.0001, respectively) (fig 3).

Correlation (upper panels) and agreement (lower panels) between the first and the second measurements of coronary blood flow. In the lower panels, the dashed and solid lines indicate means with standard deviations of the difference. Left hand panels (A) show the mean diastolic velocity, and right hand panels (B) show the peak diastolic velocity of coronary blood flow.
Coronary flow velocities at baseline and during hyperaemia
Figure 4 shows pulsed Doppler signals in the proximal left anterior descending coronary artery at baseline and during hyperaemia. Mean diastolic coronary flow velocities by pulsed Doppler under baseline and hyperaemic conditions were 17.0 (5.9) cm/s and 39.3 (14.1) cm/s, respectively (n = 26, p < 0.0001).

Pulsed Doppler signals in the proximal portion of the left anterior descending coronary artery under baseline conditions and during hyperaemia.
Comparison between coronary flow reserve determined using ICE and using Doppler guide wire
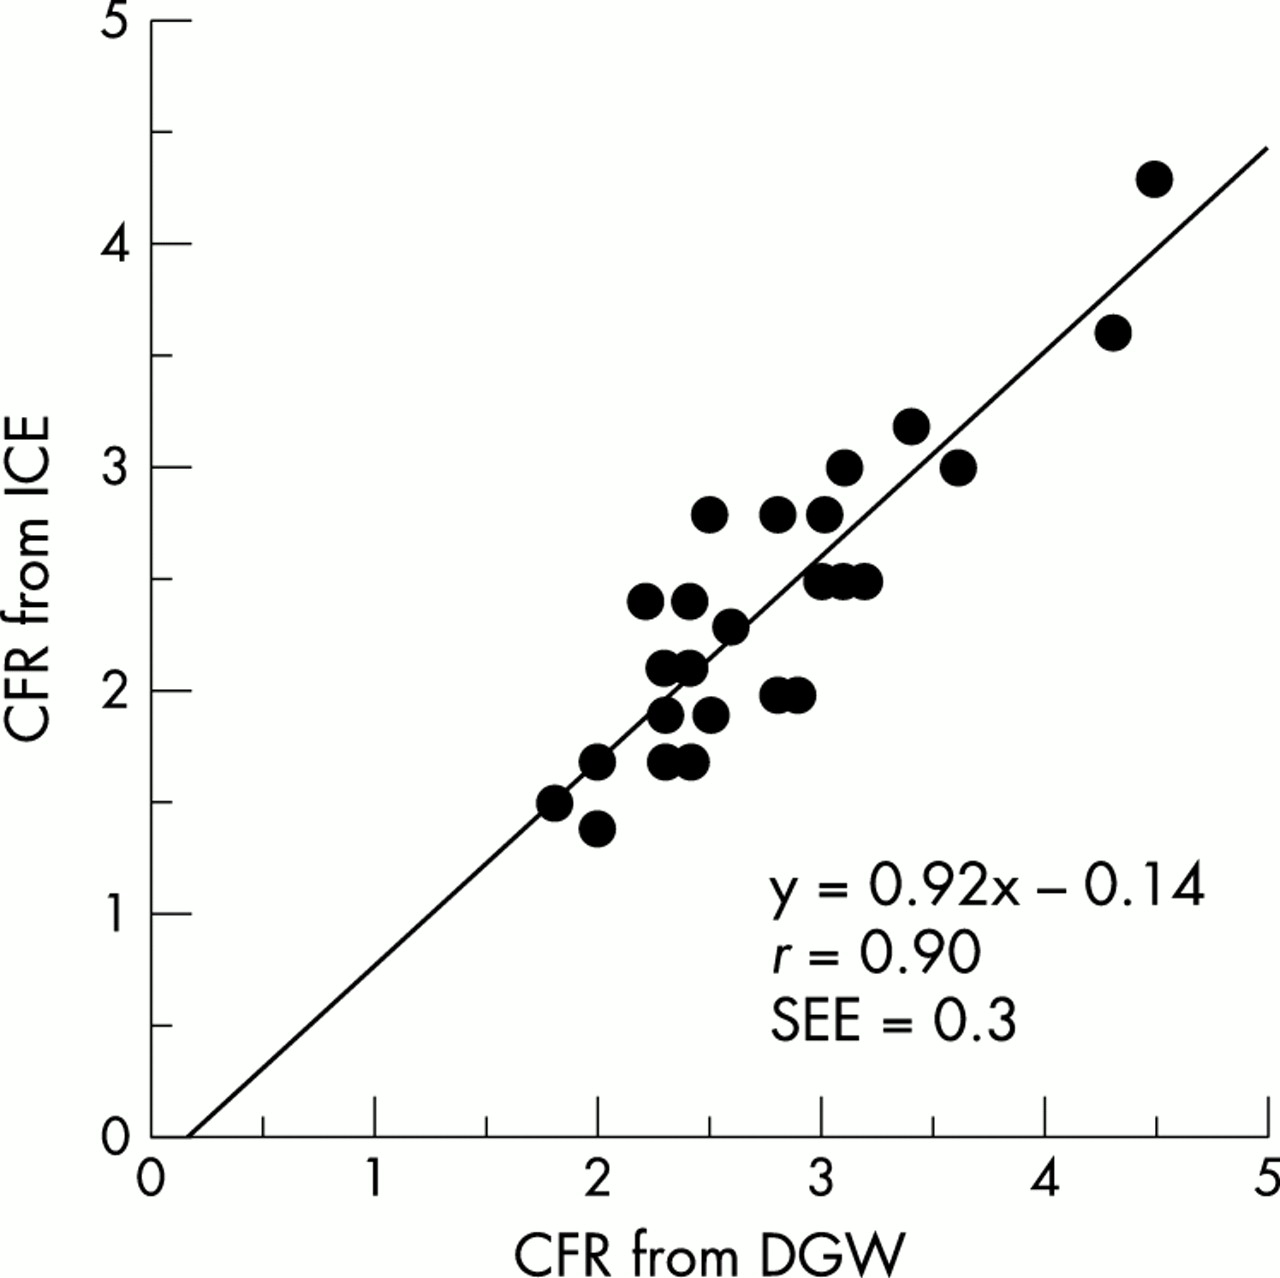
To compare coronary flow reserve determined by ICE and by Doppler guide wire, we measured mean coronary blood flow velocities at baseline and during hyperaemia using the two methods simultaneously (fig 1). There was close agreement between the values obtained with each method (r = 0.90, n = 26, p < 0.0001) (fig 5).

Correlation between values for coronary flow reserve obtained using Doppler guidewire and using intracardiac echocardiography. CFR, coronary flow reserve; DGW, Doppler guidewire; ICE, intracardiac echocardiography.
Intraobserver and interobserver variability
There was a high index of both intraobserver agreement (r = 0.998, mean difference 0.24 (1.01) cm/s) and interobserver agreement (r = 0.998, mean difference −0.41 (0.48) cm/s) in tracing curve outlines for coronary flow velocity.
Detection of intramyocardial coronary artery flow
Figure 6 shows intramyocardial coronary artery flow in the apical view, with left ventricular apex view (left panel) and long axis view (right panel) obtained from the right atrium and right ventricle, respectively. Linear intramyocardial colour Doppler signals were shown in all seven animals. Pulsed Doppler signals were detected in four of the seven animals (fig 7). Mean diastolic coronary flow velocity was measured by pulsed Doppler under baseline and hyperaemic conditions (13.1 (3.4) cm/s and 40.9 (22.3) cm/s, respectively; n = 13, p = 0.0003).

Colour flow images of intramyocardial coronary blood flow (arrows) in the apical view, showing the left ventricular apex (left panel) and the long axis view (right panel). For these views, the intracardiac echocardiography catheter was positioned in the right atrium and the right ventricle, respectively.

Pulsed Doppler signals of intramyocardial coronary blood flow in the interventricular septum under baseline conditions and during hyperaemia.
DISCUSSION
Detection of coronary blood flow with intracardiac echocardiography
A 10 French catheter with multifrequency, phased array, and Doppler capability has been developed and applied to haemodynamic studies of transvalvar flow by colour, pulsed, and continuous wave Doppler, and mitral annular excursion by tissue Doppler in humans.17
Our study suggests that this catheter is also helpful in determining coronary blood flow. We detected epicardial coronary arteries by cross sectional imaging, visualised coronary blood flow by colour flow imaging, and measured flow velocity by pulsed Doppler. There was good correlation and agreement between repeated measurements. There was also a close correlation between ICE and Doppler guide wire measurements of coronary flow reserve. In addition, we were able to assess intramyocardial coronary blood flow by colour or pulsed Doppler.
Comparison with other methods of evaluating coronary blood flow
Proximal coronary artery and coronary blood flow determinations can also be made by transoesophageal echocardiography (TOE), which has better image quality than transthoracic echocardiography (TTE).19–21 TOE with a high frequency transducer enables intramyocardial blood flow assessments to be made in the operating room.22 However, recent advances in TTE now permit non-invasive detection of coronary blood flow in the distal epicardial coronary arteries from the chest wall23,24 as well as in intramyocardial coronary arteries.25,26
TTE images are sometimes suboptimal in the interventional laboratory and the operating room, while TOE requires sedation and cannot always be used—for example, if there are oesophageal varices. ICE circumvents these disadvantages. Image quality improves because the transducer frequency is higher and the transducer is closer to the structure of interest. Continuous monitoring of left ventricular function or coronary blood flow would be feasible in the operating room, during cardiac intervention, or at the bedside using this technique. Prolonged examination is also possible in a conscious patient with less discomfort than with TOE. In addition, ICE allows measurements of intramyocardial coronary blood flow to be made in the interventricular septum, while with intraoperative TOE the measurements are limited to the inferior or lateral wall of the left ventricle.22 The ICE catheter can therefore be used to evaluate blood flow not only in the epicardial arteries but also in the intramyocardial arteries.
Study limitations
This study had some limitations. Firstly, coronary blood flow velocity was measurable using ICE only in the proximal epicardial coronary arteries. Secondly, translocation through the cardiac cycle may be a reason for differences between repeated measurements, or for insufficient contour recordings of flow velocity on some occasions. Thirdly, it is more difficult to visualise the right coronary artery, and to detect blood flow in that artery, than to visualise the left coronary artery, as the right coronary artery originates from the right aortic sinus and passes down the right atrioventricular groove at a sharp angle, and the direction of colour flow signals is perpendicular to the echo beam. Finally, differences in human and dog body size must be considered when applying the findings to humans.
The technique has disadvantages. ICE is invasive, needs local anaesthesia, and causes transient patient discomfort. The ICE catheter is limited to one imaging plane, while a conventional TOE probe provides a multiplane transducer. On some occasions, fine manipulation of the transducer may be difficult, so it can be hard to obtain an optimal image.
Conclusions
An ICE catheter with a phased array, multifrequency (5.5–10 MHz), full Doppler capability provides high quality diagnostic resolution. It appears suitable for use in assessing epicardial and intramyocardial coronary blood flow.
REFERENCES
Footnotes
-
↵* Now at Wakakusa Daiichi Hospital