Article Text

Abstract
Background: Intravenous myocardial contrast echocardiography with harmonic power Doppler imaging (HPDI) enables assessment of myocardial perfusion. Its accuracy in comparison with positron emission tomography (PET), which is one of the most reliable clinical gold standards for myocardial perfusion, remains to be determined.
Objective: To assess the ability of HPDI to identify myocardial perfusion abnormalities, using PET as a gold standard.
Methods: 23 patients with myocardial infarction underwent HPDI. Images were obtained from the apical two and four chamber views at pulsing intervals of one to eight cardiac cycles with continuous infusion of Levovist (Schering, Germany). PET was done within two weeks of HPDI. The left ventricle was divided into 12 segments and myocardial opacification by HPDI and uptake of NH3 by PET in each segment was graded as normal, mildly reduced, or severely reduced.
Results: Of the 276 segments examined, adequate image quality was obtained in 226 (82%) by HPDI; 50 segments were excluded because of inadequate image quality. There were more exclusions in the basal segments than in the mid or apical segments (p < 0.0001). Of the 226 segments analysed, overall concordance between HPDI and PET was 82% (χ = 0.70). In the apex, more segments were overestimated by HPDI than were underestimated (χ2 = 6.25, p = 0.012).
Conclusions: HPDI and PET gave similar results in the assessment of myocardial perfusion abnormalities. However, poor image quality in the basal segments and overestimation of perfusion in the apical segments are current limitations of HPDI.
- myocardial contrast echocardiography
- harmonic power Doppler
- positron emission computed tomography
- HPDI, harmonic power Doppler imaging
- MCE, myocardial contrast echocardiography
- PET, positron emission tomography
Statistics from Altmetric.com
- HPDI, harmonic power Doppler imaging
- MCE, myocardial contrast echocardiography
- PET, positron emission tomography
Intravenous myocardial contrast echocardiography with harmonic power Doppler imaging (HPDI) has emerged as a promising new clinical method for assessing myocardial perfusion.1,2 HPDI has advantages over B mode harmonic imaging in that the latter is limited by persistent tissue noise caused by the non-linear backscatter characteristics of the myocardium.3–6 Recently, Wei and colleagues have shown that intravenous myocardial contrast echocardiography with a continuous infusion of microbubbles is a potential way of assessing physiological myocardial perfusion.7 However, the assessment of myocardial perfusion by HPDI using a continuous infusion of a contrast agent has not been fully tested in the clinical setting. We undertook this study to assess the ability of HPDI to identify perfusion abnormalities after myocardial infarction. We compared the HPDI results with those obtained using positron emission tomography (PET), which is considered to be one of the most reliable standards for assessing myocardial perfusion in regions of impaired function or reduced blood flow.8,9
METHODS
Patient population
Patients were enrolled between January and December 2000 if they had a history of myocardial infarction between two weeks and six months before recruitment and if there was adequate visualisation of the myocardium from apical views. All the patients were scheduled to undergo myocardial contrast echocardiography with HPDI and PET. Twenty three patients were studied (two women and 21 men). Their median (SD) age was 60 (13) years (range 29–77 years). They all gave their written informed consent to the investigations.
Patients who were not in sinus rhythm or who had acute myocardial infarction less than two weeks before, or who had congestive heart failure or unstable angina, were excluded. The site of the infarction was anteroseptal in 17 patients and inferoposterior in six. Coronary angiography was not a requirement for entry into the study, but 20 of the 23 patients underwent this procedure on clinical grounds. The infarct related artery was identified as the left anterior descending coronary artery in 14 patients, the right coronary artery in four, and the circumflex coronary artery in two.
Myocardial contrast echocardiography
Intravenous myocardial contrast echocardiography (MCE) was performed using a Sonos 5500 instrument (Agilent Technologies, Andover, Massachusetts, USA) with HPDI. We used a broad band transducer with harmonic mode transmitting and receiving at mean frequencies of 1.8 and 3.6 MHz, respectively. The emission power was set at the highest level (mechanical index 1.4 to 1.6) and gain settings were optimised for each patient. We set the imaging parameters as follows: pulse repetition frequency, more than 3 kHz (3.0–4.3 kHz); packet size, M; smoothing level, 5; line density, medium. Doppler gain was adjusted to maximise myocardial opacification and attenuate wall motion artefacts. The images were obtained by triggering at end systole, and a dual trigger mode was employed in which the first ultrasonic exposure was triggered after a given pulsing interval for perfusion imaging, and the second ultrasonic exposure was triggered just after the first exposure for non-perfusion imaging. Myocardial opacification was ascertained by comparing these two images. Pulsing intervals were altered from one to eight cardiac cycles. The focus was basically set at the level of the mitral ring and was moved to an appropriate level when necessary.
We used Levovist (Schering) as a contrast agent. This is a suspension of galactose microparticles of median diameter 2 μm. Levovist was prepared in the standard manner as a concentration of 300 mg/ml and was infused intravenously at a rate of 600–1200 mg/min, using an infusion device. During the initial two minutes of the infusion, we adjusted the gains, scan planes, and infusion rates to optimise myocardial opacification. After a two minute waiting period from the beginning of the infusion, image acquisition was started. The transmission power, overall gain, repetition frequency, and image depth were held constant during image acquisition for each patient. Images were obtained from the apical two and four chamber views.
The left ventricle was divided into 12 segments (four segments each for basal, middle, and apical levels (fig 1)). One independent reviewer (TM) who had no knowledge of the patients’ history, PET findings, or other clinical data, graded the myocardial opacification in each segment as normal, mildly reduced, or severely reduced. A normal segment was defined as a segment with thick homogeneous opacification. A mildly reduced segment was defined as one with light homogeneous or patchy opacification. A severely reduced segment was defined as one with almost no opacification with long pulsing intervals. Myocardial contrast echocardiograms were undertaken within 10 days of the PET study (mean 2.4 days) in all cases.

Segments analysed for myocardial perfusion. Left: four chamber view. Right: two chamber view. LA, left atrium; LV, left ventricle; RA, right atrium; RV, right ventricle.
Positron emission tomography
For PET imaging, a Shimazu-SET 1400 W-10 PET scanner was used (Headtome IV, Shimazu Corporation, Kyoto, Japan). This scanner can obtain seven slices simultaneously with 13 mm intervals, with a slice thickness of 11 mm full width at half maximum, and spatial resolution of 4.5 mm full width at half maximum.
A 10 mm transmission scan was done using a rotating germanium-68 rod source. The acquisition data were used to correct emission images for body attenuation. Following completion of the transmission scan, the patient remained in the supine position and received an intravenous injection of 555–740 MBq of NH3. After a three minute delay to allow pulmonary background activity to clear, static non-gated perfusion imaging was achieved over 10 minutes. The left ventricle was divided into 12 segments, as for MCE, and the uptake of NH3 in each segment was graded visually as normal, mildly reduced, or severely reduced by a reviewer (HY) with no knowledge of the clinical data.
Statistical analysis
Kappa statistics were used to determine the concordance between MCE and PET; χ values of > 0.4, > 0.6, and > 0.8 indicated fair, good, and excellent agreement, respectively. Continuous variables are expressed as mean (SD). Differences in categorical variables between groups were assessed by a χ2 test or Fisher’s exact probability test. Interobserver and intraobserver variabilities were assessed by double blinded observers by repeating segmental scoring in 10 subjects. The time period between two interpretations for intraobserver variability ranged from three weeks to one month. Significance was established at p < 0.05.
RESULTS
Segmental basis concordance between MCE and PET
These results are shown in table 1. Of the 276 segments, adequate image quality was obtained in 226 (82%), which were then graded by MCE and PET. The remaining 50 segments were excluded owing to inadequate image quality. Of the 50 excluded segments, 34 (68%) were basal; adequate images were obtained in all but one apical segment. There were significantly more inadequate basal segments than apical or mid segments (χ2 = 33.02, p < 0.0001). With MCE, 121 of the 226 segments were judged normal, 65 as mildly reduced, and 40 as severely reduced, while with PET, 110 segments were judged normal, 78 mildly reduced, and 38 severely reduced. On comparison of the two methods, the overall concordance was good (82%; χ = 0.70).
Contingency table comparing positron emission tomography (PET) with harmonic power Doppler imaging (HPDI) in the apical, mid, and basal segments
In the apical segments, myocardial opacification was adequately visualised in all but one segment, and the concordance between HPDI and PET was good (82%; χ = 0.74, figs 2 and 3). In the mid segments, the concordance between the two methods was also good (83%; χ = 0.69), but 15 segments (16%) were excluded because of inadequate image quality. In the basal segments, the concordance was fair (79%; χ = 0.57), and 34 segments (36%) were excluded because of inadequate image quality.

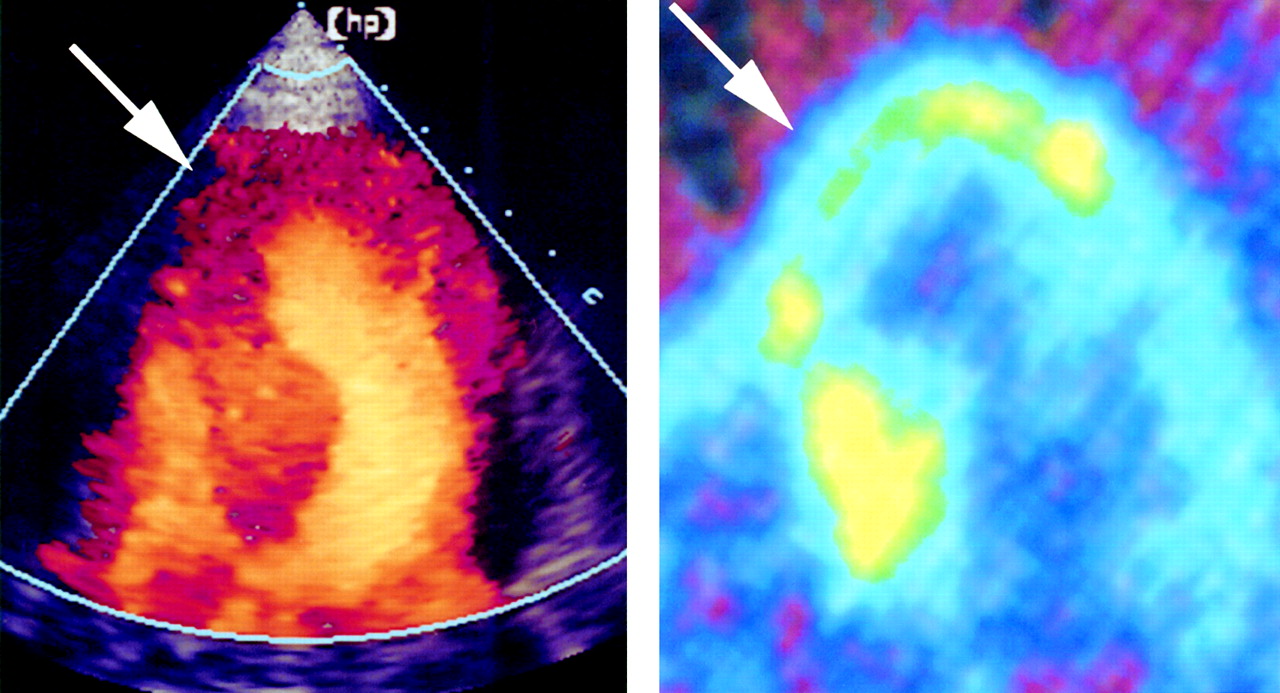
An example of severely reduced segments. Left panel: HPDI image showing an apical-septal defect in the four chamber view. Right panel: PET image in same patient demonstrating an apical defect that was identical to that shown on HPDI.

An example of mildly reduced segments. Left panel: HPDI image showing mildly reduced opacification in the apical septum. Right panel: PET image in the same patient demonstrating mildly reduced uptake identical to that shown by HPDI in the same segments.
Discordant segments
Of the 226 segments analysed, 41 were discordant between the two methods. Of these, 25 were overestimated by HPDI and 16 were underestimated compared with PET (χ2 = 1.98, p = 0.16). In the apex, the number of overestimated segments was significantly greater than the number of underestimated segments (13 v 3 segments, χ2 = 6.25, p = 0.012) (fig 4). All the segments overestimated by HPDI were akinetic and lacking in wall thickening. There were nine segments judged as mildly reduced by HPDI but normal by PET. In six of these nine segments, myocardial opacification at a pulsing interval of four cardiac cycles was almost the same as at a pulsing interval of eight cardiac cycles. In addition, eight of the 10 segments judged to be mildly or severely reduced by HPDI but normal by PET showed normal wall motion on cross sectional echocardiography. When these segments were excluded from the analysis, the concordance between HPDI and PET improved from 82% (χ = 0.70) to 85% (χ = 0.75).

An example of overestimation with HPDI. Left panel: HPDI image showing normal opacification in the apex. Right panel: PET image in same patient showing mildly reduced uptake in the apex.
Reproducibility
The interobserver agreement was 89% (χ = 0.82) for MCE. Intraobserver agreement was 93% (χ = 0.88) and 91% (χ = 0.85) for the two observers.
DISCUSSION
Our results indicate that myocardial perfusion abnormalities assessed by HPDI are similar to those assessed by PET; that image quality achieved with HPDI is good in the apical and middle segments but not ideal in the basal segments; and that one of the causes of discordance between HPDI and PET is overestimation of myocardial perfusion by HPDI in the apical region.
Assessment of myocardial perfusion in the infarcted area by HPDI with continuous infusion
Myocardial perfusion can be assessed in the clinical setting by echocardiography following an intravenous injection of microbubbles. Destruction or resonance of the microbubbles by ultrasonic exposure causes myocardial opacification on echocardiography, the intensity of which reflects the volume of blood in the region.10 Intravenous myocardial contrast echocardiography with continuous infusion of contrast agents allows assessment of physiological indices of myocardial perfusion such as coronary blood flow and myocardial blood volume.7 In addition, using continuous infusion of contrast agents, images can be obtained repeatedly, device settings can be optimised, and noise signals such as motion artefacts or blooming can be minimised. Our present HPDI studies involved continuous infusion of the agent with intermittent ultrasonic exposure. We believe the myocardial perfusion images obtained in this way are reliable and also reflect the physiological state of myocardial perfusion.
Segmental comparison of assessment of myocardial perfusion by HPDI and PET
On segmental comparison, good agreement was attained in the apex, and only one segment was excluded because of inadequate image quality. In the basal segments, on the other hand, concordance was not ideal and many segments had to be excluded. One of the major limitations of HPDI at present is non-uniformity of the ultrasound field in the scan plane. As the myocardial opacification obtained by HPDI depends to a degree upon the focal acoustic pressure, myocardial opacification varies from segment to segment. In the apex, transmitted ultrasound reaches its target without attenuation and lateral resolution is good because of the proximity to the transducer; in the basal segments, however, ultrasound is attenuated and lateral resolution decreases in proportion to the distance from the transducer. Thus it is not surprising that image quality and accuracy may be inadequate in the basal segments.
The results of our study are compatible with those of Heinle and colleagues,4 who reported a relatively low concordance between HPDI and SPECT in the left circumflex coronary artery territory located in the basal segments. In our study, there were nine segments judged to be mildly reduced by HPDI but normal by PET. Most of these segments were opacified at relatively short pulsing intervals similar to the plateau level. As myocardial blood flow should be preserved in normal segments, it is possible that segments opacified at short pulsing intervals indicate preservation of myocardial perfusion despite the low plateau level resulting from non-uniformity of the ultrasound field. Furthermore, many segments underestimated by HPDI showed normal wall motion at rest, and the concordance between HPDI and PET improved when these segments were excluded from the analysis. Thus patterns of opacification and resting wall motion should provide complementary information when assessing myocardial perfusion by HPDI.
Discordance between HPDI and PET
In our study there were some segments showing discordance between HPDI and PET. One of the causes of such discordance was the overestimation of myocardial perfusion by HPDI in the apical infarcted area. Possible reasons for this are the limited dynamic range of HPDI, artefacts produced by the contrast agents, the partial volume effect of PET, and discrepancies between cellular viability and the microvasculature in the risk area.
Dynamic range and artefacts
HPDI is a relatively new method of myocardial contrast echocardiography.1–6 The harmonic power Doppler method transmits a packet of ultrasound pulses along each scan line and displays the amplitude of the signals received, which reflects the number of scatterers.11 As microbubble destruction is directly related to acoustic power, HPDI is highly sensitive to microbubbles. Although HPDI has some limitations such as wall motion artefacts or blooming effects, it has been shown in experimental studies5,6 that the video intensity of myocardial opacification obtained by HPDI correlates very well with myocardial blood volume measured by fluorescent microspheres. Thus, despite the limitations of HPDI, the overestimation observed in this study does not in the main seem to reflect a limited dynamic range or of artefacts produced by the technique.
Partial volume effect
The partial volume effect is a well known limitation of PET.12 Regional tracer concentrations, as visualised on or determined quantitatively from cross sectional images, depend upon regional myocardial wall thickness.13 Loss of systolic thickening can also result in a reduction in regional tracer uptake because the average myocardial wall thickness declines. The partial volume effect is prominent in infarcted areas because of wall thinning and a decrease in wall thickening.14 As all the segments overestimated by HPDI were akinetic and lacking in wall thickening, the partial volume effect appears to be one cause of the discrepancy between HPDI and PET in assessments of myocardial perfusion.
Discrepancies between cellular viability and microvasculature
Myocardial opacification in the risk area has been studied using intracoronary and intravenous myocardial contrast echocardiography. Generally, failure to produce myocardial opacification by myocardial contrast echocardiography nearly always indicates necrotic tissue.15–21 However, studies have shown that normal myocardial opacification does not always indicate normal perfusion or viable myocardium,18–21 although those observations were mainly results obtained during the acute phase of infarction or in experimental occlusion–reperfusion studies. Ohmori and colleagues have shown that necrotic myocardium can be opacified by an intravenous contrast agent early after coronary reperfusion.21 Galiuto and associates have reported that the myocardium can be opacified after reperfusion following three hours of coronary occlusion and that myocardial opacification in the risk area is linearly correlated with regional blood flow assessed by fluorescent microspheres.22 These findings indicate that preservation of the microvasculature in spite of necrosis of myocytes may be the reason why microbubbles opacify the myocardium. Further clinical and experimental investigations are needed in the subacute or chronic phase of infarction to clarify this issue.
Limitations
The number of patients studied was small. Prospective studies with larger numbers of patients are required to clarify the role of HPDI in assessing perfusion in patients with myocardial infarction.
The study patients were selected on the basis of adequate baseline echocardiographic images. HPDI is clearly unsatisfactory when myocardial segments cannot be imaged. Imaging technology and the development of better agents will solve this problem.
We used qualitative analysis of HPDI and PET, as is done in routine clinical practice. Quantitative analysis of myocardial opacification can be achieved by intravenous myocardial contrast echocardiography under clinical as well as experimental conditions.23 Quantitative analysis is likely to result in a more accurate assessment of myocardial perfusion and thus be a better technique for determining the differences between HPDI and PET.
Conclusions
The myocardial perfusion abnormalities assessed by HPDI are similar to those assessed by PET. Low image quality in the basal segments and overestimation of perfusion in the apical segments are the main limitations of HPDI at present.