Article Text

Abstract
Objective: To identify in humans the temporal patterns of no reflow and their functional implications.
Methods: 24 patients with first acute myocardial infarction and successful coronary recanalisation by recombinant tissue-type plasminogen activator (n = 15) or primary percutaneous transluminal coronary angioplasty (n = 9) were studied by myocardial contrast echocardiography within 24 hours of recanalisation and at one month’s follow up. Myocardial contrast echocardiography was performed by intermittent harmonic power Doppler and intravenous Levovist. The regional contrast score index (CSI) was calculated within dysfunctioning myocardium. Videointensity was measured (dB) within risk and control areas and their ratio was calculated.
Results: In 8 patients reflow was observed at 24 hours and persisted at one month. Conversely in 16 patients areas of no reflow were detectable at 24 hours. At one month, no reflow was spontaneously reversible in 9 patients (mean (SD) CSI and videointensity ratio improved from 2.5 (0.5) to 1.4 (0.6) and from 0.6 (0.1) to 0.7 (0.1), respectively; p < 0.05) and was sustained in the remaining 7 patients (CSI and videointensity ratio remained unchanged from 2.6 (0.6) to 2.6 (0.5) and from 0.5 (0.2) to 0.5 (0.2), respectively; NS). Left ventricular function improved significantly in patients with reflow and reversible no reflow. Volumes were enlarged only in patients with sustained no reflow.
Conclusions: No reflow detected at 24 hours may be sustained or spontaneously reversible at one month. Such reversibility of the phenomenon is associated with preserved left ventricular volumes and function. Clarification of the mechanisms of delayed reversibility may lead to tailored treatment of no reflow even in the subacute phase of myocardial infarction.
- contrast media
- microcirculation
- myocardial infarction
- no reflow
- CK, creatine kinase
- CSI, contrast score index
- EF, ejection fraction
- GUSTO, Global utilisation of streptokinase and tissue plasminogen activator for occluded coronary arteries
- LV, left ventricular
- MCE, myocardial contrast echocardiography
- PTCA, percutaneous transluminal coronary angioplasty
- TIMI, thrombolysis in myocardial infarction
- WMSI, wall motion score index
Statistics from Altmetric.com
- CK, creatine kinase
- CSI, contrast score index
- EF, ejection fraction
- GUSTO, Global utilisation of streptokinase and tissue plasminogen activator for occluded coronary arteries
- LV, left ventricular
- MCE, myocardial contrast echocardiography
- PTCA, percutaneous transluminal coronary angioplasty
- TIMI, thrombolysis in myocardial infarction
- WMSI, wall motion score index
In experimental models, after 90 minutes of transient coronary ligation, postischaemic microvascular obstruction can be shown by fluorescent staining or radioactive microspheres.1,2 This no reflow region is consistently observed in all dogs. It is confined to the zone of myocardial necrosis and enlarges progressively in the first few hours following reflow.3 A study using positron emission tomography confirmed that, after initial hyperaemia following coronary reopening, microvascular flow is progressively reduced within the first 24 hours. However, this decrease is temporary, with flow returning to 64 (18)% of normal after four weeks of reperfusion.4
In humans, the no reflow phenomenon has been detected by nuclear scintigraphy,5 myocardial contrast echocardiography (MCE),6,7 magnetic resonance imaging,8 and positron emission tomography,9 on average in about 30% of cases. Preliminary data obtained by MCE with intracoronary contrast injection show dynamic changes of no reflow, particularly in the immediate postcoronary recanalisation phase, with a very large interpatient variability.10–12 These very early changes may be dynamically influenced by reactive hyperaemia or transient plugging by microthrombi and neutrophils, as well as by microvascular spasm.13 Within a given patient, these changes appear to stabilise during the first 24 hours following coronary recanalisation.12 Only few data are available on possible changes of microvascular flow after the first 24 hours.8,14 Furthermore, although the precise mechanisms of no reflow have not been fully clarified, it is believed that the phenomenon may be either prevented or treated only in the very early stage of coronary recanalisation.
To establish the rationale for a possible treatment window for no reflow in the subacute phase of myocardial infarction, we investigated whether, in some patients, no reflow may be spontaneously reversible even after the first 24 hours after recanalisation, leading to preserved left ventricular (LV) function and volumes. To assess no reflow at 24 hours after coronary recanalisation and to follow its possible changes at one month, we used a non-invasive method such as MCE by intravenous contrast administration.
MATERIAL AND METHODS
Study population
Forty consecutive patients presenting in our coronary care unit with a suspected diagnosis of first ST elevation acute myocardial infarction with onset ⩽ 6 hours were considered for enrolment in the study. A diagnosis of myocardial infarction was based on the following: typical chest pain lasting more than 30 minutes and unresolved by glyceryl trinitrate, ST segment elevation > 0.1 mV in at least two contiguous leads in the initial ECG, and creatine kinase (CK) concentration three times higher than the upper normal values. Seven patients were excluded because they met the following exclusion criteria: cardiogenic shock or clinical instability (n = 3); inadequate echocardiographic image quality (n = 2); malignant life threatening diseases (n = 1); or inability to give informed consensus (n = 1). Of the remaining 33 patients, 24 underwent intravenous thrombolysis and nine underwent primary percutaneous transluminal coronary angioplasty (PTCA). The choice between treatments depended only on the availability of catheterisation laboratory staff to perform primary PTCA at the time of each patient’s presentation. Of the 24 patients treated by thrombolysis, five were excluded because they did not have successful coronary recanalisation based on prompt resolution of pain, reduction ⩾ 50% in the ST elevation within 60 minutes from the beginning of thrombolytic treatment, and peak CK concentration within 12 hours.15 Lastly, four patients did not complete the study at follow up (two dropped out and two died before the one month follow up). The final study population was made of 24 patients (20 men, mean (SD) age 62 (9) years). The study was approved by the ethical committee of the Catholic University of the Sacred Heart and all patients gave informed consent to participate in the study.
Recanalisation methods: thrombolysis and PTCA
Thrombolysis was achieved with intravenous recombinant tissue-type plasminogen activator according to the GUSTO (global utilisation of streptokinase and tissue plasminogen activator for occluded coronary arteries) protocol.16 Coronary angiography was performed in all patients within five days (3 (2)) after thrombolytic treatment. This time interval was shorter (24–36 hours after thrombolysis) in patients with no reflow documented at MCE. Catheterisation was performed by the percutaneous femoral approach. After diagnostic coronary angiography, intracoronary glyceryl trinitrate 0.1 mg was administered to reverse any possible epicardial spasm.
Primary PTCA was performed according to the clinical protocol used at our institution. Balloon dilatation was concluded when the residual stenosis reduced the vessel diameter < 30% by quantitative analysis. Coronary angiograms were stored on compact disk for offline analysis. Flow in the infarct vessel was graded by means of the TIMI (thrombolysis in myocardial infarction) flow classification.17
Myocardial contrast echocardiography
Conventional echocardiography and MCE were performed in all patients within 24 hours (19.9 (12.3) hours) of coronary recanalisation and at the one month (40.4 (17.2) days) follow up. Two dimensional echocardiographic images were acquired at rest in the apical four chamber, two chamber, long axis, and parasternal short axis views for the evaluation of regional and global LV function and volumes.
For MCE study, intermittent harmonic power Doppler imaging was performed with a phased array system (Sonos 5500, Philips Medical Systems, Munich, Germany) by use of transmit and receive frequencies of 1.8 and 3.6 MHz, respectively. Intermittent ECG triggered mode was set to one every four (1:4) and eight (1:8) end systolic frames on the peak T wave. The 1:4 triggering interval was selected since it allowed optimal and uniform myocardial opacification in all patients. However, we also acquired the 1:8 triggering interval to be sure that maximal myocardial opacification was achieved in all patients. Acoustic power and compression were maximised and gain settings were optimised at the onset of each study and were held constant throughout. The focus was initially set at two thirds of the depth of the image and then moved at the level of the myocardial segment to be examined. The definitive setting of the ultrasound images was optimised after initial contrast infusion, kept constant throughout the study, and matched at follow up MCE study.
Levovist (Schering AG, Berlin, Germany) was used as contrast agent, consisting of a suspension of galactose microparticles (medium diameter 2 μm) in water (400 mg/ml). After a 2 ml bolus, the rate of infusion was set at 2.0 ml/min. After myocardial videointensity had reached a plateau, contrast images were acquired in the apical four chamber, two chamber, and long axis views. Occasionally, a second Levovist vial infusion was needed to complete the examination of the three apical views. All images were acquired on line in digital format and stored on a magneto optical disk.
Data analysis
In 12 lead ECGs, ST segment elevation was measured in three successive complexes and averaged. ΣST index was calculated as the sum of ST segment elevation in all leads, excluding aVR, divided by the number of leads presenting the elevation.
Twenty four hour and one month echocardiograms were interpreted visually by two experienced observers who had no knowledge of the patient’s identity; disagreement was resolved by consensus. Images were randomised across time points and patients. Regional wall motion was evaluated according to the recommendations of the American Society of Echocardiography18 and a regional wall motion score index (WMSI) was calculated as the sum of the score of dysfunctioning segments divided by the number of these segments. End diastolic and end systolic LV volumes were calculated from four chamber and two chamber views using the modified Simpson biplane method. Ejection fraction (EF) was calculated from the formula [end diastolic volume − end systolic volume]/end diastolic volume). Temporal percentage change of WMSI and LV volumes was calculated from the formula [1 month − 24 hours/1 month]%).
Myocardial opacification at MCE at 1:4 and 1:8 pulsing intervals was assessed visually in each myocardial segment and scored semiquantitatively (1 = normal; 2 = reduced; 3 = absent). Patients were given a no reflow classification when ⩾ 25% of their dysfunctioning segments had reduced or absent opacification (score 2–3). A regional contrast score index (CSI) was calculated as the sum of MCE score in each of the dysfunctioning segments divided by the number of these segments. MCE images were evaluated quantitatively by an experienced investigator who was blinded to the wall motion analysis, using dedicated software (3D Echotech, Quanticon, Hallbergmoos, Germany). In each digitised MCE image, a region of interest was placed within the core segment of the risk area and control area, avoiding endoepicardial borders. The average contrast videointensity was calculated (in dB) in each region and the ratio of risk area to control area was measured.
To assess intraobserver variability of MCE analysis, 16 MCE studies obtained in the first eight patients were independently reviewed by the same observer (LG) 40 (10) days after initial scoring. Interobserver variability was assessed by comparing the readings of two observers (LG, AL). Intraobserver and interobserver variability of CSI was 3.2 (2)% and 4.2 (2)% (absolute difference), respectively. Intraobserver and interobserver variability of videointensity were 2.3 (1)% and 3.3 (2)% (absolute difference), respectively.
Statistical analysis
Data were analysed with the use of the SAS software package (SAS Institute, Cary, North Carolina, USA). Continuous variables are presented as mean (SD) and compared by Student’s t test or Wilcoxon test. Proportions were compared by χ2 analysis. Changes over time of continuous variables and comparison between groups were analysed by two way analysis of variance for repeated measures and Scheffé’s F test. Linear regression analysis was used to assess the correlation between CSI and percentage temporal change in WMSI and LV volumes. Differences were considered significant at p ⩽ 0.05.
RESULTS
Myocardial infarction involved the anterior wall in 20 patients and the inferior in four. Fifteen patients underwent thrombolysis. The infarct related artery was the left anterior descending in 11 patients, the circumflex in three, and the right coronary in one patient. Residual stenosis was < 50% with TIMI grade 3 flow in six patients and < 80% with TIMI 2 flow in nine patients. Nine patients had single vessel disease, three had two vessel disease, and three patients had multivessel disease. None of these patients underwent percutaneous or surgical revascularisation during the study period. Nine patients underwent primary PTCA on the left anterior descending artery with residual stenosis < 20%. TIMI 3 flow was observed in eight patients and TIMI 2 flow in the remaining patient. Eight patients had single vessel disease and one patient had two vessel disease.
Prevalence and extent of no reflow
At the 24 hour MCE, eight patients (33%) had excellent myocardial reflow and 16 patients (66%) had no reflow (fig 1). Reduced or absent opacification at MCE was present in 0.3 (0.5) segments in patients with reflow (3.5 (6.5)% of dysfunctioning segments) and in 4.6 (2.3) segments in patients with no reflow (60.2 (29.4)% of dysfunctioning segments; (p < 0.0001 v reflow). CSI was 1 (0.1) in patients with reflow and 2.6 (0.5) in no reflow (p < 0.0001). The videointensity ratio was 0.8 (0.1) at both 1:4 and 1:8 in patients with reflow, and 0.6 (0.1) at 1:4 and 0.7 (0.2) at 1:8 (NS v 1:4) in patients with no reflow (p < 0.0001 v reflow).

(Left) Example of complete reflow at 24 hour myocardial contrast echocardiography (MCE). (Right) Example of apical and septal perfusion defect (no reflow) at 24 hour MCE.
As table 1 shows, risk factors, clinical presentation, recanalisation timing and modality, and residual stenosis after thrombolysis in patients with reflow and those with no reflow were not statistically different. Peak CK was higher in patients with no reflow.
Clinical characteristics of patients with no reflow and with reflow
Temporal changes of no reflow
At one month MCE, in all patients with reflow the number of myocardial segments having reduced or absent opacification, as well as CSI and videointensity ratio, remained unchanged at 0.3 (0.5), 1 (0.1), and 0.8 (0.1), respectively, at both 1:4 and 1:8 (NS v 24 hour MCE). Conversely, among patients with no reflow at 24 hours, at the one month MCE the phenomenon was spontaneously reversible in nine (56%) and sustained in seven (44%).
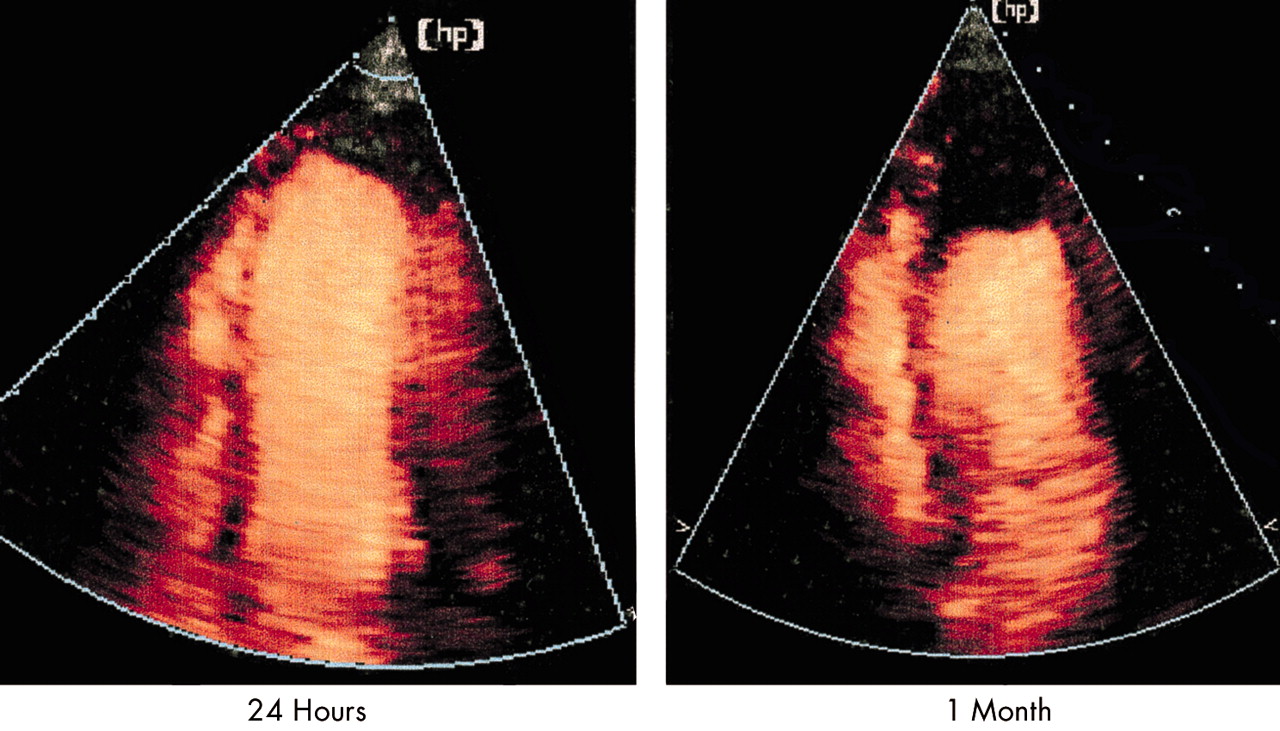
In patients with spontaneously reversible no reflow (fig 2), at one month MCE the number of segments with reduced or absent opacification at both 1:4 and 1:8 decreased from 4.9 (2.3) (70 (30)% of dysfunctioning segments) to 2.2 (2.4) (38 (40)% of dysfunctioning segments; p < 0.01). CSI improved from 2.5 (0.5) to 1.4 (0.6) (p < 0.05) and videointensity ratio increased from 0.6 (0.1) to 0.7 (0.1) at 1:4 (p < 0.05) and from 0.7 (0.2) to 0.8 (0.2) at 1:8 (p < 0.05).

Spontaneously reversible no reflow. (Left) An apical perfusion defect at 24 hour MCE. (Right) Improvement of perfusion in the same patient at one month MCE.
In patients with sustained no reflow (fig 3), the number of segments with reduced or absent opacification at both 1:4 and 1:8 did not change from 24 hours (4.1 (2.3), 47.6 (24.4)% of dysfunctioning segments) to one month MCE (4.4 (2.3), 52.1 (23.8)% of dysfunctioning segments; NS). Similarly, CSI at both 1:4 and 1:8 was 2.6 (0.6) at 24 hours (NS v spontaneously reversible no reflow) and remained 2.6 (0.5) at one month MCE (NS). The videointensity ratio at 24 hour MCE was 0.5 (0.2) at 1:4 and 0.6 (0.1) at 1:8 (NS v 1:4 and v spontaneously reversible no reflow) and remained unchanged at the one month MCE.

Sustained no reflow. (Left) An apical perfusion defect at 24 hour MCE. (Right) Persistence of the defect at one month MCE.
As table 2 shows, risk factors, clinical presentation, recanalisation timing and modality, and residual stenosis after thrombolysis were not different between patients with sustained and those with spontaneously reversible no reflow. The time course of CK release and the ΣST segment index were not different between the three groups of patients (fig 4).
Clinical characteristics of patients with sustained and reversible no reflow

(A) Time course of creatine kinase (CK) concentrations in the three groups. *p < 0.05 v reflow. (B) Time course of the ST index in the three groups.
Temporal changes of LV function and volumes
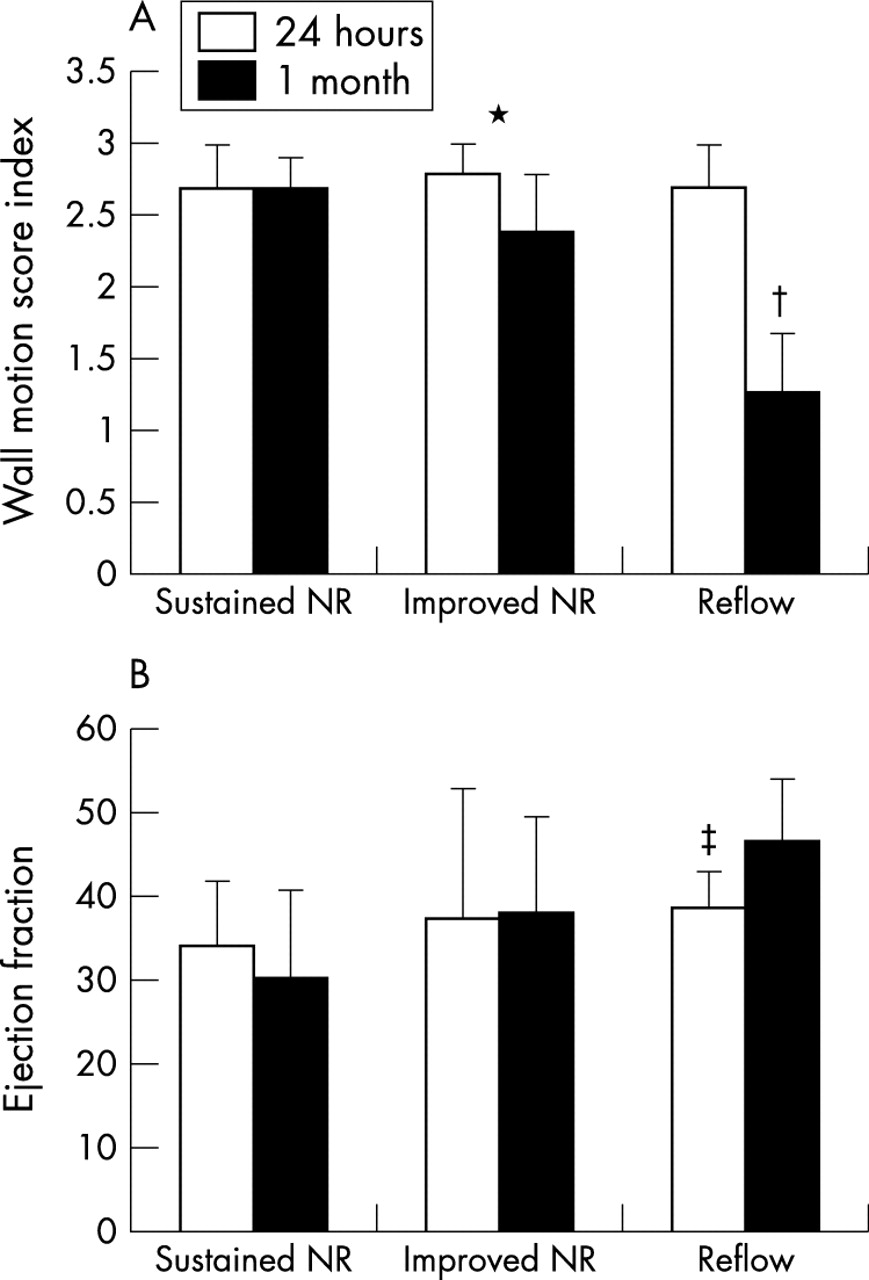
At 24 hour echocardiography, regional and global LV function were similar in patients with reflow, sustained no reflow, and spontaneously reversible no reflow (fig 5). At one month, a significant improvement of WMSI and EF was observed in patients with reflow. WMSI and EF did not change in patients with sustained no reflow, while WMSI improved slightly and EF did not change significantly in patients with spontaneously reversible no reflow (fig 5).

Changes in (A) wall motion score index and (B) ejection fraction between 24 hours and one month follow up in patients with sustained no reflow (NR), reversible NR, and reflow. *p < 0.05; †p < 0.01; ‡p = 0.0005.
At 24 hours, end diastolic and end systolic LV volumes were similar in the three subgroups of patients. However, at one month, while LV volumes did not change in patients with reflow and in those with spontaneously reversible no reflow, in patients with sustained no reflow both end diastolic and end systolic volumes increased significantly (fig 6).

Changes in (A) end diastolic and (B) end systolic volumes between 24 hours and one month follow up in patients with sustained NR, reversible NR, and reflow. *p < 0.01.
In the entire study population, the percentage change in WMSI and LV volumes from 24 hours to one month correlated weakly with 24 hour MCE (r = 0.5, p < 0.05) but more strongly with one month MCE (r = 0.7, p < 0.0001).
DISCUSSION
In this study, the use of non-invasive MCE by intermittent harmonic power Doppler and intravenous Levovist in the serial evaluation of microvascular perfusion patterns after successful coronary recanalisation allowed us to establish that postischaemic no reflow detected 24 hours after thrombolysis or primary PTCA may be spontaneously reversible in a substantial percentage of patients and that it is associated with preserved LV volumes and function. Although the mechanisms of this reversibility have yet to be clarified, this study establishes the rationale for a possible treatment window of no reflow in the subacute phase of myocardial infarction.
Prevalence of no reflow
In this study population, no reflow was identified by MCE in 66% of patients at 24 hours after coronary recanalisation and it persisted in only 29% of patients at one month’s follow up. The prevalence of the no reflow phenomenon found at 24 hours is slightly higher than that reported by Lepper and colleagues,19 who observed the phenomenon in 48% of patients. However, they defined no reflow only patients with a contrast defect in ⩾ 50% of risk area, as opposed to ⩾ 25% of risk area, used in this and in previous studies.6,10 Ito and colleagues10 showed no reflow in 33% of post-PTCA patients; however, they performed MCE 15 minutes after primary PTCA, at a time when coronary hyperaemia is largely present and may lead to underestimation of microvascular damage. In fact, when they re-evaluated MCE at one month, new areas of no reflow occurred in 23% additional patients. Furthermore, they restricted MCE evaluation to the apical long axis view, thus possibly missing areas of no reflow present in other views. Furthermore, the high percentage of no reflow observed in the present study can be explained by the inclusion of patients treated by thrombolysis, in whom the incidence of no reflow is higher (62.5%), although not statistically different from that of post-PTCA patients (37.5%). These data are closely concordant with those reported by Agati and colleagues,20 who found in patients with TIMI 3 flow 72% no reflow after thrombolysis and 31% after PTCA. Lastly, since we were interested in the study of no reflow regardless of the TIMI score of the epicardial vessel, we also included in the study patients with TIMI 2 flow, in whom, as expected, no reflow was present in 90% of cases. This definitely increased the overall percentage of patients with no reflow in our study population.
Sustained and spontaneously reversible patterns of no reflow
In humans, no reflow has been largely studied by MCE with intracoronary contrast administration and it has usually been assessed very early (15 minutes) after coronary reopening.10–12 Improvement and deterioration of microvascular reflow from such very early assessment were observed after 24 hours,12 nine days,11 or one month.10 For the first time, we were able to show that microvascular reflow can improve even after the initial 24 hours in at least some patients and that this improvement correlated with better LV function and volumes. In our study population, adequate microvascular reflow was re-established at 24 hours in 33% of patients and it was maintained after one month in all patients. In 29% of patients, no reflow was identified in the 24 hour MCE and the damage appeared to be sustained at one month. However, in the remaining 38% of patients, the initial no reflow resolved at one month, thus identifying an intermediate subgroup of patients characterised by the reversibility of the no reflow phenomenon. Interestingly, the subgroup of patients with no reflow present at 24 hours and reversal at one month had a favourable LV functional and structural evolution.
Study limitations
In this study, according to the common clinical practice of our institution, the interval between thrombolysis and coronary angiography ranged from 24 hours to five days. However, to minimise possible overestimation of 24 hour no reflow due to the presence of perfusion defects at MCE related to a persistently occluded infarct related artery, coronary angiography was performed with a maximum 12 hour delay after MCE, and the epicardial artery was found patent in all patients, as correctly predicted by clinical signs of reperfusion.
A systematic angiographic one month follow up of these patients was not available; thus, coronary reocclusion of the infarct related artery could have occurred in some patients, possibly limiting the extent of further spontaneous improvement of reflow. However, this possibility, never suspected based on clinical history, would not have affected the major novel finding of the study, as it would only have led to possible underestimation of the prevalence of spontaneously reversible no reflow.
We evaluated microvascular blood volume by semiquantitative and quantitative measurement of MCE at 1:4 and 1:8 triggering intervals. A more precise estimate of microvascular blood flow may be provided by the integration of the slope and plateau of the replenishment curve of contrast. Such data were not collected in this study, since a more appropriate novel ultrasound technology (real time) and second generation microbubbles would have been necessary.21 However, we believe that measurement of microvascular blood volume may be considered an appropriate way to show the presence or absence of no reflow and its temporal changes.
Clinical implications
The results of this study imply that no reflow present 24 hours after coronary recanalisation is not necessarily associated with irreversible coronary microvascular damage, as, in about half of these patients, no reflow was reversed after one month. Although the available data do not provide clues about possible determinants of sustained or spontaneously reversible no reflow, understanding of the mechanisms of reversible and irreversible microvascular impairment may guide novel treatment strategies to resolve no reflow even in the subacute phase of myocardial infarction. Furthermore, because of the dynamic nature of no reflow, and since predicting the functional outcome of these patients is improved at the one month follow up, a non-invasive method such as MCE with intravenous contrast administration appears to be ideal for serial evaluation of microvascular flow.
Acknowledgments
The authors thank the nurses of the coronary care unit and of the cardiology outpatient clinic for their invaluable help during MCE studies. We are grateful to Heinrich Beckerman PhD of Philips Medical Systems for his expert support.
This work has been supported by an equipment grant from Philips Medical Systems. Dr Galiuto has received, for this work, the Young Investigator Award of the European Society of Echocardiography.
This work was presented in part at the 50th Annual Scientific Sessions of the American College of Cardiology, Orlando, Florida, USA, 18–21 March 2001.