Article Text

Abstract
Objective: To evaluate the association between vascular inflammation as measured by subacute C-reactive protein (CRP; 1–10 mg/l) and all-cause mortality and the association between change in CRP status (normal ⩽3 mg/l and elevated >3 mg/l) and all-cause mortality.
Methods: Probabilistic record linkage was used to match hospital episode data, laboratory reports and mortality statistics in a large urban population. Survival was evaluated using Cox proportional hazards regression models.
Results: 22 962 patients had their first CRP measurement in the subacute range (1–10 mg/l). Analysis grouped by each additional unit increase in CRP across the subacute range was associated with a 7.3% (95% CI 5.4% to 9.2%) increase in the hazard ratio (HR) of death over 4 years, after controlling for confounding factors (p<0.001). Repeated CRP observations around 1 year apart were recorded in 5811 subjects. After controlling for confounding factors, in patients whose CRP changed from normal (⩽3 mg/l) to elevated (>3 mg/l), the HR increased 6.7-fold (p<0.001) relative to cases whose CRP remained normal. By comparison, among those subjects whose CRP was reduced from elevated to normal, the hazard ratio halved to 3.5 (p = 0.018). In an underpowered analysis of time to cardiovascular events, an identical pattern of risk emerged.
Conclusions: CRP level predicted all-cause mortality, and additional inclusion of prior change in CRP level and current CRP level more so. Increasing vascular inflammation, as measured by CRP, increases the likelihood of death.
Statistics from Altmetric.com
C-reactive protein (CRP) is a highly conserved, five-subunit protein produced largely in the liver. It is thought to be an acute-phase reactant to tissue damage, infection, inflammation and malignancy.1 The role of CRP in the development of cardiovascular disease has come under considerable scrutiny following epidemiological evidence of an association between elevated CRP and the prevalence of atherosclerotic vascular disease and risk of both first and subsequent cardiovascular events.2 There is little doubt that CRP adds to traditional risk factors in the global assessment of cardiovascular risk, and it may be at least as important as hypertension in prediction of outcome.3 In the USA, doctors are now recommended to measure high-sensitivity CRP in asymptomatic people with an intermediate risk of coronary heart disease to optimise their assessment of cardiovascular risk.4
The hypothesis that CRP is an important marker of atherothrombosis has now become the focus of intense investigation.5 This theory has considerable clinical significance as CRP levels are modifiable. Although there is not yet unanimous agreement over the pro-atherogenic role of CRP2, supporting evidence is emerging.6 There is considerable experimental data linking CRP to endothelial dysfunction, vascular remodelling and key stages of the atherothrombotic process. Exogenous CRP also activates both inflammation and coagulation when administered to healthy volunteers,7 an effect independent of endotoxin or other contaminants.6
Resolution of this hypothesis is of particular interest in the management of autoimmune conditions where chronic elevation of CRP accelerates atherosclerosis8 and, thereby potentially increases mortality. Although CRP has been shown to be a poor predictor of the incidence of rheumatoid arthritis,9 it is central to the evaluation of disease progression and response to therapeutic intervention10–12 and increasingly suspected as a pro-atherogenic agent in affected patients.13–15 Similar associations are evident in psoriasis,16 where the relative risk of myocardial infarction in young patients with severe disease is elevated threefold over disease-free controls after adjustment for relevant baseline cardiovascular risk factors.17
Despite the large body of epidemiological data relating to CRP, few studies have examined the relationship between longitudinal change in CRP and prognosis.18 In this study, we sought to examine the effect of CRP change on both all-cause mortality and cardiovascular morbidity using routine laboratory data collected in hospital practice, following validation of the association between snapshot CRP measurement and all-cause mortality within the available data.
PATIENTS AND METHODS
These data represented hospital inpatient admissions, laboratory investigations, and mortality data for the population resident in the geographical area of Cardiff and the Vale of Glamorgan (UK), a predominantly urban area with a population of about 424 000 people.19 The epidemiology of heart disease and other coronary-related epidemiology and survival have been described in this population using the same methods as those described here.20 21 These data were linked by proprietary software using validated probabilistic matching algorithms on personal identifiers.22 Following recommendation from the Patient Information Advisory Group to the Secretary of State for Health an exemption from the requirement for explicit consent was granted under section 60 of the Health and Social Care Act 2001. Ethical approval was granted by the Bro Taf local research ethics committee.
Hospital episode data
Hospital episode data were obtained from the national NHS hospital episode collating body for Wales. Inpatient data were available for 1 500 876 finished consultant episodes representing 1 326 211 admissions for 477 841 subjects spanning a period of 13 years to February 2005. Clinical diagnoses were recorded using both ICD-9, which predominated until 1995, and was then phased out and replaced with ICD-10.
Mortality data
Mortality data were obtained from the Office of National Statistics for subjects resident in South Glamorgan at the time of death. Over a period of 12 years to March 2005, there were 50 963 deaths among local residents. Cause of death was classified by ICD-9 until 2000, when phased out by ICD-10.
Laboratory data
All laboratory results originated from the Cardiff and Vale NHS Trust Laboratory Service covering a 5-year period to January 2006. Over this time some 43 265 603 tests were reported for 295 631 subjects.
The key biochemical marker in this investigation, serum CRP concentration, was measured at the University of Wales Hospital Department of Laboratory Medicine using a Behring latex-enhanced nephelometer analyser system. As the assay was not of high sensitivity it was decided to categorise the CRP level of subjects according to the scientific statement recently issued by the American Heart Association and Centers for Disease Control and Prevention,23 a method used previously in large epidemiological studies.24 An elevated level of CRP was defined as >3 mg/l while levels >10 mg/l were defined as representing acute inflammatory processes. In total there were 432 272 CRP observations from 98 505 people.
Measurement of serum lipids over the same period was performed by the same department and yielded 315 178 total cholesterol (TC) observations from 87 512 people in addition to 124 721 triglyceride results; 93 215 low-density lipoprotein (LDL) observations; 50 284 high-density lipoprotein (HDL) observations; and 79 538 reported TC/HDL ratio observations.
Case selection
Patients regarded as having a subacute 1st CRP observation were selected if their first CRP measurement was in the range 1–10 mg/l. Cases where CRP change was recorded were included if at least two observations had been recorded about 1 year apart. Given high intraindividual variability for CRP,25 26 the baseline (2nd observation) CRP level was calculated as the average of all observations within 90 days of the first CRP observation. Similarly, the baseline CRP level was defined as the mean of values occurring within a further 90 days of the second (1 year) observation. CRP change was then defined for the period as normal→normal (NN), normal→elevated (NE), elevated→normal (EN), and elevated→elevated (EE).
Disease ascertainment
Acute ischaemic events were defined as any admission or cause of death which included the diagnostic codes for angina pectoris (ICD-10, I20*; ICD-9, 413), acute myocardial infarction (I21*, 410), subsequent myocardial infarction (I22*), other acute ischaemic heart disease (I24*, 411), cerebral infarction (I63*, 434) and stroke (I64*, V171). A prior diagnosis of cancer was defined as any admission before the first CRP measurement that included a diagnostic code for malignant neoplasm (ICD-10, C00*–C97*). Although ICD-9 codes were not examined, those patients whose last such admission was before 1996 were assumed to have been cured of their cancer. Prior vascular diagnosis was defined as any admission before the first CRP measurement that included a diagnostic code for any disease of the circulatory system (ICD-10, I00*–I99*). Prior diabetes diagnosis was defined as any admission before the first CRP measurement that included a diagnostic code for diabetes mellitus (ICD-10, E10*–E14*).
Statistical methods
Survival was evaluated using Cox proportional hazards regression model (CPHM), using SPSS version 14 (SPSS Inc, Chicago, USA). Independent covariates of both survival and time to first acute ischaemic event were determined within the models following the appropriate CRP observation. Patients who were admitted with a diagnosis of an acute ischaemic event during the CRP observation period were excluded from the analysis. Time to event was measured from the date of the last reported CRP observation. Post hoc power analysis (StudySize version 2.0.1, CreoStat) for mortality indicated that CRP-change category membership would detect a minimum hazard ratio (HR) in the range 1.71–1.34 (normal–normal and elevated–elevated, respectively) with a 95% probability and 90% power. Under the same statistical conditions, CRP-change categories were able to detect HRs for acute ischaemic events in the range 2.97–1.83 (normal–normal and elevated–elevated, respectively).
RESULTS
Subacute first CRP measurement
Among all patients with at least one CRP measurement, 22 962 had a subacute value at their first observation. Their mean age was 55 years and 46% were male. Within this cohort there were 479 deaths (2.1%) of any cause within a follow-up period of 4 years. CPHM showed each unit increase in CRP within the subacute range resulted in a 7.3% increase in the HR (95% CI 5.4% to 9.2%) after controlling for age, gender, prior cancer, prior diabetes and pre-existing vascular disease (table 1). Graphical interpolation of this relationship (fig 1) shows the mean increased relative risk of death in patients with a CRP of 10 mg/l to be nearly double that of patients with the lowest CRP measurement (1 mg/l).

CRP change
Repeated CRP observations at 1 year were available for 5811 subjects. Among these, the majority (59%) had a first quarter average CRP in the acute range (>10 mg/l), 26% had an elevated but subacute CRP level (4–10 mg/l), while the remainder (14%) had a normal CRP level (⩽3 mg/l). Subjects with acute CRP were significantly older than patients with either elevated or normal CRP (63.1 years vs 59.9 years and 56.2 years, respectively; p<0.001) and had increased prevalence of diabetes (11.6% vs 8.8% and 8.9%, respectively; p = 0.010; table 2). Prevalence of prior vascular disease showed a highly significant linear increase across the categories (normal, 29.1%; elevated 34.4%; and acute, 40.6%; p<0.001) as did the prevalence of prior cancer (normal, 6.3%; elevated 7.2%; and acute, 9.9%; p<0.001). Neither mean total cholesterol nor mean LDL cholesterol showed any significant difference between CRP categories (p = 0.186 and p = 0.291, respectively). The likelihood of death within 3 years of the CRP observation period also showed a significant increase across the CRP categories (p<0.001), almost doubling between normal and acute cases (normal, 9.1%; elevated, 12.1%; acute, 20.0%). A similar linear association, however, was not seen in the incidence of acute ischaemic events after the CRP observation period (p = 0.339), although the likelihood among elevated cases was approximately twice that of normal cases (3.3% vs 1.7%; p = 0.001).
Among this initial cohort, 510 cases experienced an acute ischaemic event during the CRP observation period and were excluded. Of the remainder (5301), the majority of these cases (73.2%) had consistently elevated CRP (>3 mg/l (EE)); 12.0% showed a reduction from elevated to normal (EN); 8.5% had an increased CRP status (NE); and the remaining 6.3% had stable normal CRP levels (NN; table 3). The mean age of EE cases was greater than that of all other categories (61.6 years vs 57.2 years (NE), 54.8 years (EN) and 52.5 years (NN; p<0.001). Gender balance was similar between CRP-change categories (p<0.397). Prior vascular disease was more prevalent in EE cases (p<0.001), as was prior cancer (p<0.001); however, there was no difference in the prevalence of diabetes at the conventional level of significance (p = 0.097). The likelihood of death over 3 years was greater in those with elevated endpoint CRP status (17.7% in EE and 14.3% in NE vs 5.9% in EN and 1.7% in NN; p<0.001). Similarly, for the likelihood of an acute ischaemic event (3.5% in EE and 2.7% in NE vs 1.4% in EN and 0.6% in NN; p = 0.001). Neither mean total cholesterol nor mean LDL cholesterol showed any notable difference between CRP-change categories (p = 0.636 and p = 0.520, respectively).
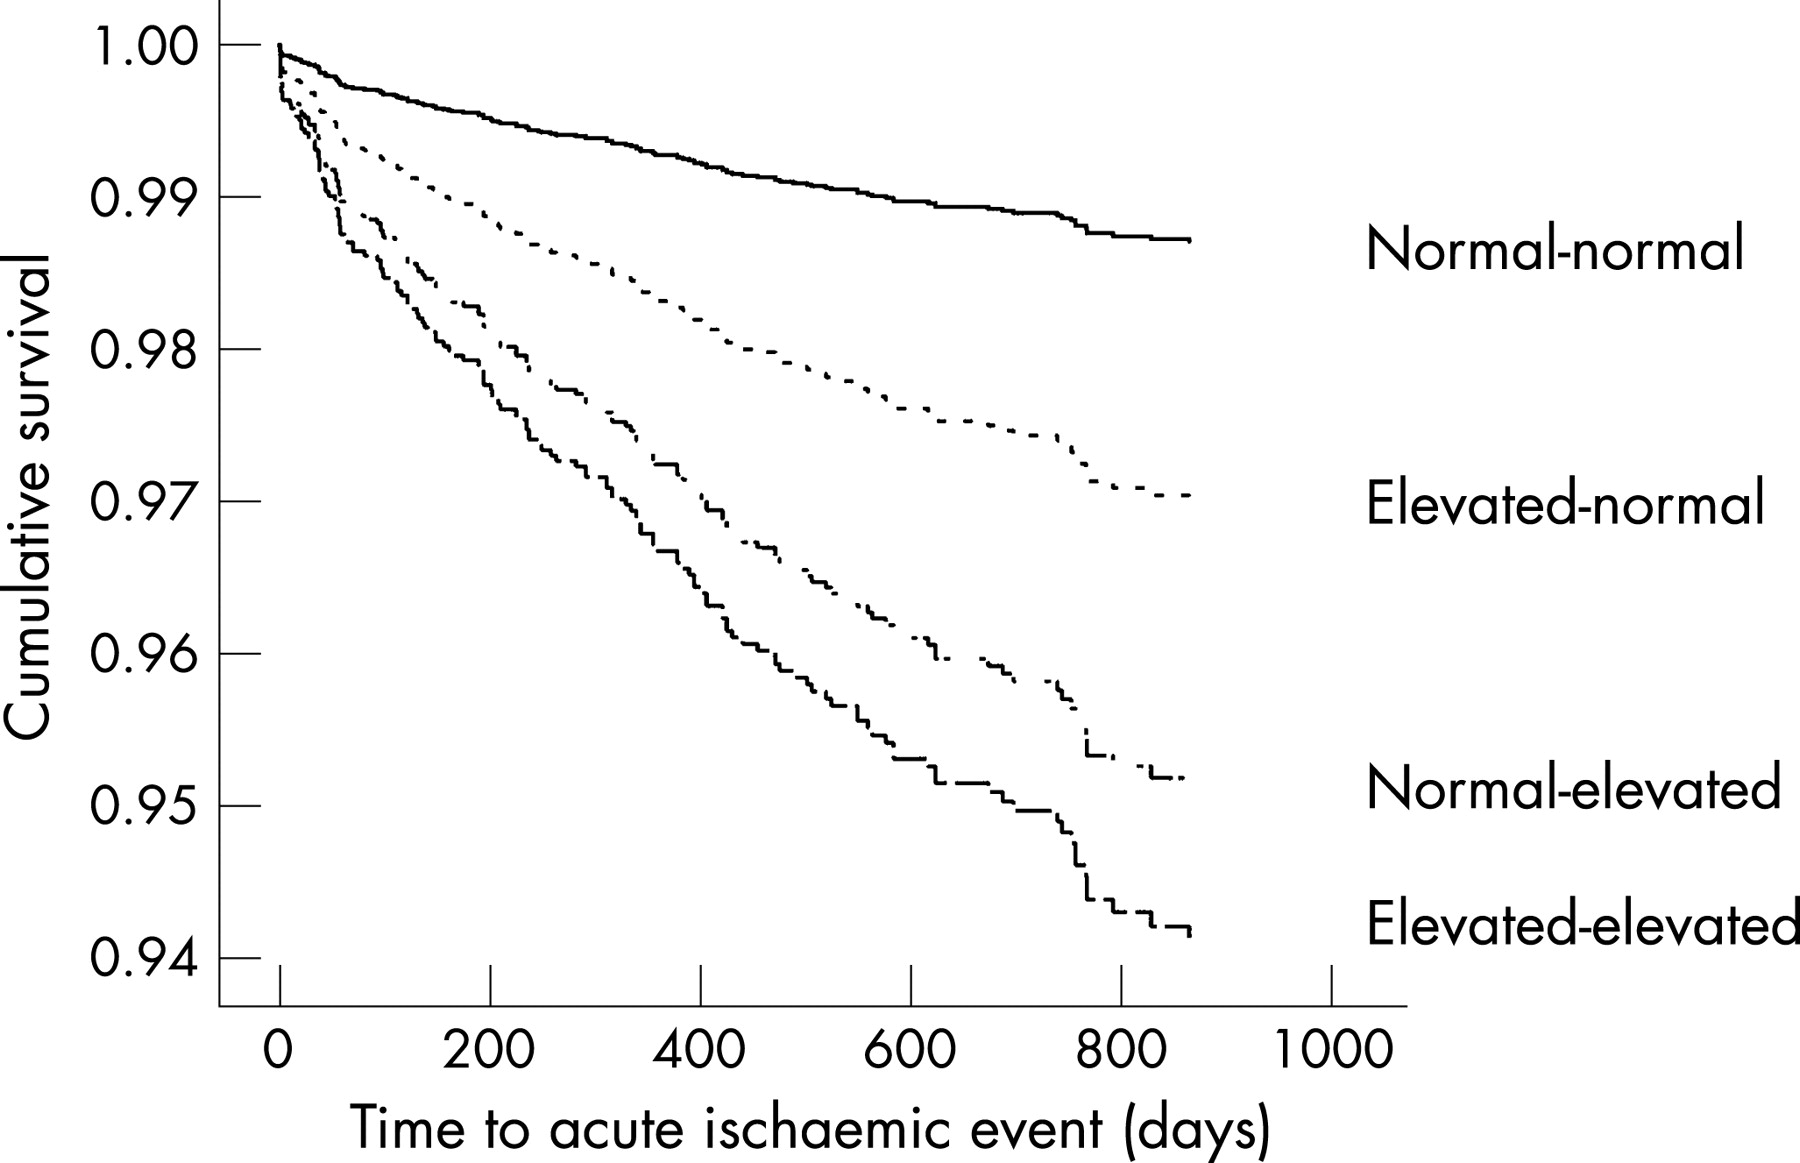
In a CPHM model of all-cause mortality controlling for age, gender and significant prior diagnoses, the likelihood of death was markedly different between CRP change category (table 4, fig 2). Compared to stable NN cases, the risk of death among increasers (NE) and elevated (EE) cases increased approximately sevenfold (p<0.001), and was twice that of the “decreasers” (EN). Using a similar approach to model time to acute ischaemic events, although not statistically significant, a similar pattern of association emerged (table 5, fig 3).

DISCUSSION
This study confirmed that increasing levels of subacute CRP were associated with increased risk of 4-year mortality. Other investigators have failed to find an association in the subacute range.27 Further, the likelihood of death over 3 years was markedly greater in those whose serum CRP had increased from normal to elevated levels than those whose CRP decreased over a 1-year observation period. The magnitude of the HRs compared with other binary covariates suggested that CRP change was an important marker of mortality in addition to recent CRP status. An identical trend emerged in the longitudinal analysis of acute ischaemic events, limited in this study, most likely, by a lack of statistical power for this specific outcome.
The usefulness of these data was limited by the lack of other vascular risk factors such as blood pressure measurements and obesity. Neither was routinely available from current data collated in secondary care. The limited availability of lipid profiles concomitant to the endpoint CRP observations (TC for 1118 cases and LDL cholesterol for only 241 cases) prevented their meaningful inclusion in these survival analyses. The highly sensitive CRP assay currently now in widespread use enables more accurate detection of lower CRP levels but was not available here for sufficient numbers of patients to allow meaningful analysis of this measure; this did not affect the capacity of these data to investigate the principal research question.28 The analysis of cardiovascular event prognosis was undoubtedly limited by statistical power; post hoc power analysis of the available cohort showed a detectable HR outside the relative risks for CRP point estimates.29 30 Finally, it must be emphasised that this was not a random sample of subjects, but a cohort of patients who had been selected deliberately because a doctor, or another health professional, had requested a CRP measurement. There is a possibility that this selection bias may invalidate the conclusions within this study. However, it was felt that because of the large number of observations and subjects, and because of the strength of the association elicited with respect to mortality, that these observations are likely to be valid.
Despite the availability of CRP point estimates for nearly 100 000 people, annual follow-up measurements were available for only 5% of these cases. There may be a case for routine measurement of CRP at intervals, particularly in those with an increased cardiovascular risk status as determined by traditional algorithms and clinical observation. A study of interval measurement of CRP in general practice would form a useful line of further research.
Despite their limitations, these findings do illustrate the striking association between CRP change observed over 1 year and subsequent 4-year all-cause mortality. Among those in whom CRP reduces from an elevated to normal status, the risk of death is halved compared with those whose CRP becomes (or remains) elevated over the observation period. In the context of the weight of evidence supporting the role of CRP as promoter of disease not simply a marker, these findings will be of interest to clinicians in assessing disease prognosis and therapeutic strategies which reduce CRP.
REFERENCES
Footnotes
Funding: The record-linkage project was originally funded by Diabetes UK. This analysis presented herein was funded by Wyeth Europa Ltd.
Ethics approval: Ethical approval was granted by the Bro Taf local research ethics committee.