Article Text

Abstract
Objective: Left ventricular hypertrophy (LVH) confers high cardiovascular risk. Regression of LVH reduces risk. Patients with blood pressure in the normal range and LVH are common. We investigated whether further reduction in blood pressure would further regress LVH.
Methods: 51 subjects with blood pressure in the normal range and echocardiographic left ventricular hypertrophy were randomly assigned to active treatment (antihypertensive medication) or placebo in a ratio of 2:1. The aim was to maintain office systolic blood pressure at 10 mm Hg less than baseline in the active arm and at baseline level in the placebo arm. Cardiac magnetic resonance imaging was used to measure change in left ventricular mass index over 12 months.
Results: 35 subjects completed the study (active 23: placebo 12). Average mean baseline office systolic blood pressure was 122 (SD 9) mm Hg in the active group and 124 (9) mm Hg in the placebo group (p = 0.646). The mean baseline left ventricular mass index was 65.88 (11.87) g/m2 in the active group and 59.16 (11.13) g/m2 in the placebo group (p = 0.114). The mean difference between baseline and end of study office systolic blood pressure was −9.33 (8.56) mm Hg in the active group and −0.08 (9.27) mm Hg in the placebo group (p = 0.007). The mean change in left ventricular mass index was −4.68 (7.31) g/m2 in the active group and +1.97 (6.68) g/m2 in the placebo group (p = 0.014).
Conclusions: Reduction in office systolic blood pressure, already in the normal range, of approximately 9 mm Hg, leads to a reduction in left ventricular mass. Further work is required to see if this also leads to a reduction in cardiovascular events.
Trial registration number: ISRCTN48331653.
Statistics from Altmetric.com
It is known from Framingham and from meta-analysis that left ventricular hypertrophy (LVH) confers high risk, irrespective of blood pressure (BP); with an independent risk ratio of 2.5.1 2 Indeed, after age, LVH is said to be the strongest independent predictor of cardiovascular (CV) events, CV deaths and total mortality.3 In a study by Liao et al in black adults in 1995, LVH was found to be a stronger risk factor, and accounted for more deaths than did multivessel coronary artery disease.4 Furthermore, LVH is remarkably common: using the new LVH criteria of the American Society of Echocardiography, the prevalence of LVH approaches 70% in patients with stable angina, with similar figures for those with diabetes.5 6
The standard approach to the management of LVH, controlling BP and using a drug that withdraws angiotensin II, is only partially effective and LVH persists in 20% of hypertensives who attain target BP.7 It is now realised that BP contributes only 25% to the variability in LV mass seen in a population.8 LVH associated with blood pressure in the normal range confers the same CV risk as that associated with hypertension.9 Nevertheless, regressing LVH irrespective of BP changes is known to be an effective way to reduce risk.10
Additional methods of regressing LVH are therefore needed. One possibility may be to achieve an even lower BP than the conventional target BP for LVH patients. A major driver for this idea of achieving lower than conventional targets comes from the Heart Protection Study where reducing cholesterol even from a “normal” baseline level produced huge benefit in high risk individuals.11
The aim of this study was to establish if reducing office systolic BP (SBP) by a further 10 mm Hg leads to regression of LVH in individuals with echocardiographic LVH but a BP already in the normal range.
Methods
The study protocol was reviewed and approved by the Tayside Committee on Medical Research Ethics and the Tayside Research and Development Consortium. It was conducted at Ninewells Hospital, Dundee, UK.
Fifty-one volunteers with either a high risk of developing, or already established, CV disease were recruited between May 2005 and August 2006. All subjects gave their informed consent. All had LVH as defined using the following standard transthoracic echocardiographic (TTE) methods. (Philips iE33, The Netherlands) Linear M-mode left ventricular wall and cavity measurements taken according to the American Society of Echocardiography convention (that is, leading edge to leading edge)12 in end-diastole. Left ventricular mass (LVM) was then calculated using the following equation:
LVM = 0.8× (1.04((LVIDd + LVPWd + IVSd)3 − (LVIDd)3)) + 0.6 g
where LVIDd is the dimension of the left ventricle at end-diastole, LVPWd is the thickness of the left ventricular posterior wall at end-diastole and IVSd is the thickness if the interventricular septum at end-diastole.
LVM index (LVMI) in g/m2 and g/ht2.7 was then calculated. LVH was defined as LVMI >110 g/m2 in females if the body mass index (BMI) was <27.3 kg/m2 and >134 g/m2 in males if the BMI was <27.8 kg/m2. For BMI measurements at or above these levels LVH was defined as LVMI >46.6 g/ht2.7 in females and >49.1 g/ht2.7 in males. Work based on the LIFE study has confirmed that LVM indexed to height2.7 has a higher sensitivity than LVM indexed to body surface area in individuals with high BMIs.13 14
All subjects had had normal office BP for at least one year before entering the study; as most LVH regression occurs within one year of stable normal blood pressure.15 At every visit BP was measured three times in a relaxed left arm, with a 2-minute interval between each measurement. A standard or large adult-sized cuff, as appropriate, and an Omron 705 IT sphygmomanometer (Kyoto, Japan) were used on every occasion by one experienced cardiologist (HJS). Subjects were seated. The first measurement was taken after at least 5 minutes of rest and patients were encouraged to relax and to not talk while measurements were being obtained. An average of the final two recordings was taken to be that visit’s blood pressure recording.
The definition of normal BP was an SBP of <130 mm Hg in those with diabetes, renal impairment or established cardiovascular disease, and <140 mm Hg for remaining subjects, by the 2004 British Hypertension Society Guidelines and the December 2005 Joint British Societies’ Guidelines on the Prevention of Cardiovascular Disease in Clinical Practice.16 17
Additional entry criteria for all subjects were
At least 12 months’ treatment with either an angiotensin-converting enzyme inhibitor (ACE I) or an angiotensin-receptor blocker (ARB); or a contraindication to both
Creatinine ⩽140 mmol/l and no proteinuria. At commencement of our study, this was the routine measure of renal function in our hospital
Absence of type 1 diabetes mellitus
Absence of any contraindication to magnetic resonance imaging
Left ventricular ejection fraction above 55%.
Subjects were randomised (www.randomization.com) to active treatment or placebo in a ratio of 2:1. The subjects were blind as to which treatment arm they were randomised into.
All had baseline blood samples taken for renal and liver function, full blood count, glucose, HbA1C, lipids, amino terminal type III procollagen peptide (P3NP), brain-natriuretic petptide (BNP) and C-reactive protein (CRP). Urine was analysed for microalbuminuria and creatinine. All subjects received placebo (Ainsworths, UK) as part of a 4-week run-in period following which they all had a cardiac magnetic resonance scan (CMR) to establish their baseline LVMI by CMR.
CMR was performed using a 1.5 Tesla Magnetom Avanto MRI scanner (Siemens, Erlangen, Germany). Following localiser acquisitions, and two-chamber and four-chamber cine gradient echo sequences, short-axis plane images of the left ventricle were acquired from the atrio-ventricular ring to the apex using a combination of body matrix and spine matrix RF coils and a 2D breath-hold segmented TrueFisp CINE sequence with prospective cardiac gating. The imaging parameters were TR 39.06 ms, TE 1.2 ms and flip angle 60°. One or two slices per breath-hold were acquired (dependent upon the ability of the volunteer to sustain breath-holding at end expiration) and the scan time for each acquisition was minimised by use of a parallel imaging acceleration factor of two. A series of 6-mm thick images (with 1.5-mm slice gap) covering the entire left ventricle was acquired for each subject with an in-plane pixel matrix of 128×192 over an optimal (patient-size-dependent) field of view ranging from 340–450 mm.
Image analysis to establish LVM and hence LVMI was performed using Argus software (version VA60C) on a Leonardo Workstation. Endocardial and epicardial borders were defined independently on all images corresponding to end-diastole (ED) and end-systole (ES) by an MRI physicist segmenter (blind as to the subjects’ treatment arm allocation), with assistance from a consultant radiologist as required. Segmentation rules relating to the appropriate identification of ED and ES phases, along with inclusion or exclusion of appropriate basal slices and papillary muscles were standardised before the analysis task in order to ensure as much consistency as possible. A single segmenter was responsible for undertaking the work, since the use of multiple segmenters is known to lead to greater inter-observer variability.18 The segmentation process was performed twice for every patient in order to derive a mean value for LVM and consequently improve the precision of the measurement. Our coefficient of reproducibility for LV mass is 7.3%.18
Following the placebo run-in period patients were given either active medication or continued with placebo.
The aim in the active treatment arm was to maintain the systolic BP at 10 mm Hg below their individual baseline SBP. The aim in the placebo arm was to maintain SBP at their individual baseline level. Baseline SBP was designated the lower of the initial visit or post placebo run-in visit BP recordings.
The protocol for treatment in the active arm was dictated by what treatment the patient was already taking, bearing in mind that all patients were already on an ACE I or an ARB for at least 12 months (unless contraindicated). The protocol below was followed in a stepwise fashion. If a patient was already on a therapy suggested in the list below then the therapy in the next step was used instead.
Step 1: bendrofluazide (2.5–10 mg) (Goldshield, Croydon, UK)
Step 2: amlodipine (5–10 mg) (Pfizer, Walton Oaks, UK)
Step 3: atenolol (50–100 mg) (Astra Zeneca, London, UK)
Step 4: doxazosin XL (4 mg) (Pfizer, Walton Oaks, UK)
Step 5: spironolactone (25–100 mg) (APS, Cleckheaton, UK).
The study was single blinded with regard to the doctor administering the study. The CMR scans were not analysed by this doctor.
Each patient was seen every 2 weeks initially until their target SBP had been achieved, following which they were seen every 4 weeks for the reminder of the 12 months. Achieving target SBP for those in the active group was defined as their office SBP being at or below target level for two consecutive visits. The patients in the placebo arm were seen every 2 weeks for a total of four visits before being seen every 4 weeks. Blood was taken every 4 weeks for checks on renal function and additional testing of full blood count and liver function was made every 12 weeks.
At the end of the 12 months every recruit still taking part had repeat blood and urine testing for markers of cardiovascular risk as at the beginning of the study and a repeat CMR to establish their LVMI at the end of the study. The follow-up CMR examination was fully standardised for each specific recruit relative to the original baseline examination—that is, identical MRI sequence details and parameters (standardised field of view, voxel resolution, etc) were prescribed. Image analysis methods were also identical to those used at baseline, with the same MRI physicist performing all segmentations.
Schmeider’s meta-analysis in 1998 indicates that a decrease of approximately 9 mm Hg would lead to a 4.5% reduction in LVMI, which is equivalent to an absolute mass change of 10 g.19 Assuming an inter-study reproducibility of 3.5–3.6%, as quoted by Myerson et al and Grothes et al, respectively, then a total of 26–30 subjects are required in a two-parallel group study to detect a 10-g change in LVM with 90% power at p<0.05.20 21 This was confirmed by our own statisticians, and we therefore aimed to recruit at least 30 subjects.
Paired and unpaired t tests, the χ2 test and Fisher’s exact test and Pearson’s correlation coefficient were used as appropriate. For all statistics, values of p<0.05 were considered statistically significant. Standard deviation (SD) is quoted as the measure of variance. All statistics were performed using SPSS version 14.
Results
Fifty-one subjects were recruited, 35 were randomised to the active treatment arm. The baseline characteristics of the 51 subjects showed no statistical difference between the active and placebo groups. Sixteen subjects withdrew from the study. Table 1 shows their reasons for withdrawal. Of the six dropouts for dizziness, no particular factors or any particular drug regimen provided an explanation for their dizziness, except that a history of cerebrovascular disease was present in four of the dropouts compared with six of the non-dropouts.
Reasons given for withdrawal from the study
Therefore a total of 35 subjects completed the study, and from this point the term “active group” refers to those 23 in the active group who completed the study, and similarly for the term “placebo group”. Obviously only the data for the 35 who completed the study enabled longitudinal comparison of BP and LVMI. All data were analysed by “intention-to-treat”.
The baseline characteristics of those who completed the study are shown in table 2. All recruits were white.
Baseline characteristics of subjects who completed the study
The end of study office SBP was defined as the average of all office SBP recordings taken from week 40 onwards. The average office SBP at the end of the study was 112.8 (11.19) mm Hg in the active group and 121.4 (10.92) mm Hg in the placebo group (p = 0.040). The mean difference between baseline SBP and end of study SBP was −9.3 (8.56) mm Hg in the active group and −0.1 (9.27) mm Hg in the placebo group (p = 0.007) (fig 1). The mean difference between baseline diastolic BP and end of study diastolic BP was −6.1 (4.4) mm Hg in the active group and −0.2 (6.4) mm Hg in the placebo group (p = 0.017). This translates into a mean BP difference of −7.2 versus −0.1 mm Hg between active and placebo. The BP reduction in the active group was achieved with an average of three additional antihypertensive medications (range 1–7).
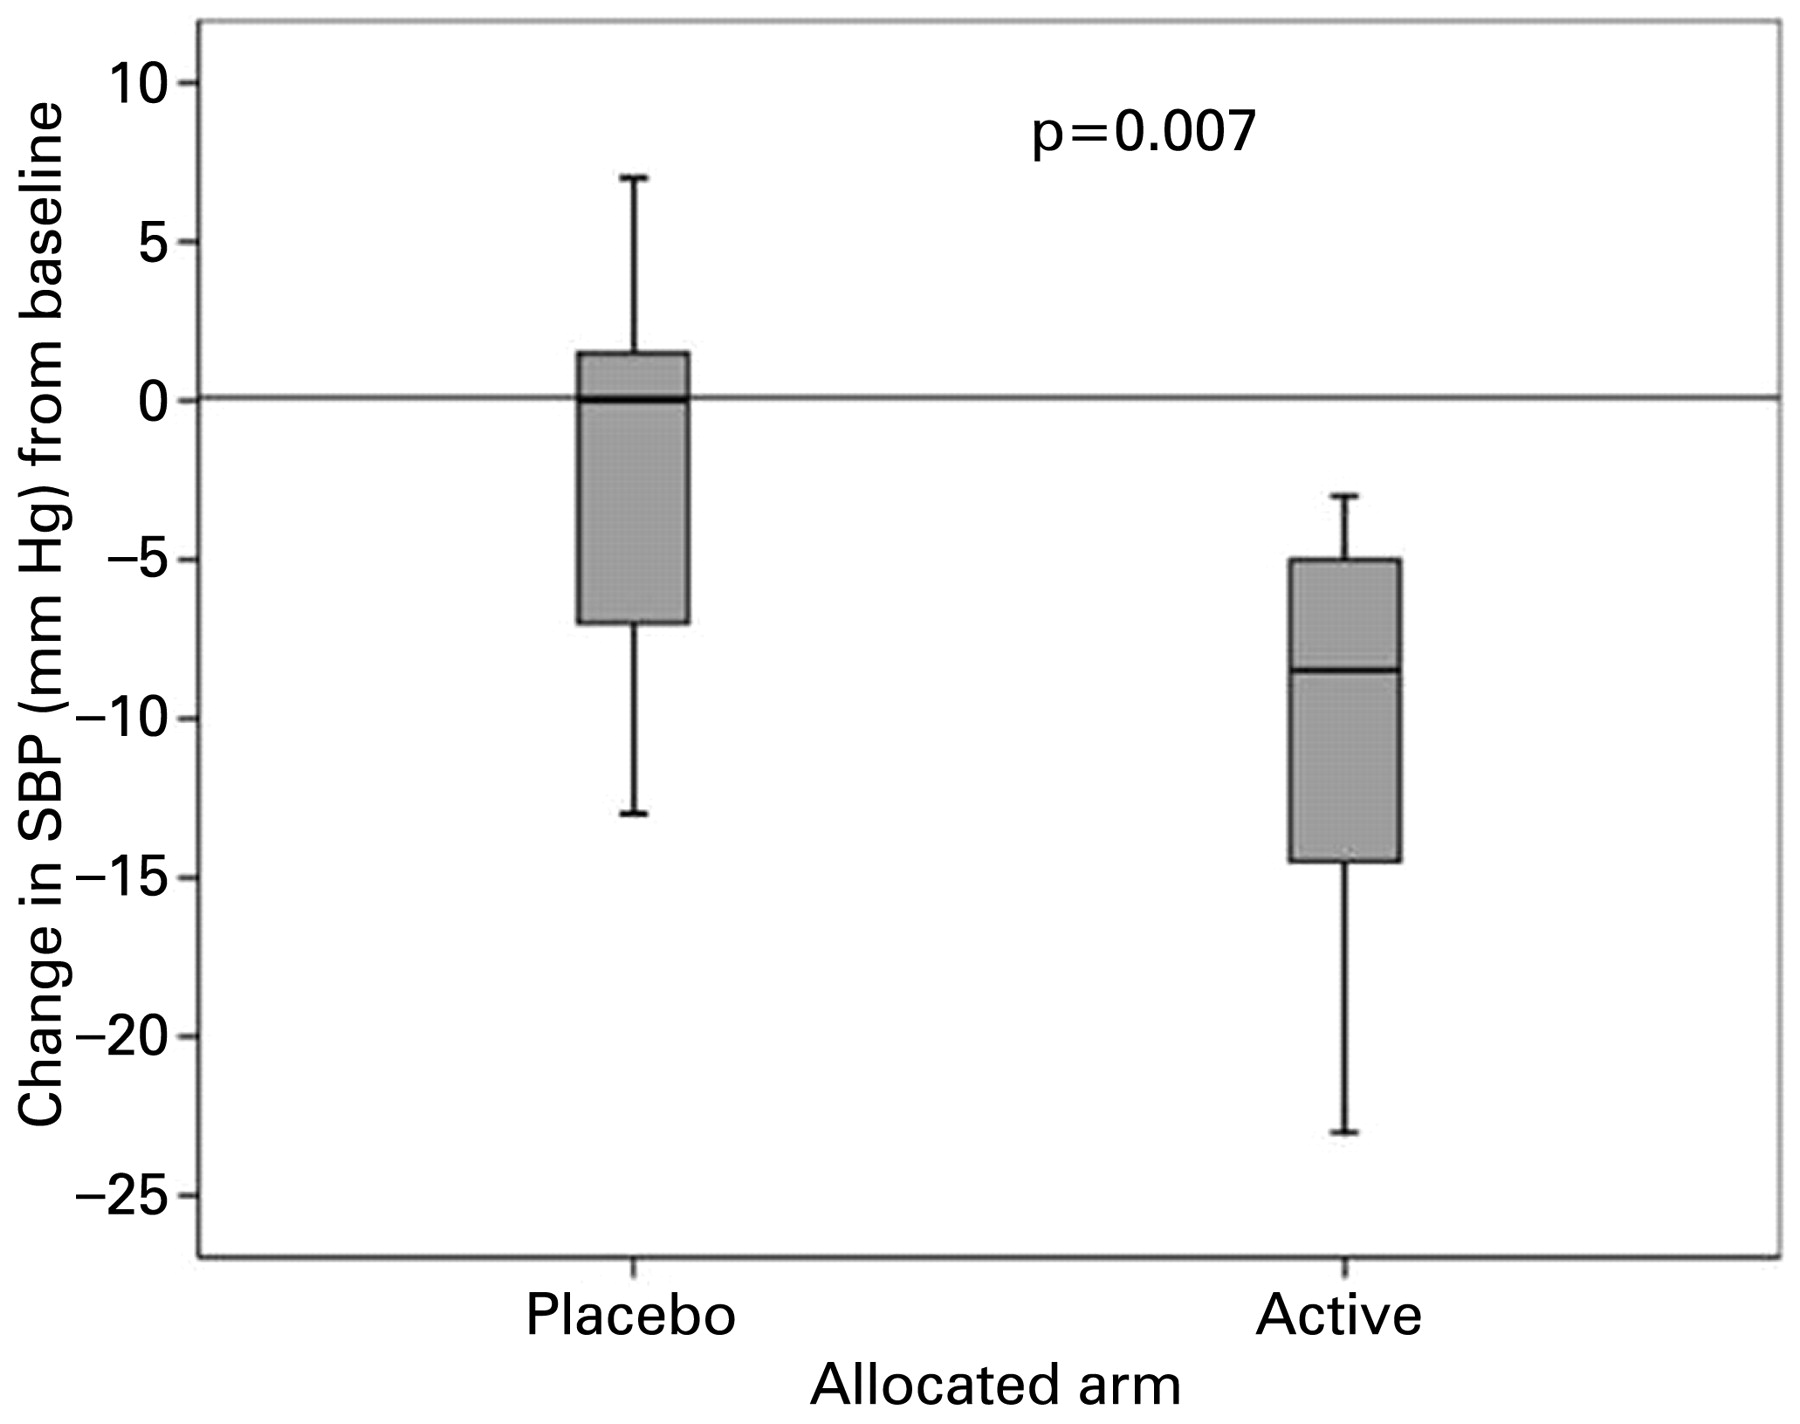
Mean change in office systolic blood pressure (SBP) (mm Hg). The mean difference between baseline SBP and end of study SBP was −9.3 (8.56) mm Hg in the active group and −0.1 (9.27) mm Hg in the placebo group (p = 0.007).
The baseline CMR LVMI in the active group was 65.88 (11.87) g/m2 and 59.16 (11.13) g/m2 in the placebo group (p = 0.114). The mean change in CMR LVMI was −4.68 (7.31) g/m2 in the active group and +1.97 (6.68) g/m2 in the placebo group (p = 0.014) (fig 2). Pearson’s correlation coefficient (r) for change in BP and change in CMR LVMI is 0.26 (p = 0.079). However, the study was not powered to prove a significant correlation between these two parameters, as each parameter will only ever change to a relatively small extent (<10%).

Mean change in cardiac magnetic resonance left ventricular mass index (CMR LVMI) (g/m2). The mean change in CMR LVMI was −4.68 (7.31) g/m2 in the active group and +1.97 (6.68) g/m2 in the placebo group (p = 0.014).
CMR-derived LV ejection fraction (LVEF) was similar in each group both at baseline and the end of the study. LVEF at baseline was 66% in the placebo group and 70% in the active group (p = 0.28), and 67% and 70%, respectively, at the end of the study (p = 0.330).
There was no difference in PIIINP, BNP, CRP or renal function either longitudinally within each group or between groups.
Discussion
Our finding is that reduction of already below-target office systolic blood pressure, by 9 mm Hg produces a significantly lower left ventricular mass index, as measured by CMR, in those with left ventricular hypertrophy. Regression of LVM by this method has never before been studied in this group of patients. As BP only contributes 25% of the variability in LV mass in a population and the BP/LVM relation becomes flatter at non-hypertensive blood pressure recordings, this result was not a foregone conclusion.8
The study was designed to investigate the effect on LV mass of an individually designed lower office SBP target—that is, 10 mm Hg below their baseline systolic BP, and did not directly address whether we ought to set the same lower BP target (for example, 120 mm Hg) for all with LVH. We did not do this because in preliminary work we found that baseline BP was scattered over a very wide range and often below 120 mm Hg anyway in those with normal BP and LVH.
For some time there was a concern about the J-shaped curve. Recently the British Hypertension Society said most evidence points to a “lower the better” BP policy.16 The most direct data on this subject was from the HOT study, in which a 4 mm Hg reduction in BP was achieved.22 However, there was neither clear benefit nor clear harm attributable to a lower BP in the HOT study except in the subgroup of diabetic patients where the lower BP target reduced major cardiovascular events by 51%. Since diabetes is associated with a higher prevalence of LVH, it could be speculated that the benefit of extra BP reduction seen in diabetes might, in part, be due to regression of LVH.6
The key question is whether this LV mass reduction will also produce a reduction in cardiovascular events. There are several publications which suggest that LVH regression per se does produce a reduction in cardiovascular events, irrespective of BP changes. However, these studies were all performed in individuals with higher BPs at baseline.10 23 24 25 26 27 A large randomised clinical trial is now necessary to investigate whether the same is true in LVH patients with BP already in the normal range. Our finding provides some of the necessary data to underpin the need for such a large trial.
Although the baseline SBPs and echo LVMIs were very similar, there was a small imbalance between the baseline CMR LVMIs. Although this is unfortunate, the difference between baseline CMR LVMIs was not statistically significant (p = 0.114), and statistical confidence in a true treatment effect (p = 0.014) was roughly 10 times greater. In addition, regression to the mean is unlikely here as, in the placebo group, both absolute SBP and CMR LVMI changed very little over the course of the study.
It should be noted that the TTE-derived baseline mean LVMI is higher, in both groups, than the CMR-derived LVMI. Data on this common finding have been published previously, and are the result of the different methods by which LVM is estimated.28 The TTE method described earlier makes large geometric assumptions and is based on two-dimensional data, whereas the CMR method makes fewer geometric assumptions and is calculated from three-dimensional data.29 This difference persists even with other TTE-based methods of LVMI estimation such as the truncated ellipse and area-length methods.30 However, this was a proof of principle study designed to establish if lowering an already below-target office SBP would lead to an intraindividual reduction in LVMI and, therefore, it can be argued that the baseline absolute CMR LVMI is not crucial, especially since LVM is a continuous risk factor rather than one that only occurs above an arbitrary threshold value. Far fewer recruits are needed to achieve sufficient statistical power using CMR LVMI than TTE LVMI, therefore CMR is now the gold standard used in trials designed to detect changes in LVMI. However, we chose to use TTE-derived LVMI as our definition of LVH for recruitment purposes for two good reasons. First, it is the most commonly used method of defining LVH in routine clinical practice. Second, TTE-derived LVMI has been used in all large epidemiological studies (for example, Framingham) to identify those at high cardiovascular risk.1
One limitation of our study is the small numbers. Despite that, our primary endpoint (LV mass) had a p value of 0.014, meaning that there was only a 1.4% chance that our results could have occurred by pure chance. This is well below (72% below) the conventional significance level of p = 0.05, which means that there is a 5% chance that any given result occurred purely by chance. Another factor bolstering the credibility of our results is that the direction of our results is what would be expected from first principles—that is, a lower BP would be expected to regress LV mass, which makes our results not only biologically plausible but biologically expected. This, along with only a 1.4% chance that our results arose purely by chance, helps reassure us that our main result is genuine despite the small numbers.
In conclusion, we have shown that BP reduction (−9 mm Hg) of an already below-target BP can indeed lead to reduction in LVMI in patients with LVH. We acknowledge our cohort, although adequately powered, is small and further larger studies are required to confirm our findings. If confirmed, a large randomised control trial is needed to see if this strategy really does reduce cardiovascular events in this particular high-risk group of patients. Additionally, the study suggests that general BP targets may not be ideal for high-risk individuals already with target organ damage, since an individualised lower BP target here was able to regress target organ damage (LVH).
REFERENCES
Footnotes
Funding Chief Scientist Office, Scotland.
Competing interests None.
The authors had full access to the data and take responsibility for their integrity. All authors have read and agree to the manuscript as written.
Provenance and Peer review Not commissioned; externally peer reviewed.