Article Text

Abstract
Clinical prediction models are increasingly used to complement clinical reasoning and decision-making in modern medicine, in general, and in the cardiovascular domain, in particular. To these ends, developed models first and foremost need to provide accurate and (internally and externally) validated estimates of probabilities of specific health conditions or outcomes in the targeted individuals. Subsequently, the adoption of such models by professionals must guide their decision-making, and improve patient outcomes and the cost-effectiveness of care. In the first paper of this series of two companion papers, issues relating to prediction model development, their internal validation, and estimating the added value of a new (bio)marker to existing predictors were discussed. In this second paper, an overview is provided of the consecutive steps for the assessment of the model's predictive performance in new individuals (external validation studies), how to adjust or update existing models to local circumstances or with new predictors, and how to investigate the impact of the uptake of prediction models on clinical decision-making and patient outcomes (impact studies). Each step is illustrated with empirical examples from the cardiovascular field.
- Prediction model
- risk prediction
- model validation
- model updating
- model impact assessment
- obesity
- clinical hypertension
- prevention
- diabetes
- general practice
- epidemiology
Statistics from Altmetric.com
- Prediction model
- risk prediction
- model validation
- model updating
- model impact assessment
- obesity
- clinical hypertension
- prevention
- diabetes
- general practice
- epidemiology
Introduction
Prediction models like those presented in the first article of this series,1 use multiple predictors (covariates) to estimate the absolute probability or risk that a certain outcome is present (diagnostic prediction model) or will occur within a specific time period (prognostic prediction model) in an individual.2–6 Estimated risks yielded by prediction models enable the stratification of individuals or groups of individuals by these risks.7 Prediction models are usually developed to guide healthcare professionals in their decision-making about further management—including additional testing, initiating or withholding treatment(s)—and to inform individuals about their risks of having (diagnosis) or developing (prognosis) a particular disease or outcome.8
Prediction modelling research as we recently described,7–10 may distinguish three major phases including: (1) developing and internally validating a prediction model; (2) testing in, and if necessary, adjusting or updating the model for other individuals (external validation); (3) assessing the model's impact on therapeutic management and patient outcomes. The abundant publications on the development of prediction models were covered in the first article of this series.1 Conversely, a relatively small number of studies have been published on the validation of prediction models and there are scarcely any showing whether implementing a prediction model has impact on healthcare providers' and individuals' behaviour or care, let alone on patient health outcomes or cost-effectiveness of care.4 To show that a prediction model successfully predicts the outcome of interest in the development sample even when complemented with internal validation techniques, is not sufficient to confirm that a model is valuable.7–10 Indeed, when applied to new individuals, the performance of prediction models is generally lower than the performance observed in the population from which the model was developed. Therefore, performance of developed and internally validated prediction models should still be tested or validated in new individuals before they are implemented in guidelines or applied in practice.10
When a validation study shows disappointing results, researchers often reject the original prediction model and develop a new one from their own data.11 12 However, the redeveloped model also often has several limitations, and multiple models for the same outcome create an impracticable situation where the user has to decide which model to use. For example, there are over 100 published models for predicting long-term outcome in patients with neurotrauma,13 over 80 for the prognosis after stroke,14 over 60 to predict outcome after breast cancer,15 over 25 in reproductive medicine,16 and over 20 models to predict the length of stay in intensive care units after cardiac surgery.17 Clearly, many more models are developed than are implemented or used in clinical practice. Moreover, if a new clinical prediction model is developed from every new population sample, previous predictive information already captured in previous studies and models is lost.11 12 This goes against the intention that scientific inferences should be based on evidence from as many sources and individuals as possible; a principle that is well recognised and used in intervention studies (eg, cumulative meta-analyses of randomised trials). An alternative solution to redevelopment, is to adjust or update existing prediction models with the external validation set data at hand.11 12
In the first article of this series of two,1 we have presented the focus of this series and an overview of the consecutive steps involved in prediction model development, internal validation procedures and quantifying the added value of new (bio)markers. In this second article, we discuss how to evaluate the performance of a risk prediction model in new data (external validation), the methods for adjusting or updating an existing prediction model to new circumstances when the predictive performance found in the external validation study is disappointing, and the methods for assessing the impact of prediction models. We illustrate each step with empirical examples from the cardiovascular field, building on the examples of the first article in this series.
Validating a prediction model
It is not enough to demonstrate a reasonable or good performance of a developed model on the development sample only, simply because most models there show optimistic results, even after corrections from internal validation procedures such as bootstrapping (as we discussed in paper I of this series1). It is essential to confirm that any developed model also predicts well in, and thus is generalisable to, ‘similar but different’ individuals outside the development set. The more these other situations differ from the development study, the stronger the test of generalisability of the model. Internal validation does not make use of other than the development data, and therefore will not provide the degree of heterogeneity that will be encountered in real-life applications of the model.
Fundamental issues in the design of validation studies have not been well explored,18 but in essence one only requires documentation of the predictor and outcome values in new individuals. We emphasise that model validation is not simply repeating the analytical steps applied in the development study in other individuals to see whether the same predictors and weights are found. Model validation is also not refitting the final developed model in the new individuals and checking whether the model performance—that is, discrimination, calibration and classification, is different as was found in the development study. Model validation is taking the original model or simplified score, with its predictors and assigned weights (eg, regression coefficients), as estimated from the development study; measuring the predictor and outcome values in the new individuals; applying the original model to these data; and quantifying the model's predictive performance (box 1).4 10 19–21 As discussed in the first article,1 discrimination, calibration and classification are also key aspects of predictive performance of prediction models to be quantified in external validation studies.
Guide on the main design and analysis issues for studies aimed at the external validation, updating or impact assessment of a prediction model
External validation
Objective: To apply a previously developed model to new individuals whose data were not used in the model development, and quantify the model's predictive performance.
Study individuals: An adequate sample of ‘different but related individuals’ as compared with the development study sample. Related here means ‘individuals suspected of having the same disease’ for a diagnostic prediction model, and ‘individuals at risk of developing the same event’ for prognostic models.
In temporal external validation, new individuals are from the same institution as in the development sample, but in a different (preferably later) time period.
In geographical external validation, new individuals are from different institutions or countries as in the development sample.
In domain validation, new individuals are very different from the individuals from which the model was developed.
Procedure: External validation of any type consists of taking the original model or simplified score, with its predictors and assigned weights (eg, regression coefficients), as estimated from the development study; obtaining the measured predictor and outcome values in the new individuals; applying the original model to these data; and quantifying the model's predictive performance.
Model performance measures: Discrimination, calibration, (re)classification measures.
Model updating
Objective: To adjust and/or improve the performance of an existing model for other institutions, countries, clinical settings or individual/patient populations.
Indication: Poor performance of the original model in an external validation study.
Requirements: Ideally, individual participant data from the new situation.
Methods: Updating methods range from simple adjustment of the baseline risk/hazard, to additional adjustment of predictors weights using the same or different adjustment factors, to re-estimating predictor weights and adding new predictors or removing existing predictors from the original model.
Model performance: Successfully updating an existing model can result in improved calibration alone, or in improved calibration and discrimination in the new situation, depending on the extent of model adjustment/updating.
Further validation: Just like a newly developed prediction model, adjusted or updated models should ideally also go through external validations.
Impact evaluation
Objective: To quantify the impact of using/providing the information of the prediction model on the behaviour and decision-making of the care provider and/or individuals, and consequently on the individuals' health outcomes and/or cost-effectiveness of care.
Design: Always a comparative design. Ideally cluster randomised design with care providers, practices or institutions being the clusters. Alternatives: individual-level-randomisation, stepped-wedge design, prospective before-after study, decision analytic modelling and cross-sectional studies with decision-making as outcome.
Method of model presentation: Assistive: an individual's predicted probability by the model is presented without corresponding decision recommendations. Directive: with corresponding decision or (self-)management recommendations.
Analysis: Comparing the outcomes in the index group (with use of the prediction model) with the outcomes in the control group (care-as-usual).
Temporal validation
New individuals may be from the same institution in a different, usually later, time period. Temporal validation is occasionally done by simple non-random splitting of an existing dataset by the moment of inclusion, and will thus share some of the above discussed ‘limitations’ of the random split-sample internal validation approach. These include not using all data for model development, and that individuals of the development and validation set remain rather similar. They still share the same inclusion and exclusion criteria and the same predictor and outcome definitions and measurement methods. A temporal validation may allow for more variation—if not only owing to changes in healthcare over time—when it involves a prospective study specifically designed for the validation purpose which starts after the model has been developed.
Geographical validation
Temporal validation cannot examine the transportability or generalisability of the predictive performance of the model to other institutes or countries—that is, geographical validation. Geographical validation studies commonly apply different in/exclusion criteria, and predictor and outcome definitions and measurements, as compared with the development study. As with temporal validation, geographical validation can again be done by non-random splitting of an existing study dataset by centre or country in for example, multicentre studies, or by validating a previously developed model in another centre or country that was not involved in the original development study. The latter geographical validation study involves a more stringent ‘proof of concept (prediction)’ owing to the probably greater differences in case mix, predictors and outcome measurements. Moreover, geographical validation may also be done retrospectively—that is, using existing datasets from other institutes or countries, or prospectively, by including new individuals in a specifically predesigned validation study.
Domain validation
A specific, and more rigid form of geographical validation or transportability test, is the validation of a developed model in very different individuals than those from whom it is developed, sometimes referred to as domain or setting validation.4 7 Examples are validating a prediction developed in secondary care individuals suspected of having venous thromboembolism in a primary care setting,22 validating a model developed in healthy individuals to predict the risk of cardiovascular events within 10 years (such as the Framingham risk score) in individuals diagnosed with diabetes mellitus type 2,23 or validating a model developed in adults to children.24 Note that like geographical validation, domain validation may also be carried out retrospectively—that is, using existing datasets, or prospectively, by including new individuals in a specifically predesigned validation study.
Updating a prediction model
Researchers probably encounter a poorer performance of a prediction model when tested in new individuals compared with that found in the development study. The likelihood of finding a lower predictive accuracy will increase if a more stringent form of validation is used: this is more likely in a geographical or domain validation than in a temporal validation. When a lower predictive accuracy is found, ‘validation investigators’ tend to simply reject that model and develop or fit a new one, sometimes by completely repeating the entire selection of predictors. This leads to a loss of previous scientific information captured in the previous (development) study, which is counterintuitive to the notion that inferences and guidelines to enhance evidence-based medicine should be based on as much information as possible. In addition, doctors are faced with the impracticable situations of having to decide which model to use in their patients, when many have been developed for the same outcome. A much better alternative to redeveloping new models in each new patient sample is to update existing prediction models and adjust or recalibrate them to the local circumstances or setting of the validation sample at hand (box 1). As a result, the adjusted, or updated, models combine the information captured in the original model with information from new individuals.7 12 19 25 26 Hence, the updated models are adjusted to the characteristics of new individuals and probably have improved transportability to other individuals.
Methods for prediction model updating
Several methods for updating prediction models have been proposed and evaluated (table 1).3 11 12 Most often, differences are seen in the outcome or event frequency between the development and new validation sample. These result in poor calibration of the model in the latter, due to predicted probabilities being systematically too high or too low. By adjusting the baseline risk or hazard (if known) of the original prediction model to the individuals in the validation sample, calibration can easily be improved.4 11 This requires the adjustment of only one parameter of the original model (table 1, method 1). Additional updating methods vary from overall adjustment of all predictor weights simultaneously, adjustment of a particular predictor weight, to the addition of a completely new predictor or marker to the existing model (table 1). Note that simple updating methods (1 and 2, table 1) at best improve calibration; discrimination remains unchanged as the relative ranking of the model's predicted probabilities stays the same after the updating. To improve discrimination, methods 3–6 are needed.
Application of the above methods leads to updated models which are adjusted to the circumstances of the validation sample. However, just like a newly developed model, we recommend that updated models should still be tested on their transportability and impact (see next section) before they can be applied in routine practice.7
Individual participant data from the new sample are needed for model updating, using standard methods (table 1) and these may not be available in some settings. In this case, it still may be possible to perform a simple adjustment to the prediction model should the frequency of the outcome and mean levels of the predictors in the new population be available.4 27
Two empirical examples of external validation and model updating
Geographical and temporal validation of the ADVANCE model
The ADVANCE model, in which development and internal validation are described in table 1 in the first paper of this series,1 was externally validated on 1836 patients with no history of cardiovascular disease (CVD) at baseline, included in the DIABHYCAR study, a randomised trial on the effectiveness of ramipril versus placebo, in patients with type 2 diabetes.28 Definitions and measurements of CVD outcomes in the validation set were similar to those in the development set (ADVANCE study). During 4 years of follow-up, DIABHYCAR recorded 183 CVD events. The authors validated the ADVANCE model by estimating its discrimination (using Harrell's c-statistic) and calibration (comparing visually the observed and predicted risks across deciles of predicted risk in a calibration plot, and by estimating the adjusted Hosmer and Lemeshow (HL) test statistic for survival models). This is an example of retrospective geographical and temporal validation on an existing dataset.
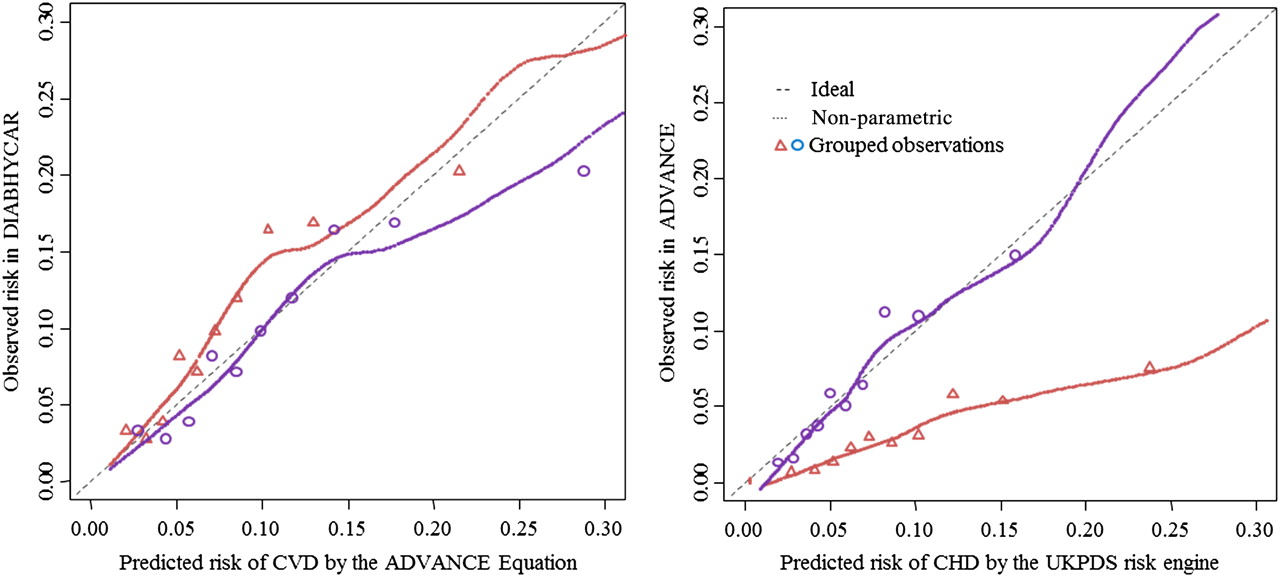
The c-statistic was 0.685 (95% CI 0.646 to 0.723; figure 1, left panel). The calibration plot showed a modest risk underestimation across the entire probability range (figure 2, left panel, red line), the corresponding ratio of predicted/observed risk29 was indeed lower than 0.82 (95% CI 0.71 to 0.95), and the HL-χ2=18.3 showed a significant (at the 0.05 level) p value of 0.032. The authors argued that to varying extents this might be due to differences between ADVANCE and DIABHYCAR in average values of various predictors and in administered treatments, and consequently in different event rates during follow-up. To test this, the authors validated the ADVANCE model after updating (adjusting) the model to the CVD event rate and to the average predictor values found in the DIABHYCAR dataset. This was done by replacing the original baseline survival probability in the original survival equation with that in the DIABHYCAR cohort and by replacing the mean predictor values in the linear component of the original survival equation (see table 1 in the first paper of this series) by their equivalents in the DIABHYCAR cohort. After these adjustments, as expected, the calibration plot improved with some overestimation in the highest decile (figure 2, left panel, blue line), the corresponding ratio predicted/observed risk became 1.13 (95% CI 0.98 to 1.31), and the HL-χ2 became 11.6 (p=0.24), all indicating good calibration.

Receiver operating characteristics curves showing the discriminative value of the ADVANCE cardiovascular disease (CVD) risk equation on the DIABHYCAR cohort (left panel), and that of the UKPDS coronary risk engine on the ADVANCE cohort (right panel). The dotted 45° line is the line of no discrimination.

Calibration plots for the 4-year predicted risk of major cardiovascular disease (CVD) by the ADVANCE CVD risk equation in the DIABHYCAR cohort (left panel), and of major coronary heart disease (CHD) by the UKPDS coronary risk engine in the ADVANCE cohort (right panel; plot for the Framingham CHD model not shown). The dotted 45° line denotes the perfect agreement between predicted and observed risk. For each figure panel, the smoothed lines approximate the agreement between predicted and observed risks across subgroups of participants ranked by increasing predicted risks, separately for the original risk equation (red lines and triangles) and after updating (blue lines and circles).
Geographical, temporal and domain validation of the Framingham coronary heart disease (CHD) and UKPDS CHD risk equations
The UK Prospective Diabetes Study (UKPDS) CHD equation has been designed for risk evaluation for any duration of follow-up in a patient with newly diagnosed type 2 diabetes, or who has had diabetes for a known length of time.30 The Framingham Anderson CHD equation has been developed from data of individuals sampled from the general population, to estimate the CHD risk over a range of 4–12 years.31 It was not specifically developed from a sample of patients with diabetes type 2. But since this equation includes the presence or absence of diabetes as one of the predictors, it might be useful also for patients who have diabetes type 2. The ADVANCE investigators therefore decided to validate both prediction models using the same data of the ADVANCE trial (see the first paper of this series1).
The UKPDS equation validation can be seen as a form of retrospective geographical and temporal validation on an existing dataset, whereas the Framingham Anderson CHD validation is a form of retrospective domain validation (and also geographical and temporal validation) on an existing dataset.
The authors used the baseline characteristics of the ADVANCE trial participants to calculate the expected 4-year probability of CHD and for each participant according to the two prognostic prediction models. As most models show poorer calibration when applied or validated in another study population, the authors also assessed the calibration after updating both prediction models to the baseline risk of CHD in the validation population (recalibration).10–12 32 As the discrimination is a rank-order statistic, it does not change after such recalibration of the baseline risk only, and was thus not reassessed.
All subjects in the ADVANCE study had a minimal follow-up of 4 years (see paper I of this series). During this follow-up, 241 CHD events occurred in the ADVANCE validation sample. Discrimination of both models over this first 4 years, as assessed by the c-statistic, was 0.650 (Framingham equation) and 0.692 (UKPDS equation; figure 1, right panel). The risk of major CHD was systematically overestimated by both prediction models. Figure 2 (right panel, red line) illustrates this for the UKPDS equation, where the calibration line was always substantially below the diagonal line of perfect calibration. The calibration of both models greatly improved when these were adjusted or updated to the baseline risk in the validation population (figure 2 right panel, blue line).
Quantifying the impact of a prediction model
Prediction models are not developed to replace doctors, but to provide objective estimates of health outcome risks for both individuals (patients) and healthcare providers, to assist their subjective interpretations, intuitions and guidelines.8 33 34 However, prediction models can eventually affect individuals' health and cost-effectiveness of care only when the information (eg, predicted risks) provided by the model change individuals' and care providers' behaviour and (self-)management decisions.7 21 Therefore, the impact of the actual use of existing validated (and perhaps updated) models on the behaviour and (self-)management of doctors and individuals, and subsequently on health outcomes and cost-effectiveness, should be studied separately in what are known as model impact studies (table 2).
Study designs to study the impact of a prediction model on individuals' and doctors' behaviour or decision-making, and on individuals' health outcomes
Validation studies therefore clearly differ from an impact study, in the sense that model validation is usually performed using cohorts of individuals with no requirement for a control group, while assessment of the impact of a model on (care or self-)management behaviour and individual health outcomes requires a comparative study.7 21 A control group may be randomly assigned to usual care or management without the use of predictions from the model, while in the intervention group those predictions are made available to individuals and/or healthcare professionals to guide their behaviour and decision-making.
Directive versus assistive approach
In impact studies, two main approaches may be used to affect individuals' and providers' behaviour and decisions with estimated probabilities from models.7 21 In the assistive approach, estimated probabilities of the outcome are provided without recommending decisions. By contrast, the directive decision approach explicitly recommends or even prescribes specific therapeutic management or decisions for each probability category.21 The assistive approach is more respectful of the judgement of individuals and doctors and leaves room for intuition, but a decisive approach may have a greater clinical impact.21 41 42 Availability in routine care of electronic health records that can automatically give predictions for individual patients, improves implementation and, accordingly, impact analysis of predictive models.42 43
Designs of a model impact study
Randomised follow-up studies
The comparison in impact studies is scientifically strongest when a cluster randomised trial is used (table 2).7 One may randomise healthcare professionals (as clusters) or centres (practices). The latter may be preferable since it avoids contamination of experience between healthcare professionals within a single centre. If randomisation is conducted at the individual's level, additional power is indeed obtained for the same number of individuals included. However, patient-level randomisation may result in bias owing to learning effects, in the sense that the same healthcare provider will alternately apply the model's predicted probabilities to subsequent individuals, which may reduce the contrast between the two randomised groups.44
An appealing variant, of a cluster randomised trial, particularly for complex or multifaceted interventions that need to be introduced into routine care, is the stepped-wedge (cluster randomised) trial.45–47 Stepped wedge means that clusters—for example, hospitals or general practitioner practices, are randomly allocated a time period when they are given the intervention, here the prediction model. All the clusters will be applying both care-as-usual (control) and the prediction model (intervention), but the time when they receive this prediction model is randomly ordered across the clusters. This is a one-way crossover cluster trial, where the clusters cross over typically from control to intervention45–49 at regular, randomly allocated time intervals.
Non-randomised follow-up studies
Because randomised trials are expensive and time consuming, other approaches are possible. One such approach is the prospective ‘before–after’ impact study, in which comparison is made on the outcomes that are measured in a time period before the model was introduced versus a time period after which the model was made available to the same care providers. However, this design is sensitive to temporal changes in, for example, therapeutic approaches. A subtle variant to the before–after approach, and therefore sharing the same limitations, is the ‘on–off’ impact study where the outcome is measured in alternating time periods when the prediction model is or is not available in a particular centre.21 Here, a problem is that the practising care providers in the centre may have changed over time, which may bias results.
An attractive alternative when outcomes are relatively rare, or when a long follow-up is required, is decision analytic modelling.7 26 This approach starts with a well-developed and externally validated (and perhaps updated) model, and combines information on model predictions with information about the effectiveness of treatments from randomised therapeutic trials or meta-analyses. If such an approach fails to show improved outcome or favourable cost-effectiveness, a long-term randomised impact study may not even be indicated.
Cross-sectional studies
When the outcome of interest is only behaviour or decision-making of healthcare professionals, a cross-sectional study with healthcare professionals' decisions as the primary outcome, without follow-up of individuals, will suffice.7 26 In this approach, doctors or individuals can be randomised to either receiving or not receiving predictions from the prediction model. Their therapeutic or other management decisions are compared.
Finally, there is the much simpler before–after study design within same doctors'. In this healthcare professionals are asked to make a treatment or management decision for an individual before they have been provided with the individual's predicted risk by the model, and subsequently after they have been ‘exposed’ to the model predictions for the same patient. This design also does not require follow-up to patient outcomes to be observed, and is relatively cheap and easy to implement.
Empirical examples of impact studies
Impact of personalised CVD risk estimates (both assistive and directive) on physical activity
The UKPDS CVD risk engine is a model developed from a British cohort of individuals with newly diagnosed type 2 diabetes who took part in the UKPDS trial, to predict the 10-year risk of fatal and non-fatal CVD (see also above).30 48 Price and coworkers used estimates from this model to assess the impact of personalised cardiovascular risk estimates on physical activity in a randomised trial.49 Participants (194 adults) were selected from four general practices in Oxfordshire. Participants were randomised following a 2×2 factorial design to receive either a personalised 10-year cardiovascular risk estimate (index) or were only told their blood pressure, total cholesterol and fasting glucose values as recommended by the guidelines at that time (control); an assistive approach. They were subsequently randomised to receive (index) or not receive (control) a lifestyle advice intervention; a directive approach.
The personal risk estimate of 10-year risk of CVD was estimated using the UKPDS CVD risk engine by a tool purposely designed to achieve maximal comprehension by participants. Participants were informed about their estimated current risk as well as the estimated ‘achievable risk’. The latter was estimated assuming that the current targets for risk factors (eg, systolic blood pressure, low-density lipoprotein (LDL) cholesterol, HbA1c, smoking cessation) were met based on the expected risk reduction of the administered interventions if the current risk indicated their administration. Patients were also provided with a printout copy of both risk estimates. Their doctors were not made aware of those estimates until the participants had completed the study. Interventions were delivered by an unblinded research fellow.
The primary outcome was difference in physical activity at 1 month, and secondary outcomes included changes in anthropometric and biochemical measurements.
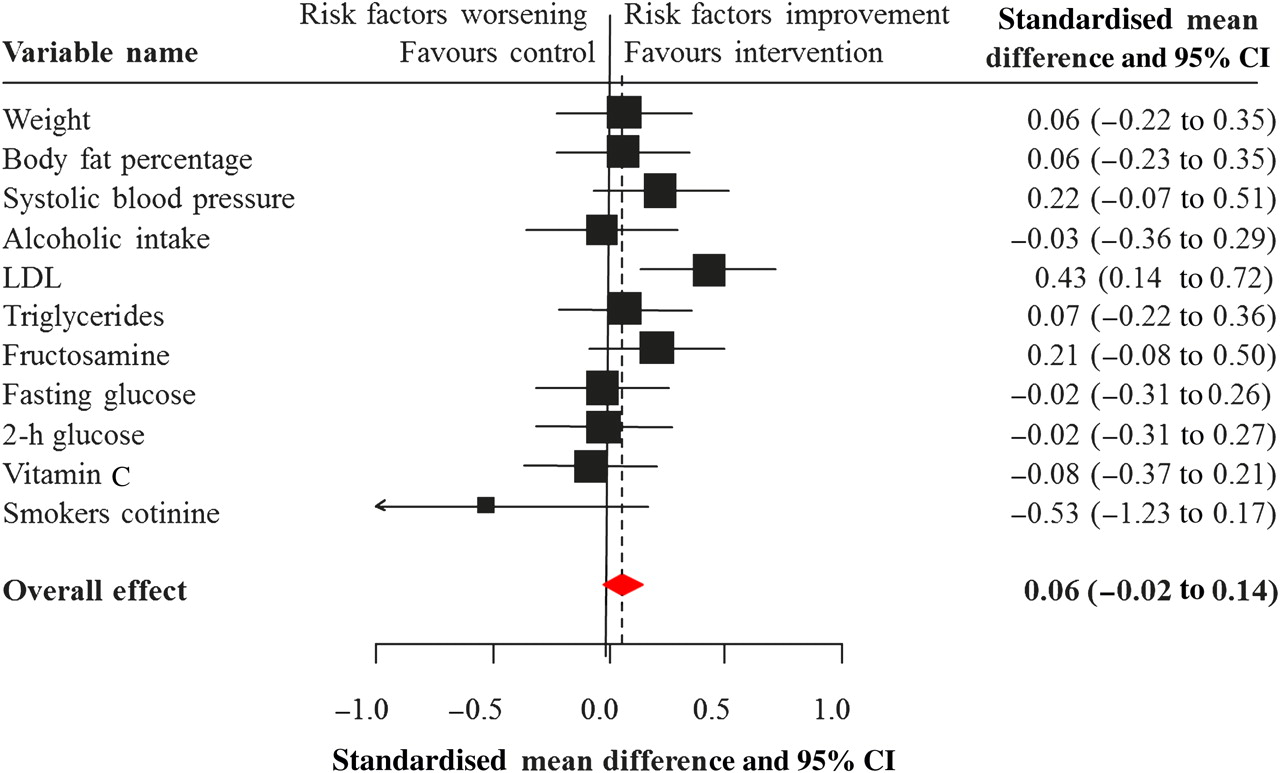
Of the 194 participants randomised, 185 (95%) completed the study. In the risk estimate arm, change in physical activity as assessed through accelerometer counts was not significantly different between participants who received personalised CVD risk estimates and those who did not. A net 7% decrease in mean levels of LDL cholesterol was seen in the intervention group despite similar uptake of lipid-modifying treatments in the two groups during follow-up. No significant between-group difference was seen for the other outcomes (figure 3). In the lifestyle arm, interventions led to significant reductions in waist circumference (in men only), triglycerides and serum cotinine (among smokers), but not in other outcomes. Furthermore, there was no indication of a greater effect in the subgroup of participants who received the two interventions. Therefore, the authors concluded49 that there was no evidence of a beneficial effect of personalised risk estimates on physical activity and cardiovascular risk factors.
Changes between baseline and 1 month after a personalised cardiovascular risk estimate.49 LDL, low-density lipoprotein.
The Atherosclerosis Assessment Via Total Risk (AVIATOR) study
The AVIATOR study was a randomised trial conducted in the general medical clinics of Grady Memorial Hospital in the USA.39 It was designed to test the hypothesis that global risk assessment could help doctors to determine individuals at high-risk of CHD and subsequently, based on these predicted risks, better target preventive treatments. Participants were 368 individuals without a history of CHD who were not receiving treatment with a statin, visiting the primary care clinics of the Grady Memorial Hospital. They were randomised to the intervention group (186 participants) or to the control group (182 participants). In the intervention group, the 10-year absolute coronary risk was computed according to the Framingham Wilson's equation,50 and conveyed to the individual and doctor via a simple educational tool appended to the patient's charts: assistive approach. General primary prevention goals according to prevailing guidelines at that time were appended to the charts of participants in the control group.
The study outcomes were the proportion of high-risk individuals (primary outcome), and moderate-risk individuals (secondary outcome) receiving a new statin prescription.
The statin prescription rate during follow-up was similar among the high-risk participants (10-year CHD risk ≥20%) in the two groups (p=0.86). However, among moderate-risk participants (10-year CHD risk 10–19%) who were formally not eligible for statin administration according to the guidelines, more participants in the intervention group were prescribed a statin than in the control group (28.8% vs 12.5%, p=0.036). Among low-risk participants (10-year CHD risk <10%), 6.7% and 15.5% received a statin in respectively the intervention and control group (p=0.068). Doctors in the intervention group more often recommended smoking cessation counselling therapy (13% vs 0%), while those in the control group more often performed dietary counselling therapy (26.6% vs 15.9%, p=0.01). The authors concluded that a simple global risk educational tool could be beneficial in targeting statin treatment to moderate-risk individuals who do not have markedly raised LDL cholesterol levels.
Concluding remarks
Modern medicine, in general, and cardiovascular medicine, in particular, increasingly relies upon diagnostic and prognostic prediction models to inform individuals and healthcare professionals about the risks of having or developing a particular outcome, and to guide decision-making aimed at mitigating such risks. To be useful for these purposes, a prediction model must provide validated and accurate estimates of the risks, and the uptake of those estimates should improve subject (self-)management and therapeutic decision-making, and consequently, (relevant) individuals' outcomes and cost-effectiveness of care. Validation studies are important because the performance of most developed and internally validated prediction models, when applied to new individuals, is poorer than the performance seen in the sample from which it was developed. Validation of a prediction model must include, at least, an assessment of the agreement between predicted and observed event rates, and a quantification of the model's ability to distinguish between individuals who will or will not have or experience the outcome of interest. Updating or adjusting an existing prediction model to local or new circumstances to improve its performance is preferable to developing new models from scratch for each validation sample, centre, hospital, or setting. Ultimately, the impact of using a prediction model on improved health outcomes and cost-effectiveness of care should be assessed, ideally in (cluster) randomised trials, although a decision or cost-effectiveness modelling approach may sometimes suffice (box 1).
References
Footnotes
Linked article 301246.
KGMM and APK contributed equally.
Funding Karel GM Moons receives funding from the Netherlands Organisation for Scientific Research (project 9120.8004 and 918.10.615).
Competing interests None.
Provenance and peer review Commissioned; externally peer reviewed.