Article Text

Statistics from Altmetric.com
The recent publication of draft copies of the human genome sequence from both public and private sector consortia has fuelled anticipation that eventually, once all genes have been identified, we will be able to ascertain which of them are involved in human diseases, including those affecting the cardiovascular system. Understanding the molecular biology behind both inherited and acquired disorders is now viewed as essential to provide a full picture of the aetiology and progression of disease. Within the past decade considerable advances have been made in identifying the genetic basis of myocardial disorders such as familial hypertrophic cardiomyopathy and dilated cardiomyopathy, as well as the molecular signalling pathways and gene regulatory events that characterise acquired disease such as pressure overload induced cardiac hypertrophy. Furthermore, by defining the molecular processes underlying normal development we may be able to manipulate immature cell phenotypes such as those of embryonic stem cells or skeletal myoblasts to replace damaged, terminally differentiated cells such as cardiac myocytes. In this review we outline the basic principals of gene expression, the different mechanisms by which expression is regulated and how these can be examined experimentally.
DNA MAKES RNA MAKES PROTEIN
The blueprint for any organism is contained within its genome in the form of chromosomes and is written in the universal four “base” language of adenine (A), guanine (G), cytosine (C), and thymine (T). Chromosomes are built of chromatin, double stranded DNA wrapped around a multi-protein complex core comprised of histone proteins. This DNA contains the language (DNA or nucleotide sequence) that can be read and translated into proteins, and these areas of DNA are called genes.1, 2 In higher organisms, ranging from yeast to plants and man, practically all genes are interrupted, with sequences coding for protein (coding exons) separated by regions of non-coding DNA called introns. The beginning and ends of genes are usually marked by exons that do not code for parts of the protein, the so called non-coding exons. Within coding exons, contiguous groups of three bases (codons), form the genetic code. The 64 (43) individual codons specify for the 20 amino acids from which proteins are made, or signal the start (initiator methionine codon) or end (stop codon) of translation. It is therefore the contiguous order of the codons within a gene that delineate the linear amino acid sequence of the protein produced.
In general, gene expression describes the production of RNA and, subsequently, protein from a gene. This process can be split into three major parts: transcription of the gene in the nucleus to make primary RNA, splicing of the primary transcript to form the mature messenger RNA (mRNA) and translation of mRNA in the cytoplasm to produce the protein for which the gene codes (fig 1). Transcription is carried out by an enzyme called RNA polymerase II (RNA pol II) under the direction of specialised basal transcription factors that form a multi-protein complex with RNA pol II on the gene promoter.1 The promoter contains the start site of transcription, usually designated +1, which marks the beginning of the first exon of the gene and hence corresponds to the first nucleotide of the mRNA. Binding sites for various transcription factors, which are DNA binding proteins with highly specific affinities for particular DNA sequences, sequester transcription factors to the gene where they participate in boosting (or, in some cases, repressing) the level of transcription. Transcription factors may bind within the promoter or lie within areas called enhancers that are located distally—usually upstream, but occasionally downstream, of the promoter. Considerable effort has focused on identifying promoter and enhancer sequences responsible for directing gene transcription and the identification of the factors that act on them.3 Once bound to their cognate DNA sequences, transcription factors help drive the rate at which RNA pol II initiates fresh rounds of transcription. The polymerase moves along the gene making a primary RNA copy of one strand of the DNA duplex, copying both exonic and intronic sequences. This primary RNA transcript is subsequently processed to remove the intron derived sequences and the exons joined together (RNA splicing). Following some 5` and 3` modifications, such as the addition of a 3` poly-adenylic acid tract (polyA tail), the final mRNA product is exported from the nucleus to the cytoplasm, where it serves as a template for the production of protein by the ribosomes. Subsequent post-translational modifications such as cleaving off any propeptide or leader sequences which direct the protein to its ultimate destination in the cell or the attachment of phosphate or acetyl groups to specific amino acid residues may be necessary to produce the final functional form of the protein.

The process of gene expression. Chromosomes are scaffolds of DNA organised around protein (histones) in units called nucleosomes. DNA is unwound from histones before transcription of a gene by RNA polymerase II and transcription factors (coloured). The primary RNA transcript, which is a copy of both exonic (red) and intronic (blue) DNA sequences, is processed subsequently to remove intronic sequences (mRNA splicing). The resulting mRNA is then exported to the cytoplasm for translation and subsequent post-translational modification such as methylation, glycosylation or phosphorylation. Detection of mRNA by northern blot is illustrated: the blot shows that mRNA for the slow skeletal isoform of troponin T (TnTs) is expressed only in adult skeletal muscle (Sk) and not in fetal (F) or adult (H) heart or liver (L). Rehybridisation of the blot with a probe to 18S rRNA (18S) shows presence of RNA in each lane. Protein expression is analysed by western blotting: in the example shown, a universal antibody recognising all three troponin I (TnI) isoforms shows distribution of fast skeletal (f), slow skeletal (s) and cardiac (c) isoforms in adult skeletal muscle (Sk) and fetal heart (F). Figure courtesy of KA Dellow.
CONTROL POINTS FOR GENE EXPRESSION
All of the stages of gene expression are points at which regulation can be exerted. However, the primary point of control is at the level of transcription. Many promoters and enhancers of myocardial genes have been cloned and transcription factors active in heart and belonging to a variety of gene families have been identified in recent years (table 1).4–9 The overwhelming observation that can be drawn is that expression of individual genes is regulated (1) through the coordinate binding of different types of transcription factors, (2) by interactions between factors and with ancillary co-factors such as histone acetylases (HATs) or deacetylases (HDACs), which do not necessarily bind to DNA themselves, and (3) through signal transduction pathways which influence their activity by, for example, phosphorylation.3 Most transcription factors are modular in structure, containing separable protein domains that carry out a particular function such as DNA binding, dimerisation with other family members (for example, the related bHLH proteins HIF-1α and β, products of separate genes9) or serving as transcriptional activation domains (TADs) to promote high level transcription. Ultimately, once bound to DNA transcription factors interact with other bound proteins and act to increase the rate of RNA synthesis. TAD activity, which is often measured by introducing cloned transcription factors into cells grown in culture (see below) may be intrinsic or may reflect the binding of a co-activator or co-factor protein which itself possesses significant activation properties. For example, myocardin is a recently identified heart restricted co-factor for the ubiquitously expressed serum response factor (SRF).6 SRF binds to the promoters of several genes expressed in heart, including cardiac α actin, and has been shown to interact with many factors including the homeobox factor Nkx-2.5 and the zinc finger factor GATA-4 to regulate expression. In contrast to Nkx-2.5 and GATA-4, which are transcriptional activators in their own right, myocardin does not bind to DNA but complexes with bound SRF and serves as an extremely potent co-factor for transcription, promoting up to a thousand-fold activation in combination with SRF.
Some examples of key transcription factors expressed in the heart
Transcription factors may be expressed in a highly tissue restricted manner or at particular developmental stages, in turn regulating the expression of their target genes. For example, GATA factors are expressed from the earliest detectable stages of cardiogenesis and may play a role in gene regulation at this stage.10 Later, Nkx2.5 shows regional variation in expression and may play a specific role in the developing myocardial conduction system. Most transcription factors can be grouped into gene families on the basis of sequence similarity in regions of functional importance, such as a DNA binding domain or a protein dimerisation interface. Such a high degree of sequence homology allows new family members to be discovered by searching DNA or protein sequence databases across diverse phyla. In this way Nkx-2.5 was identified as the mammalian homologue of a Drosophila gene called tinman, (named after one of the characters in The Wizard of Oz) originally identified as a mutation that resulted in lack of development of the heart equivalent in the fly, the dorsal vessel.8 In humans, mutations in the Nkx-2.5 gene have been correlated with a variety of cardiac anomalies including tetralogy of Fallot and idiopathic atrioventricular block.11
Currently, there is renewed interest in the role that chromatin structure plays in regulating gene expression.12 It has long been known that when DNA is wrapped around histones in the form of chromatin, gene activity is silenced, and that the localised unwinding of the DNA from chromatin, accompanied with histone displacement, is vital to allow gene expression to progress. Central to recent studies has been the identification and biochemical characterisation of proteins that possess HAT or HDAC activity, adding or removing, respectively, acetyl groups from exposed lysine residues on histones. HAT activity correlates with activation of gene expression, while HDAC activity results in repression.13 In several cases the functions of these proteins have been shown to be intimately linked to the state of transcription factors binding to target genes. For example, the active heterodimeric form of the basic helix-loop-helix transcription factor HIF-1 (table 1) senses changes in partial pressure of oxygen and thus acts as a hypoxia sensor in several systems, including angiogenesis and vascular remodelling.9 Once bound to the DNA of target genes for regulation, C terminal TADs in the HIF heterodimer interact with transcriptional co-activators such as the CREB-binding protein, CBP. (In cardiac muscle, the most likely co-activator is the related protein p300). These large proteins possess intrinsic chromatin remodelling activity by recruiting to the DNA still more proteins which allow chromatin to unwind. Probably the best understood system is currently that involving retinoid and steroid hormone receptors such as thyroid hormone receptor α1 (TRα1) that, once it has bound its cognate ligand T3, activates expression of genes such as cardiac α myosin heavy chain.2 The binding of T3 to the hormone binding domain of TRα1 results in a conformational change in the proteins' structure, allowing the receptor to interact with co-activators. The net result is that HAT activity promotes localised unwinding of chromatin, allowing access of RNA pol II and basal transcription factors to the DNA. In the absence of T3, the nuclear receptor still binds to DNA but interacts instead with co-repressors such as N-CoR and SMRT, which then recruit HDACs to the DNA, leading to chromatin condensation and repression of gene expression.14
The activation of transcription factors by phosphorylation is a focal point for transducing extracellular stimuli through MAP kinase signal transduction pathways. For example, CBP associates only with the phosphorylated form of the CREB protein, a transcription factor that binds the cyclic AMP response element found in many gene promoters. Once bound to CREB, CBP forms protein–protein interactions with the basal transcription factor TFIIB, allowing transcription by RNA pol II to progress. Members of the myocyte enhancer factor-2 (MEF-2) family of transcription factors (table 1), which are widely expressed but appear to be enriched and have particular roles in skeletal and cardiac muscle, may regulate changes in gene expression arising from a hypertrophic stimulus. MEF-2 proteins have been implicated as responders to MAP kinases activated by hypertrophic stimuli in cardiac myocytes.15 The hypertrophic agonists endothelin-1 and phenylepherine activate p38 MAPKs in cultured rat neonatal cardiac myocytes16, and in vivo p38 activity increases in aortic banded mice which go on to develop pressure overloaded hypertrophy (Wang and colleagues 1998, cited in Han and Molkentin15). In rat, a similarly induced hypertrophy results in an increase in DNA binding activity of MEF-2.17 As development of hypertrophy is associated with changes in transcription of various myocardial genes which require MEF-2, this suggests that MEF-2 may be a direct target for MAP kinase signalling (fig 2).
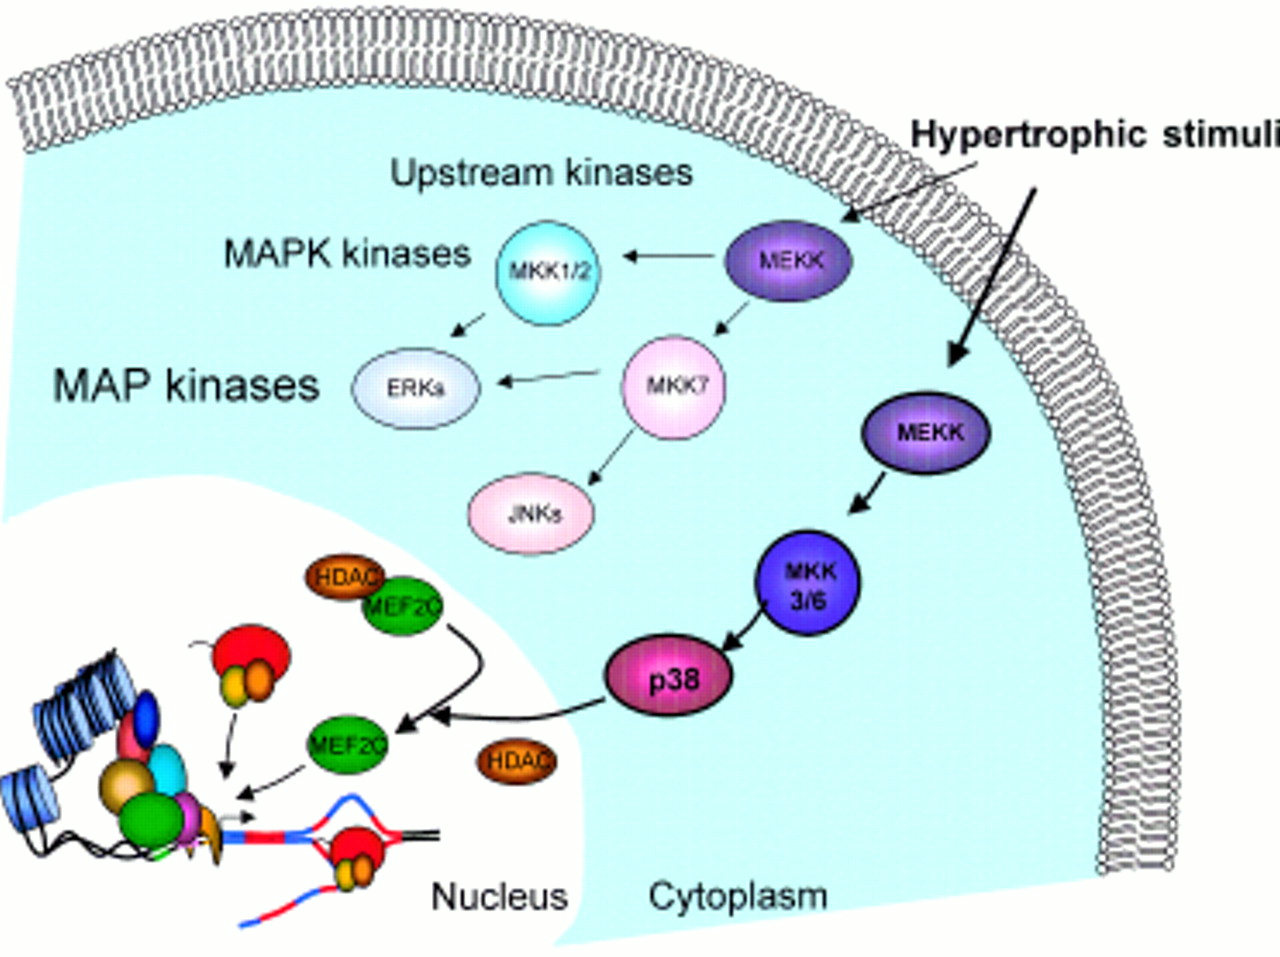
Linking MEF2 to hypertrophy. Hypertrophic stimuli activate intracellular signalling pathways. Upstream protein kinases (for example, MEKKs) activate MAP kinase family members (MKKs) which in turn phosphorylate the three MAP kinases p38-MAPK, JNKs, and ERKs. MAP kinases have been linked to the phosphorylation of certain transcription factors, for example, p38-MAPK has been shown to activate MEF2 family members (see text for details). This implicates MEF2 proteins as direct transducers of intracellular signalling pathways to bring about some, or all, of the changes in gene expression associated with hypertrophy. Figure courtesy of KA Dellow.
A second point at which gene expression can be controlled is at the level of mRNA splicing. The primary RNA transcript of many genes may be alternatively spliced in that certain exons may be excluded or included from the transcript to produce the final mRNA. In this way, multiple proteins may be generated from a single gene according to the combination of exon derived RNA segments that are spliced together. The vertebrate tropomyosin (TM) genes are examples of genes expressed in both cardiac and skeletal muscle that are subject to complex patterns of alternative mRNA splicing. For example, two isoforms of the α-TM gene in Xenopus, differ in their inclusion of alternative 3`untranslated region exons and show restricted expression in the embryo.18 The XTMα7 isoform is found in the somites, from which the skeletal muscle develops, whereas the XTMα2 isoform is expressed in both somites and embryonic heart. In the adult, XTMα2, but not XTMα7, is selectively expressed in striated muscle and heart.
Following translation of the mRNA into polypeptide, production of mature active protein may require several steps, each of which is open to regulation. This is well illustrated by the matrix metallproteinases (MMPs) which are believed to play a key role in myocardial remodelling.19 MMPs are produced in an inactive form (as a zymogen) which requires cleavage to produce active enzyme and are further regulated by specific inhibitory molecules (tissue inhibitors of metalloproteinases or TIMPs). Examining MMP gene expression at the level of RNA is of importance to understanding gene regulation, but may not therefore be a good indicator of MMP enzyme activity. Clearly, it is important to understand the biological system in question before deciding which is the most relevant level of regulation. For the purposes of this review we will be focusing on the initial stage of gene expression, namely transcription, and the methods of examining this as well as monitoring RNA content.
DISSECTING PROMOTER FUNCTION
In order to understand how genes are regulated in the heart, many gene promoters have been isolated and characterised with regard to the key regulatory DNA sequences they harbour and the transcription factors that bind them. A widely used method of measuring promoter function is to insert (clone) the promoter and various lengths of upstream sequence into an artificial plasmid-based construct in front of a reporter gene whose expression can be easily monitored. Typically the firefly gene luciferase or the bacterial genes chloramphenicol acetyl transferase (CAT) and β-galactosidase (LacZ) are used for this purpose. Constructs can be introduced into cells in culture by a variety of transfection techniques, or into whole animals using transgenic approaches. By careful choice of expression constructs containing progressively smaller deletions, the positions of DNA sequences responsible for high level transcription, tissue specificity or specific responses to stimuli (for example, stretch or agonist induced hypertrophy) can be found. The binding sites for candidate transcription factors can then be pinpointed accurately through mutagenesis of individual nucleotides to test the validity of those sequences. In this way, we and others have dissected the promoter of the cardiac troponin I gene, which is only ever expressed in cardiac muscle.
Deletion analysis of the human gene promoter and upstream sequences has revealed several important transcription factor binding sites within 100 nucleotides upstream of +1 (the conventional notation for promoter sequence is negative numbering running upstream from the transcription start site). Among these is an A/T rich element centred around −30 that binds the TATA-box factor, TBP, the octamer protein Oct-1, and several MEF2 proteins. There are two binding sites in the human TnIc gene for GATA-4 and a C-rich sequence around −95 that encompasses both binding sites for the zinc finger factor Sp1 and a CACC-box with the sequence CCCACCCC.20 Mutation of each site in TnIc promoter-CAT reporter constructs results in a 50–95% reduction in transcriptional activity when transfected into cultured cardiac myocytes, suggesting that each site serves to bind proteins involved in maximal transcriptional activity. The identity of these proteins was characterised using the electrophoretic mobility shift assay (EMSA), also known as band shift assay. In this assay, a radiolabelled double stranded DNA fragment containing a putative binding site for a transcription factor (usually referred to as a cassette and generated by annealing short synthetic oligonucleotides corresponding to the two complementary strands of DNA) is mixed with an extract of nuclear proteins prepared from cells or tissue. If a protein binds the cassette, it will retard its migration compared to unbound cassette when subjected to electrophoresis through a non-denaturing polyacrylamide gel on account of the added mass of the protein.
Mutagenesis of individual nucleotides in the cassette or titration of unlabelled competitor cassettes in molar excess enable us to analyse the specificity of interaction between factor and DNA. By incubating the protein–DNA complex with antibody to putative factors, a “supershift” complex can be obtained (due to the added mass of the antibody) and the identity of bound proteins thereby confirmed (fig 3). Furthermore, by using nuclear extracts from different cells, an indication of the distribution of the factor can be determined. For example, our group has recently found shown that of four proteins binding the human TnIc CACC-box, two are members of the widely expressed Sp family of zinc finger factors while the other two appear to be expressed only in cardiac myocytes.21 These experiments therefore identify the regions involved and the factors they bind. Similar experiments in mouse have been taken further by showing that only 230bp of the mouse TnIc promoter are necessary to drive cardiac restricted expression of a LacZ reporter gene in transgenic mice.22

Visualising DNA–protein interaction by electrophoretic mobility shift assay (EMSA). A double stranded oligonucleotide cassette containing a consensus binding site for GATA factors (A/TGATAA/G) was radiolabelled and incubated with nuclear protein extracts from neonatal cardiac myocytes. Lane 1: A specific GATA-4-DNA complex is formed (solid arrowhead) which migrates behind (hence mobility shift) the free probe (FP). Lane 2: The identity of the bound protein is confirmed by addition of a specific antibody which results in a DNA/protein/antibody complex (supershift) (arrow). Specificity of binding can be demonstrated by mutation of the oligonuleotide sequence which results in loss of GATA-4 binding—not shown (see Dellow and colleagues21).
The role of specific factors in regulating a promoter can be assessed by simultaneous introduction (co-transfection) of suitable promoter-reporter constructs with an expression construct encoding the factor(s) in question. For example, the role of GATA-4 in regulating cardiac specific expression has been examined in a number of contexts. In an elegant experiment a reporter construct containing the promoter and upstream sequences of the α-MHC gene, which contains two binding sites for GATA-4, was barely active when injected into skeletal muscle, which lacks endogenous GATA-4.23 However, expression could be boosted fourfold by co-injection of an expression vector for GATA-4 (fig 4). In contrast, a mutant reporter construct in which both GATA-4 binding sites had been mutated exhibited only 12% of the activity of the wild-type construct.

GATA-4 directs expression of an α-MHC-CAT reporter when co-injected into skeletal muscle, which lacks endogenous GATA-4. Neither GATA-4 nor the cardiac α-MHC gene, which contains GATA-4 binding sites in its promoter, are normally expressed in skeletal muscle. Co-injection of a promoter-reporter construct gene containing a CAT gene under control of the wild type (WT) α-MHC promoter together with a GATA-4 expression vector results in a fourfold increase in reporter activity compared to in the absence of GATA-4. Mutation of the GATA-4 binding sites (mut) abrogates activation by the transcription factor (see Molkentin and colleagues23).
METHODS FOR MEASURING GENE EXPRESSION
Many techniques have been established for studying gene structure and expression. In particular, a variety of methods for measuring mRNA have been developed that allow abundance, tissue specificity, and developmental expression to be followed. The relative advantages and disadvantages of the major techniques are shown in table 2.
Comparison of some commonly used methods for RNA detection
Southerns, northerns, and westerns
Electrophoresis of DNA or RNA molecules through an agarose or polyacrylamide gel matrix form the backbone of some key molecular biology techniques as the speed and distance that molecules migrate is in direct proportion to their size. Hence, DNA or RNA fragments can be easily separated according to size.2 Denaturing and transferring DNA fragments out of gel onto a membrane of similar dimensions to the gel is known as Southern blotting, so called in deference to its inventor, Ed Southern. The blot preserves the spatial distribution of the separated fragments and fixes them permanently on the membrane. Thus, we can separate out individual molecules from a complex starting mixture such as total genomic DNA digested with restriction enzymes and look at specific DNA sequences by hybridising the resulting Southern blot with gene specific probes. Often, the high degree of conservation between the same gene from different species can be exploited to use a probe to hybridise across species on a Southern blot. For example, a new gene from heart may be identified in mouse and we would wish to analyse the gene structure of its counterpart in man. As many genes belong to extensive gene families related in terms of DNA or protein sequence (homology), this can be exploited to use one gene to identify a related family member, as in the earlier cited example of using the fly gene tinman to isolate its vertebrate homologue Nkx-2.5.24
The majority of techniques for studying the expression of a gene take messenger RNA as the starting material. As with DNA analysis by Southern blotting, RNA can be studied by northern blotting (fig 1). In Northern blotting, RNA molecules are resolved on agarose gels and a DNA probe for the gene of interest is then used to identify expression of the gene and to gauge the size of the transcript. By including RNA samples from various human tissues on a blot it is possible to determine in which tissues in the body a particular gene is expressed. Various methods of measuring RNA are described in table 2.
The expression profile of proteins can be determined in a similar way by resolving a protein mixture by electrophoresis on a polyacrylamide gel matrix under denaturing conditions (to ensure proteins migrate according to their molecular mass). A modified blot procedure (western blotting) is used to transfer the proteins to a membrane, the proteins are then renatured and target protein(s) identified using specific antibodies (fig 1). Analysis of protein expression is an important aspect to understanding the constituents and function of the cell, and modern techniques of analysis, referred to generically as proteomics, have been reviewed elsewhere.25
Polymerase chain reaction
One of the most useful innovations in molecular biology in the last few decades has been the development and continued refinement of the polymerase chain reaction (PCR). This technique is an enzymatic reaction which allows the exponential amplification of specific DNA sequences from vanishingly small amounts of starting material, often leading to an amplification of a million-fold or more.26 PCR amplification works by successive rounds of thermal denaturation at temperatures above 90°C to separate the two strands of the DNA template, cooling to allow annealing of oligonucleotide primers with their target sequences, and elongation by a thermostable DNA polymerase at 72°C (whereby new DNA is synthesised by extension of the annealed primers), thereby making two copies of the original target. Each round of PCR results in a doubling of the target DNA.
The amplification process of PCR makes it well suited to identifying gene expression in RNA, particularly prepared from biopsies or similar limiting sources of material. RNA is prepared and then converted to cDNA (reverse transcription) to provide the initial DNA template for PCR amplification. Small, chemically synthesised DNA molecules specific to the gene under investigation (oligonucleotide primers) are used to define the two ends of the region to be amplified, leading to the accumulation of a product of defined size which can later be resolved by gel electrophoresis and, if necessary, transferred to filter by Southern blotting for downstream analysis. PCR has been demonstrated to have many uses in the clinical environment, including: rapid and efficient amplification of bacterial or viral DNA gene sequences for detection of infection, blood typing, and identification of single base changes or other polymorphisms characteristic of genetic variation or a disease phenotype.26
While powerful in terms of detection, PCR methods are in general difficult to quantify with any real accuracy. Thus, while reverse transcriptase PCR (RT-PCR) is widely used to detect RNA in tissue or cell extracts, such data are often presented as “semi-quantitative”. To overcome these limitations, “real time” quantitative PCR was developed. This is based on the principle that quantitative detection of the PCR product at each round of the PCR cycle allows the investigator to plot a complete amplification curve for each reaction and thereby select the part of the PCR process where exponential amplification is being achieved. TaqMan is widely used for product detection. TaqMan uses a third oligonucleotide primer in the reaction mix which corresponds to sequence located between the two amplifying primers. This oligonucleotide carries a fluorescence tag at one end and a quenching tag at the other. During each PCR cycle the TaqMan probe anneals with the target sequence and is degraded as the DNA polymerase passes the annealed TaqMan probe thereby releasing the fluorescent tag which can be monitored. As well as offering considerably improved quantitation, automation of the detection process and the use of 96 well plate technology allows TaqMan real time PCR to be adapted to high throughput analysis which makes it especially useful for a clinical environment.
Fishing with chips: the rise of microarrays
Increased use of robotics in molecular biology has led to ways of planting far more genetic information in the form of cDNA or oligonucleotide sequences onto solid matrices than achievable before. Indeed, a complete cDNA library can now be gridded onto a single filter (called a gene array), rather than the dozen or so we might have expected to use five years ago. The move to miniaturisation is exemplified by the development of DNA microarrays, where DNAs or oligonucleotides are printed onto glass slides, allowing the simultaneous screening of many thousands of sequences in a single sample.27 This is an exciting development as in the last year a working draft of the human genome has been published which indicates that there are no more that 40 000 human genes making this a manageable figure. Microarray technology, variously referred to as microarrays, cDNA arrays, gene expression arrays, and gene chips, can usually detect changes in gene expression of twofold and above and can highlight single or global changes in gene expression arising from a pathological event or a developmental change. For example, Aitman and colleagues used microarrays as part of a strategy to identify genes implicated in human insulin resistance syndromes such as type 2 diabetes, combined hyperlipidaemia, and essential hypertension. Using a rat model for these diseases, the insulin resistant spontaneously hypertensive rat (SHR), a gene on rat chromosome 4 was identified encoding a fatty acid translocase which appears to underlie defects in fatty acid metabolism and hypertriglyceridaemia.28
DNA arrays work by the hybridisation of labelled DNA or RNA in solution to unique and specific DNA molecules gridded in an ordered pattern on a solid matrix such as a glass filter (microarray) or nylon membrane. When fluorescent labelled RNAs are used the output can be read as a false colour trace using computer imaging software. With several different fluorescent groups available, it is possible to label RNA pools representing different developmental points, or compare a pathological state with the normal one, and then hybridise these to a common array. The outputs can then be digitally superimposed and changes in the expression of individual genes recorded (fig 5). The gridded sequences are usually derived from the 3` non-coding regions of genes, cDNA and ESTs. There are now a number of commercially available platforms of “affinity matrix” systems available, including high density oligonucleotide arrays (GeneChips), representing up to 12 000 characterised genes and using glass as matrix and fluorescence for detection. In this system, in order to improve the noise-to-signal ratio and thereby improve RNA quantification, each gene is represented by 20 oligonucleotides (25–75 nt) of different sequence designed to hybridise to multiple regions of the same RNA molecule. Glass slide arrays are also available with PCR-amplified cDNAs (300–1000bp) attached. Nylon membranes, which use autoradiography for detection, are also used for the spotting of cDNA as probe but usually at a much lower density than that permissible on glass slides.

Schematic illustrating the stages involved in using DNA microarrays, highlighting the differences between oligonucleotide and cDNA arrays. In both procedures, total RNA is extracted from control and test samples (for example, normal and pathological) and converted to cDNA. For oligonucleotide microarrays the cDNA is then used as a template to generate fluorescently labelled complementary RNA (cRNA) by in vitro transcription. Control and experimental cRNA pools, labelled with the same dye, are hybridised to separate microarrays. After washing the arrays are scanned in order to create a quantitative fluorescence image where the signal intensity at each “gene probe” is proportional to the number of molecules attached (and hence abundance of that sequence in the original sample). Data from control and experimental samples are then compared, resulting in a cluster diagram where each column represents a single experiment and each row a single gene. Ratios of gene expression are shown relative to the control sample (illustrated): the scale ranges from red (maximal expression) to black (minimal expression). With cDNA arrays, the synthesised cDNA is first amplified and labelled through multiple rounds of cDNA synthesis and in vitro transcription, the two pools being labelled with different dyes—for example, Cy3 (green) and Cy5 (red). Equal quantities of each sample are mixed and hybridised to the same cDNA microarray, which is then scanned at two different wavelengths giving the relative abundance of Cy3 and Cy5 transcripts in each sample. The images are then overlaid (illustrated) and spots visualised as ratios of red and green (in this illustration a red spot indicates a gene more highly expressed in normal than pathological tissue) with yellow indicating equal expression.
For all DNA array analyses high quality RNA is essential, although the quantities required can range between 50 μg to 50 ng depending on the array used. Plentiful quantities of RNA can be easily extracted from in vitro cell culture systems or from large tissue samples. However, where cell numbers or tissue yield is limited—for example, if using clinical biopsies or cells obtained by laser capture microdissection—mRNA amplification is required. A major application for the use of arrays is the monitoring of gene expression (mRNA abundance). The collection of genes transcribed, sometimes referred to as the expression profile, within a given cell determines its cellular phenotype and function. Differences in gene expression profiles are responsible for both morphological and phenotypic differences and can be indicative of cellular responses to environmental stimuli. Knowing when, where, and to what extent a gene is expressed is pivotal to understanding the biological role of its encoded protein. A fundamental advantage of using arrays containing probes for thousands of different genes is that it provides a less biased view of cellular responses than a hypothesis based on the role of an isolated gene.
DNA arrays should not be viewed as replacements for the established techniques used for gene expression quantification such as northern blots or RT-PCR. Indeed, it is essential that individual results of array experiments are verified and apparent differences more accurately quantified using, for example, real time RT-PCR. Although constantly improving, there are still several limitations to their widespread use that need to be overcome, such as the cost of microarrays (most are single use) and data handling software, the number of genes identified and gridded, and the limited number of species for which arrays are available. Many of the filter based arrays and microarrays available “off-the-shelf” contain a plethora of well characterised genes from a variety of cell types. For investigators only interested in a particular tissue or cell type, such arrays are of limited use. For this reason companies are now offering custom made arrays containing specific sets of genes. Needless to say, these are not cheap. The more experienced laboratories are now producing their own custom made cDNA arrays. For example, in order to obtain a global picture of gene expression in the failing heart, Barrans and colleagues amplified by PCR 10 368 redundant sequenced expressed sequences from a number of human heart and artery cDNA libraries representing 4777 sequence verified transcripts from known genes, human EST database entries, and novel cardiac ESTs.29 The importance of monitoring a large number of genes has been illustrated by the molecular classification of cancer. Through the analysis of samples obtained from individuals with and without acute leukaemia or diffuse large B cell lymphoma, it was apparent that reliable tumour classification predictions could not be made on the basis of any single gene, but that predictions based on the expression levels of 50 genes (selected from the more than 6000 monitored on the arrays) were highly accurate.30
SUMMARY
Understanding the molecular mechanisms underlying how genes in the heart are expressed and how their expression may be modulated in response to external stimuli is now recognised as being an essential part of understanding how the heart develops, functions, and responds to pathological events. Such knowledge will lead to improved or new strategies for treating heart disease. Whereas the last decade has seen considerable advances in examining individual gene expression patterns, the new technologies now offer the ability to analyse global patterns of expression of many hundreds of genes. This will serve both as a methodology for identifying new genes involved in disease processes and in categorising global shifts in expression and hence general regulatory networks
GLOSSARY
Chromatin: DNA wrapped around a histone protein core at periodic intervals; the basic structure of the chromosome.
Clone: (noun), descriptive term in recombinant DNA terminology for any individual DNA sequence obtained through the process of cloning. (verb), to isolate a particular gene sequence of interest (genomic DNA or cDNA copy of mRNA) and to insert it, for example, into an artificial plasmid vector which can be introduced into bacterial cells where it will replicate within the bacterial cell, allowing unlimited amounts of the isolated sequence to be propagated from cells harbouring the plasmid. Other types of vector allow propagation and expression in yeast or mammalian cells.
Codon: Group of three nucleotides, whose sequence specifies a particular amino acid. The order in a continuous mRNA sequence reproduced from the gene thereby dictates the correct order of amino acids in the protein.
Complementary DNA (cDNA): A DNA copy of an RNA sequence, produced by the action of the enzyme reverse transcriptase.
Chromatin: DNA wrapped around a histone protein core at periodic intervals; the basic structure of the chromosome.
Cloning: various meanings include (1) inserting a DNA fragment of interest into a vector molecule, thereby generating a recombinant DNA molecule, which allows one to propagate that DNA fragment in bacteria; (2) isolating a new organism from a single somatic cell (for example, “Dolly” the cloned sheep).
Enhancer: DNA sequence capable of conferring a significant increase in gene transcription through its ability to bind cognate transcription factors. Enhancers are cis-acting but can function at distance from the gene promoter and are position and orientation independent.
Exons: Regions of a gene that are represented in the final mRNA molecule. Most, but not all, exons of a gene code for the protein.
GATA: Family of transcription factors utilising a zinc chelating protein “finger” structure to recognise and bind with high affinity to specific DNA sequences.
Gene expression: The process by which a gene is transcribed in the nucleus to give mRNA (transcription), from which protein is later produced in the cytoplasm by translation.
Homeobox: DNA binding motif comprised of three α helices, two of which are separated by a short, mobile peptide linker. Found in all homeodomain proteins, many of which are implicated in activating patterns of gene expression associated with patterning and other early development events.
Homology: Similarity resulting from being derived from a common ancestral gene. Often used (incorrectly) to refer simply to sequence similarity.
Hybridise: To use a (usually) radioactively labelled DNA or RNA single stranded molecule specific for one strand of a particular gene as a probe to find and bind to its immobilised, single stranded complement strand (usually presented within a pool of many unrelated sequences) in a liquid environment in which salt molarity and temperature direct the efficiency of the hybridisation process.
Introns: Regions of a gene that lie between exons and, unlike exons, are excluded from the final mRNA by the process of mRNA splicing.
MAP kinase: Mitogen activated protein kinase. Enzymes which modify proteins, especially transcription factors, by adding a phosphate group, resulting in altered activity. Three major MAPK subgroups have been identified: the extracellular signal regulated kinases (ERKs), the c-Jun N-terminal kinases/stress-activated protein kinases (JNK/SAPKs), and the p38 MAP kinases. Together with their upstream regulators (fig 2), MAP kinases represent one of the major signal systems used by eukaryotic cells to transduce extracellular signals into cellular responses.
Messenger RNA (mRNA): Produced by the process of transcription, mRNA is exported to the cytoplasm where protein is produced from it at the ribosome (translation).
Microarray: A solid matrix on which minute amounts of DNA sequences are imprinted robotically for analysis of differential gene expression using fluorescently labelled RNA probes.
Northern blot: Method of analysing mRNA expression using a nylon or nitrocellulose blot on which are immobilised electrophoretically separated RNA mixtures.
Nucleotide: Basic unit of nucleic acid consisting of one of four bases (adenine (A), guanine (G), cytosine (C) and thymine (T)—the four letter alphabet of DNA) coupled to sugar and phosphate groups.
Oligonucleotide: Short (for example 18–24 nucleotides) chemically synthesised single stranded DNA molecules. Used in PCR reactions and, when radiolabelled, as probes for Southern blots.
PCR: Polymerase chain reaction. Enzymatic method of synthesising multiple copies of a particular gene sequence by repeated cycles of thermal DNA denaturation and extension of gene specific oligonucleotide primers.
PolyA tail: A tract of adenylic acid residues attached post-splicing to the 3` end of all messenger RNAs. Useful for purifying mature mRNA by hybridising to solid matrices bearing poly-T tracts, or for serving as template for annealing of polyT primers before cDNA synthesis by reverse transcriptase.
Primer: Short single stranded DNA molecules, used to prime DNA synthesis from RNA (by reverse transcription) or DNA templates.
Probe: Generic term for a DNA or RNA molecule used to detect the presence of specific genes or their RNA products, whether by northern blot or hybridisation in situ.
Promoter: Region of DNA just upstream of the gene which is responsible for binding transcription factors and RNA polymerase in order to initiate gene transcription.
Reporter gene: Generic term for a vector containing a biologically measurable marker (for example, the Escherichia coli β-galactosidase gene LacZ or the firefly luciferase gene). By inserting an isolated promoter sequence in front of the reporter gene, the activity of that promoter can be followed once the vector has been introduced into cultured cells or a transgenic animal.
Reverse transcription: Process of making a cDNA copy of an RNA molecule; carried out by the retroviral enzyme reverse transcriptase.
RNA splicing: The process of removing intron-derived RNA sequences from the primary transcript to give mRNA.
Southern blot: Named after its inventor, a technique for transferring DNA to a solid membrane which can then be analysed by hybridisation with labelled probes specific to particular genes.
TAD: Transcription activation domain. A region of a transcription factor that has been experimentally determined to be essential for contributing to high levels of gene transcription once brought in close proximity to RNA polymerase by virtue of the factor binding to DNA.
Transgenic: Refers to the transference of foreign DNA into the germline of a host (transgenic) animal.
Transcription: The production of a primary RNA transcript by RNA polymerase from a gene.
Transcription factors: DNA-binding proteins which bind to gene promoters or enhancers and interact with RNA polymerase to alter the overall rate of gene transcription.
Translation: The production of protein from a mRNA template at the ribosome.
Western blot: Electrophoretic method of transferring proteins, separated by molecular weight on a polyacrylamide gel matrix, to a solid filter. Filters are then probed with a specific antibody to detect proteins under investigation.
Myocardial molecular biology: key points
-
Transcription (RNA synthesis) plays a significant role in regulating gene expression
-
Interactions between transcription factors bound to DNA directs cardiac specific gene expression
-
RNA splicing increases the diversity of proteins that can be produced from a single gene
-
A variety of techniques are available for monitoring RNA and protein expression
-
Some techniques allow quantification—for example, real time polymerase chain reaction
-
Modern techniques are aimed at identifying global patterns of expression involved in disease (for example, gene chip analysis) rather than studying individual genes
Acknowledgments
PJRB is a Senior Research Fellow of the British Heart Foundation. We are grateful to our colleagues Dr Kim Dellow and Dr Pank Bhavsar for their support and comments during the preparation of this manuscript.
REFERENCES
Linked Articles
- Miscellanea
- Miscellanea