Article Text

Abstract
Objective Heart failure with preserved ejection fraction (HFpEF) is a heterogeneous syndrome. We aimed to derive HFpEF phenotype-based groups ('phenogroups') based on clinical and echocardiogram data using machine learning, and to compare clinical characteristics, proteomics and outcomes across the phenogroups.
Methods We applied model-based clustering to 32 echocardiogram and 11 clinical and laboratory variables collected in stable condition from 320 HFpEF outpatients in the Karolinska-Rennes cohort study (56% female, median 78 years (IQR: 71–83)). Baseline proteomics and the composite end point of all-cause mortality or heart failure (HF) hospitalisation were used in secondary analyses.
Results We identified six phenogroups, for which significant differences in the prevalence of concomitant atrial fibrillation (AF), anaemia and kidney disease were observed (p<0.05). Fifteen out of 86 plasma proteins differed between phenogroups (false discovery rate, FDR<0.05), including biomarkers of HF, AF and kidney function. The composite end point was significantly different between phenogroups (log-rank p<0.001), at short-term (100 days), mid-term (18 months) and longer-term follow-up (1000 days). Phenogroup 2 was older, with poorer diastolic and right ventricular function and higher burden of risk factors as AF (85%), hypertension (83%) and chronic obstructive pulmonary disease (30%). In this group a third experienced the primary outcome to 100 days, and two-thirds to 18 months (HR (95% CI) versus phenogroups 1, 3, 4, 5, 6: 1.5 (0.8–2.9); 5.7 (2.6–12.8); 2.9 (1.5–5.6); 2.7 (1.6–4.6); 2.1 (1.2–3.9)).
Conclusions Using machine learning we identified distinct HFpEF phenogroups with differential characteristics and outcomes, as well as differential levels of inflammatory and cardiovascular proteins.
- heart failure with preserved ejection fraction
- ECG/electrocardiogram
Statistics from Altmetric.com
Introduction
Heart failure (HF) is a growing public health pandemic, with HF with preserved ejection fraction (HFpEF, defined as left ventricular ejection fraction (LVEF) ≥45%–50%1) constituting up to half of the HF population and increasing.2 The HFpEF syndrome is multifactorial and heterogeneous with regards to clinical characteristics and prognosis, and the aetiology and pathophysiology of the disease are still poorly understood.3 In addition, the heterogeneity of the disease poses significant challenges to drug development and clinical trial design and HFpEF trials to date have failed.4–6
In HFpEF, both cardiovascular and non-cardiovascular comorbidities are common and thought to contribute to disease progression and adverse outcomes.7–9 One model posits that age and comorbidities may contribute to systemic inflammation, resulting in coronary microvascular endothelial dysfunction and inducing cardiomyocyte and interstitial changes and impaired relaxation and increased stiffness.10 11
Unsupervised clustering for the identification of patient subpopulations have been successfully applied in other diseases such as cancer12 13 and diabetes.14 While clinical translation to date has been limited, tests for risk stratification in breast cancer (using the PAM50 panel) are the results of such efforts. In HF, two previous studies suggest that clustering of patients with HFpEF based on clinical data and biochemical data can reveal subgroups of patients at greater risk of clinical end points.15 16 These data warrant replication in European HF populations. In addition, previous studies have not investigated biomarkers across patient clusters beyond traditional routine chemistry. Therefore, we aimed to (1) Cluster patients with HFpEF in the multicentre Karolinska-Rennes (KaRen) Study based on a wide range of clinical information including clinical, laboratory and echocardiogram (echo) characteristics using unsupervised machine learning approaches. (2) Identify proteomic correlates of the phenotype-based groups (from now on referred to as phenogroups). (3) Assess associations between phenogroups and outcomes. (4) Optimise a model for phenotyping of new patients.
Methods
Study participants and design
The KaRen Study, a prospective observational multicentre cohort study, and baseline characteristics of patients have previously been described.17 The study conformed to the Declaration of Helsinki, and all patients provided written informed consent. Patients and the public were not involved in the design, conduct, reporting or dissemination of this research. The study enrolled patients with HFpEF (n=539) with acute HF, LVEF ≥45% and elevated natriuretic peptides (NT-proBNP >300 ng/L or BNP >100 ng/L). At outpatient follow-up in stable state (4–8 weeks after hospitalisation), 98 clinical parameters (routine clinical and laboratory variables and detailed echo (n=320)) and cardiovascular plasma proteins (available in the Karen proteomics substudy,18 n=76) were assessed. Echo data were collected as previously described (details in online supplementary methods).19 The measurement of proteins has previously been described.18 Briefly, a total of 92 plasma proteins were measured using the Olink ProSeek Cardiovascular I (CVD I) panel at Olink Proteomics (Uppsala, Sweden). Following quality control 86 proteins remained for analyses (details in online supplementary methods). Patients were followed for the composite end point of time to all-cause mortality and HF hospitalisation. Meta‐analysis Global Group in Chronic Heart Failure (MAGGIC) Risk Score of patients were constructed as in Pocock et al, 2013.20
Supplemental material
Phenotype-based clustering of patients with HFpEF
To identify HFpEF phenogroups we applied clustering to data from patients in the KaRen Study. Quantitative biomarkers (echo, routine clinical and laboratory variables; online supplementary table S1) remaining after preprocessing steps to remove variables with high missingness (≥30%) and highly correlated variables (details in online supplementary methods) were included in clustering. Model-based clustering of standardised variables (mean=0, SD=1) was performed in R using the Mclust function in the mclust package,21 with default settings, and the optimal model and number of clusters determined by the maximum Bayesian Information Criteria. Comorbidities and additional variables were used to characterise the resulting phenogroups (online supplementary tables S3-6 and visualised in figure 1, online supplementary figures S1-3). This approach is analogous to previous work by Shah et al 15 (further information in online supplementary methods). To evaluate if detailed echo can provide fine-mapping of patients beyond routinely collected clinical and laboratory parameters and to provide a more balanced stratification of patients, we clustered patients separately on (1) Clinical and laboratory variables. (2) Echo variables, from which composite phenogroups were constructed.
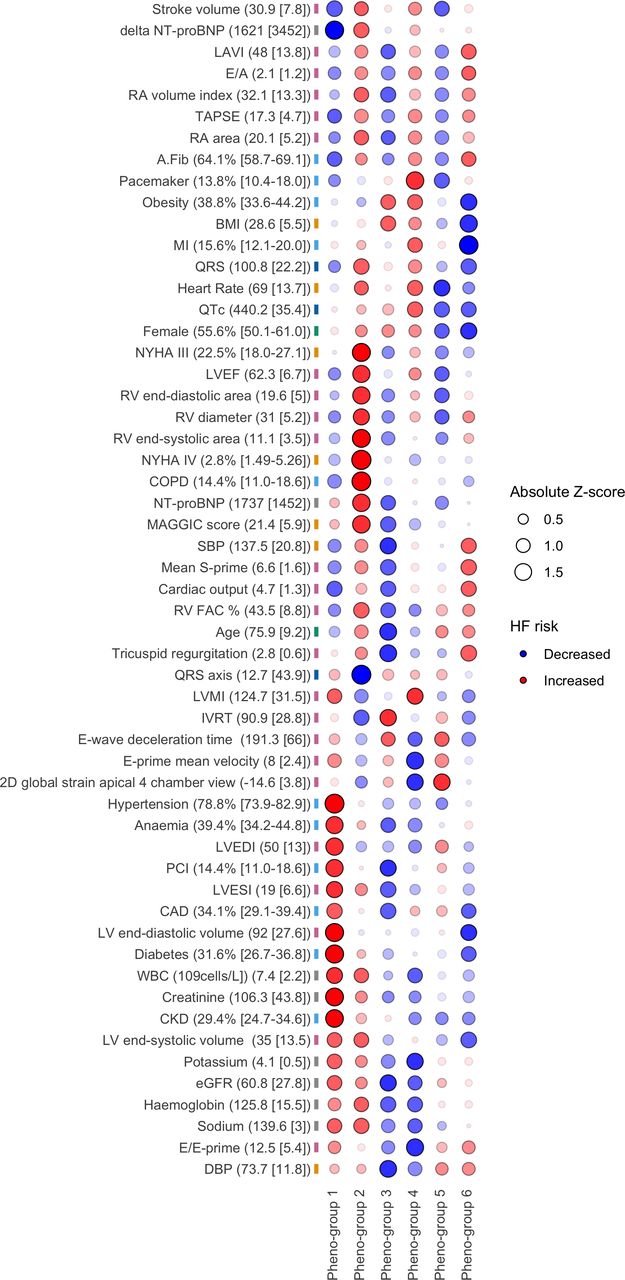
Visualisation of descriptive characteristics of patients in phenogroups. Phenotypes contained within online supplementary tables S3-4 are listed on y-axis and the six phenogroups are listed on the x-axis visualised in the plot. Pre z-scores for each phenotype based on either phenogroup means (for continuous variables) or proportions (for categorical variables). Bullets are sized by the absolute z-score, and coloured according to a priori knowledge on HF with red (increase) representing more severe HF and/or worse prognosis according to a priori knowledge, and blue (decrease) representing the opposite, with α levels reflecting the absolute deviation from the mean, to highlight stronger deviations. For clarity, where both low and high values may lead to increase in HF risk (eg, BMI) we have opted to only indicate higher values in red in the figure. For each variable label the population mean and SD or the percentage with 95% CIs are included as a reference. Phenotypes are ordered based on hierarchical clustering, to better display patterns relating to phenogroup differences and similarities. A.Fib atrial fibrillation; BMI, body mass index, CAD, coronary artery disease; COPD, chronic obstructive pulmonary disease; CKD, chronic kidney disease; DBP diastolic blood pressure; E/A ratio of mitral peak velocity of early filling to mitral peak velocity of late filling; E/E-prime ratio of mitral peak velocity of early filling to early diastolic mitral annular velocity; eGFR estimated glomerular filtration rate; FAC fractional area change; HF heart failure; IVRT isovolumic relaxation time; LAVI left atrial volume index; LVEDI left ventricular end-diastolic volume index; LVEF, left ventricular ejection fraction; LVESI left ventricular end-systolic volume index; LVMI left ventricular mass index; MAGGIC, Meta‐analysis Global Group in Chronic Heart Failure; MI, myocardial infarction; NYHA, New York Heart Association; PCI percutaneous coronary intervention; RA right atrial; RV right ventricular; SBP systolic blood pressure; TAPSE tricuspid annular plane systolic excursion; WBC white blood cells.
Associations of clinical, laboratory, echo and proteomic parameters with pheno-groups
Differences in patient characteristics between the phenogroups were tested using analysis of variance (F-test) for continuous traits and Fisher's exact tests22 for categorical traits. For plasma proteins, models were additionally adjusted for age, sex and mean protein level per individual, to control for protein differences related to these rather than phenogroup, and significance was determined using FDR (further details in online supplementary methods).
Associations with the composite outcome
Cox proportional hazards models were fitted to investigate the association between phenogroups and time-to-event (composite end point), using the coxph function in the R package survival. Kaplan-Meier curves were constructed using the survminer package in R. We examined differential outcome at an early (within 100 days), mid-range (18 months) and long-term (1000 days) follow-up time point.
Assigning patients to phenogroups
Classifiers were built on the standardised clinical variables used in clustering for assigning patients with HFpEF to phenogroups, evaluating three multinomial classification methods (Elastic Net, Neural Networks and Naive Bayes, in the R package caret23). A nested cross-validation procedure (repeated five times) was used to avoid overfitting, in which four-fifths of the samples (‘training set’) were used in optimisation of model parameters (using 10-fold cross-validation), and a fifth of the samples (‘test set’) were used in assessing prediction performance (further details in online supplementary methods). Prediction performance was assessed as the ability of the model to predict samples in the test set to the correct phenogroup (by multiclass AUC (Area under the ROC Curve)). In the final model (Elastic Net) optimisation of model parameters was performed on all data. Furthermore, we validated the performance of the complete procedure: clustering patients to derive phenogroups; training an Elastic Net model for assigning new patients to phenogroups; and assessing the difference in the composite outcome between the newly assigned phenogroups (further details in online supplementary methods).
Results
Phenotype-based clustering of patients with HFpEF in the Karen Study
We identified three clusters based on 32 echo variables and two clusters based on 11 laboratory and routine clinical variables, respectively (further details in online supplementary results), from which six composite phenogroups were derived. We found distinct differences in comorbidities (with significant difference in prevalence of atrial fibrillation (AF), chronic kidney disease (CKD) and anaemia (p<0.001)), clinical and laboratory variables, and cardiac structure across phenogroups, and common features shared across all phenogroups (online supplementary tables S3-6 and visualised in figure 1, online supplementary figures S1-3). The six phenogroups revealed some distinct and some inconsistent patterns that may be generalised as in table 1, which also shows the corresponding event rates (more details in the outcomes section).
Clinical interpretation and generalised characterisation of the six phenogroups
Two phenogroups (5 and 6) were consistent with the older female patient with HFpEF common in clinical practise, where one had more hypertension (80%) and AF (96%) and lower body mass index (BMI) (mean=27±5), and the other more coronary artery disease (CAD, 40%) and left-sided functional changes (online supplementary table S6). Phenogroup 2 had distinctly more severe HF, with the greatest degree of diastolic dysfunction (at least 30% of patients with a grade II or higher) and the worst right ventricular function, and the highest event rates. Although phenogroup 1 was younger, it also had more cardiovascular risk factors; more left-sided changes and had progressed to CKD (67%), and had the second highest event rates. Phenogroup 4 was male but otherwise similar to the female groups 5 and 6, with hypertension (75%), left atrial enlargement and AF (90%). Furthermore, this group had the largest proportion of pacemakers (25%) and previous myocardial infarction (MI, 21%), indicating ischaemic aetiology of HF. Finally, phenogroup 3 had mild HF and low risk, and HF symptoms may be explained by obesity (48%) and deconditioning, and may be similar to the types of patients included in HFpEF trials, that is, younger, milder HF (or even absent HF) and distinctly lower event rates, which may also explain the failure to demonstrate a treatment effect in these trials. Some unexpected or inconsistent findings include the relatively high LVEF (mean=63%) in group 1 given the extent of left ventricular remodelling, the distinctly high prevalence of chronic obstructive pulmonary disease (COPD, 30%) in group 2, which also had the worst HF status, and the less than expected CKD (45%) in group 2, given the extent of RV and presumably backward failure.
Comparing the prognostic HF marker NT-proBNP across phenogroups we found the highest levels at initial hospitalisation for patients in phenogroup 2, and their NT-proBNP levels remained high at the follow-up visit (online supplementary figure S4, online supplementary table S3), in line with the highest proportion of patients in New York Heart Association class IV and poorer prognosis in these patients.
Differential proteomics profiles across phenogroups
Using targeted plasma protein data in a subset of Swedish KaRen patients (n=76 (6; 5; 24; 21; 17; 3 in the phenogroups, respectively)), we compared protein profiles across phenogroups observing significant differences in levels of 15 out of 86 proteins (FDR<0.05, table 2). Levels of these 15 proteins (after adjustments) across phenogroups are shown in online supplementary figure S5. In agreement with phenogroup characteristics, phenogroup 1 had the highest levels of proteins previously positively associated with CKD and HF incidence (FGF-23, PlGF, TRAIL-R2, U-PAR, online supplementary table S7), whereas HF-specific soluble ST2 (sST2) was highest in phenogroup 2, with the most severe HF. In addition, 10 of the proteins (including sST2) were directly associated with phenotypical variables and comorbidities (online supplementary results).
Plasma proteins differentially expressed between heart failure with preserved ejection fraction (HFpEF) phenogroups (false discovery rate, FDR<0.05). The adjusted protein levels across the phenogroups are shown in online supplementary figure S5

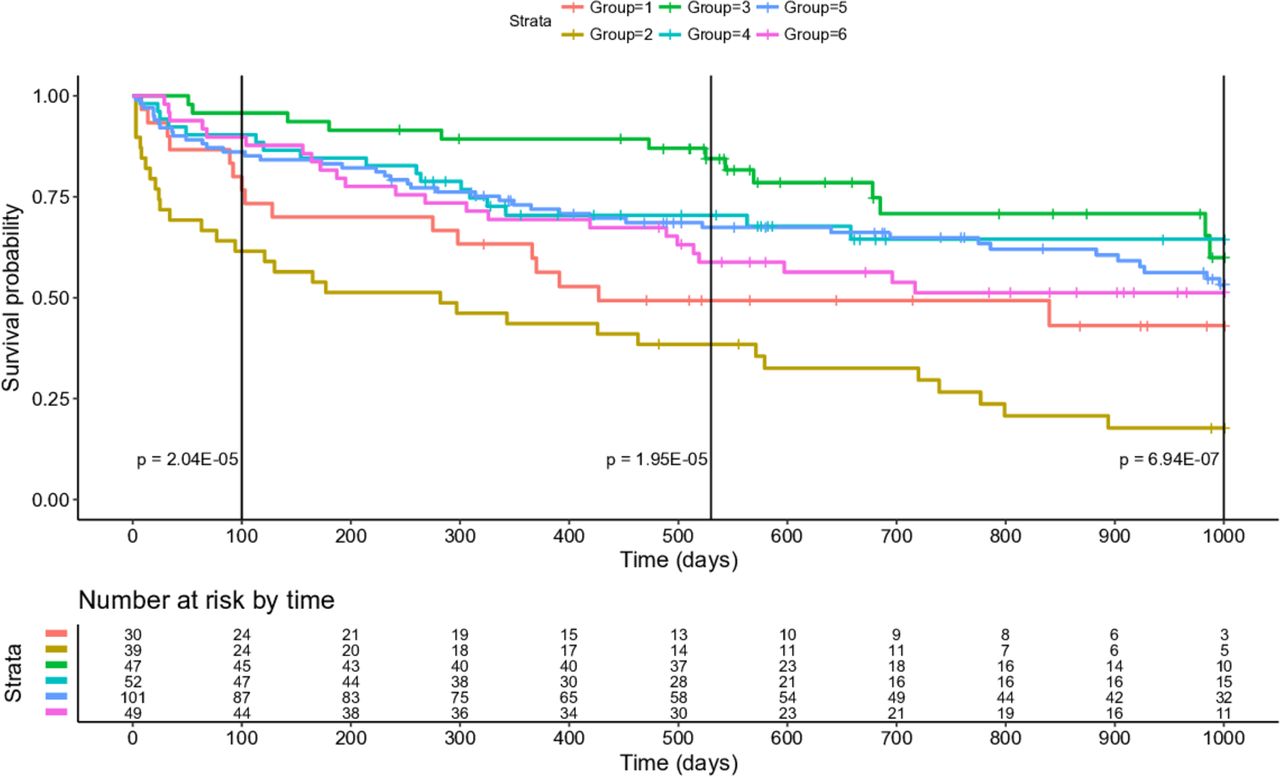
Kaplan-Meier curves of composite end points during 1000 days of follow-up from stable condition for phenogroups. The log rank p values for the composite end point at an early time point (100 days) and a mid-range time point (18 months) are also shown.
Differential composite end point between phenogroups
The incidence rate of the composite end point was significantly different (log rank p<0.001) between the phenogroups to the 18 months follow-up, with phenogroup 2 having the highest and phenogroup 3 having the lowest event rates (figure 2, online supplementary table S9). There was also a significant difference at the short-term (at 100 days) and at the longer-term follow-up (at 1000 days). Notably, 39% of patients in phenogroup 2 had an event already at 100 days. Investigating associations with the composite end point using Cox proportional hazards models, phenogroup 2 was 83% more likely than phenogroup 3 to have an event to 18 months (HR 5.73 (95% CI 2.57 to 12.77), p<0.001; online supplementary table S10). Higher risk for phenogroup 2 at 18 months (p<0.001) was also observed in comparison with phenogroup 5 (HR=2.69 (95% CI 1.58 to 4.57)).
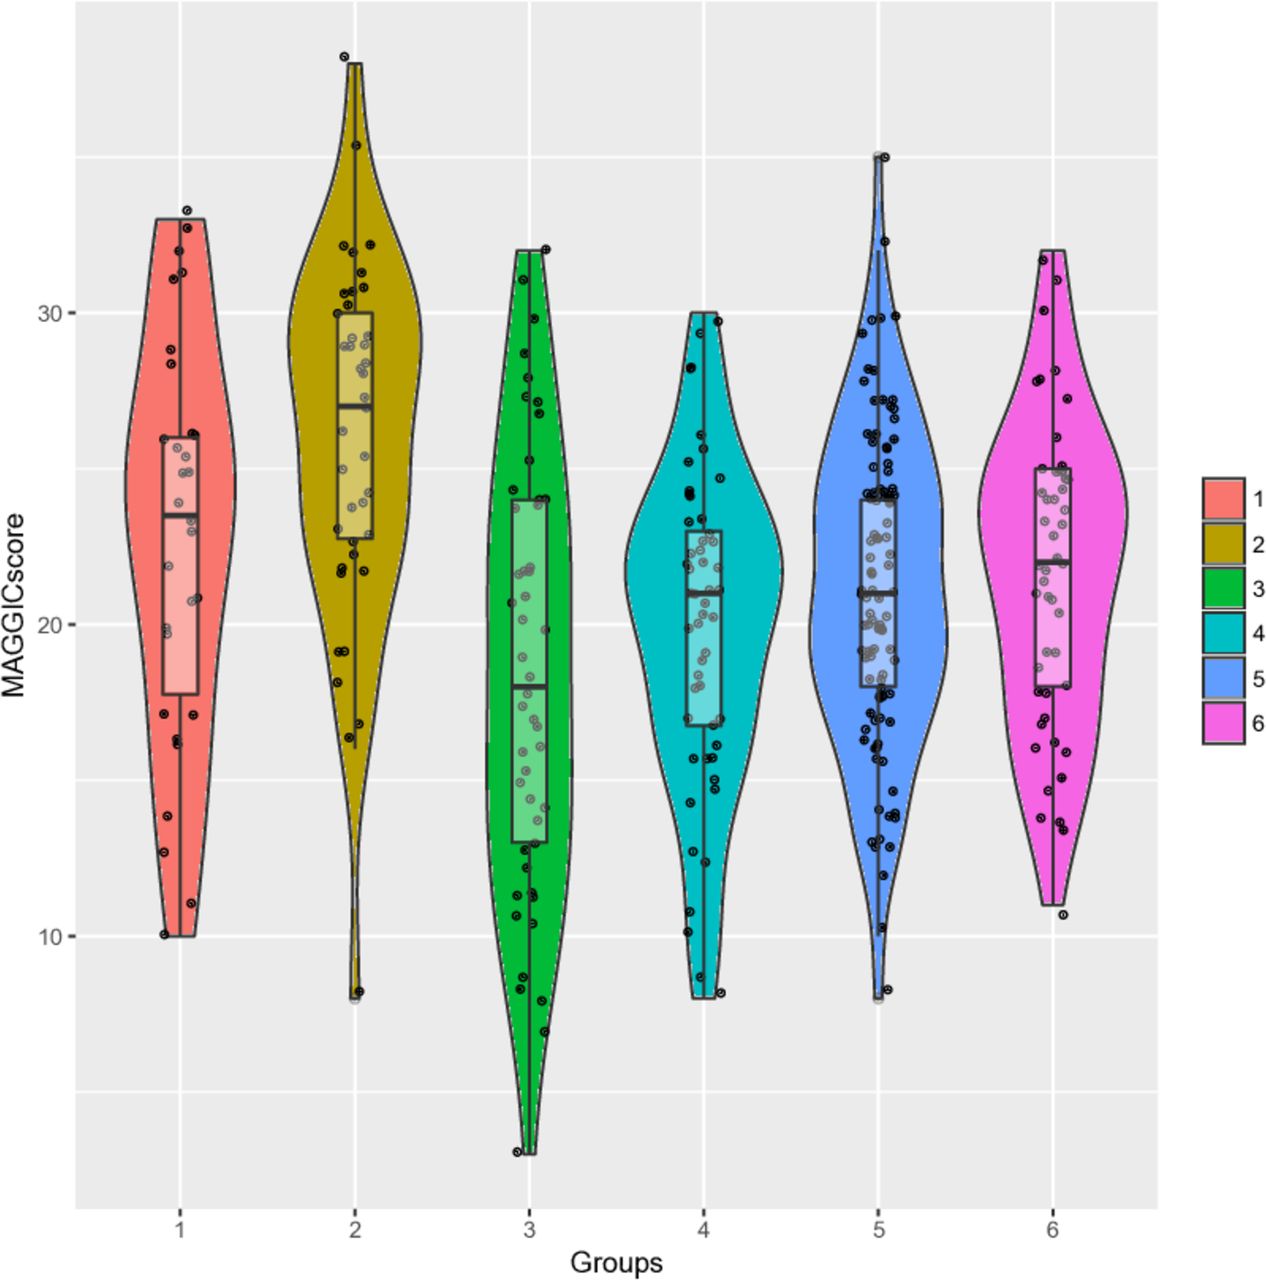
In line with these findings, the MAGGIC Score, an established mortality risk score for patients with HF,24 was significantly different across phenogroups (p<0.001; figure 3). Higher MAGGIC Score, predicting increased risk of 3-year mortality, correlated with belonging to phenogroups with the highest event rate, with patients in phenogroup 2 having the highest average score and risk, and phenogroup 3 the lowest.
Violin plots of Meta‐analysis Global Group in Chronic Heart Failure (MAGGIC) Scores of patients in phenogroups. Significant differences in MAGGIC Score, an established mortality risk score for patients with heart failure (HF) predicting 3-year mortality, were observed between phenogroups (overall p=3.1×10–08), with patients in phenogroups with the most events having higher MAGGIC Score. A mean MAGGIC Score of 26, as observed for phenogroup 2, corresponds to an approximate 50% risk of 3-year mortality (Sartipy et al [24]).
Assigning patients into phenogroups
We assessed how well we could assign patients into phenogroups, using multinomial classifiers trained on the same clinical variables as used in the clustering. To avoid overfitting, while optimising the models, we used a nested cross-validation procedure. The best performance was observed for the Elastic Net model, with an average multiclass AUC of 0.79 (online supplementary figure S7, online supplementary table S11), indicating reasonable prediction performance across phenogroups. In the final model on all individuals (multinomial Elastic Net) we found a number of important predictors for falling into each of the phenogroups (online supplementary figure S8, online supplementary table S12). Variables with the largest coefficients in the overall model included E/A ratio, NT-proBNP, sodium, creatinine and haemoglobin, diastolic blood pressure, heart rate and body surface area. Finally, we validated the performance of the complete procedure, that is, clustering patients to derive phenogroups, training an Elastic Net model for assigning new patients to phenogroups, and assessing the difference in the composite outcome between the newly assigned phenogroups (online supplementary methods). Averaged over all trial splits (50:50 patients), we could detect phenogroups, reliably assign new patients to these phenogroups and show a differential composite outcome significantly different from random (online supplementary figure S9, supplementary results).
Discussion
In this study we identify phenotypically distinct groups of patients with HFpEF, with characteristics indicating differential burden of comorbidities, severity of disease and outcomes. We also demonstrate the association of phenogroups with differential levels of 15 inflammatory and cardiovascular proteins. Furthermore, we optimise a model (using the same phenotypical variables as in clustering) for categorisation of patients into these phenogroups, which may also be used to assign new patients into the stratified groups, given the same phenotype variables. Using this model we also validate the complete clustering procedure, using random resampling of patients, showing good reproducibility. Our work confirms the feasibility of phenotyping of patients with HFpEF via statistical machine learning15 16 and extends the findings of published literature by exploring this in a deeply phenotyped European population as well as correlating phenogroups to inflammatory and cardiovascular proteomics.
HFpEF phenogroups
A wide range of characteristics were significantly different between phenogroups, and we note that, for example, AF, kidney dysfunction, anaemia, age, sex, cardiac structural and functional alterations seem to be important in substratifying patients with HFpEF. The same comorbidities and demographics also showed differences across subgroups in previous studies, identifying three groups (applying model-based clustering to 46 continuous variables15) and six groups (applying latent class analysis to 11 categorical variables16), respectively. However, in our study of European patients with HFpEF we did not observe a phenogroup of obese patients (as previously found in an US setting15). This most likely reflects the difference in prevalence of obesity and morbid obesity between these populations.25 While we did not specifically seek to separate patients on outcome, our analysis indicated that clustering based on baseline characteristics only identified clusters with distinctly different rates of the composite end points for the phenogroups, suggesting that clustering can be used prospectively to estimate event rates, for example, in trial design. The two phenogroups that fared the worst during follow-up had different comorbidities and clinical phenotypical profile: (phenogroup 1) all with a history of hypertension, with the highest prevalence of any groups of CAD, kidney dysfunction, anaemia and diabetes, consistent with primary myocardial dysfunction and at least in part forward failure, and more resemblance to HFrEF; and (phenogroup 2) most with AF, high prevalence of COPD, old age, kidney dysfunction, anaemia, increased evidence of diastolic dysfunction and right ventricular dysfunction, consistent with a more distinct HFpEF and backward failure phenotype. We have previously demonstrated many of these phenotypes (including AF and flutter, age and anaemia) to be predictors of the composite end point in the KaRen Study population.7 On the other hand, phenogroup 3 with the least severe HF, were younger, obese, with high blood pressure but with low prevalence of anaemia and advanced kidney dysfunction, and less cardiac structural and functional alterations. Although study population and analytical strategy differed, phenogroups 1 and 2 shared characteristics with the subgroups that fared the worst in a previous larger study:16 phenogroup 1 (diabetes, anaemia and kidney dysfunction, but not obesity; subgroup C) and phenogroup 2 (old age, AF, kidney dysfunction, anaemia; subgroup F). Furthermore, characteristics such as RV remodelling and dysfunction, old age, AF and CKD were observed for the group with the highest event rates here and in a previous similarly conducted study in an US population.15 This suggests that the groups derived using clustering may in part be reproducible across methods and populations.
Protein correlates of phenogroups
In addition to clinical and laboratory differences of phenogroups we also found 15 plasma proteins at differential levels across groups, including sST2 and BNP, markers of HF severity or prognosis.26 27 Soluble ST2 had the highest mean level in phenogroup 2, consistent with the poor outcome of these patients, and lowest in phenogroup 3, with the least severe HF. Nine of the 15 proteins with differential levels across phenogroups have previously been associated with HF and comorbidities in independent data sets using the same proximity eThese trials have relied only on signsxtension assay proteomics chip (online supplementary table S7), and an additional two proteins in previous work on partly the same patients with HFpEF as in this study,18 lending support to the importance of these proteins in HF disease processes. Of these FGF-23, PlGF, NEMO, sST2, TRAIL-R2, U-PAR have previously been associated with HF incidence and HFpEF,28 29 and all, except NEMO and sST2, have also been associated with CKD or kidney dysfunction.30 FGF-23 and U-PAR have also been associated with incident AF.31 Further evidence indicates the importance of some of the associated proteins in HF. NEMO (NF-κ-B essential modulator), found at highest levels in phenogroups 3 and 5, has been suggested to be important in cardiac function, as disruption in mice leads to a HF phenotype.32 Levels of ESM-1, with the strongest association to phenogroups of any of the proteins, has previously been negatively associated with BMI and insulin resistance.33 34 Further evidence supports a role for this protein as a marker of endothelial dysfunction (upregulated in acute MI, CKD and hypertension35), which is also consistent with a purported model of global inflammation driving microvascular endothelial dysfunction in HFpEF.10 11 Furthermore, lower levels of both FGF-23 and TRAIL-R2 were recently found to associate with resilience against new cardiovascular events in a cohort of patients with stable CAD.36 These two protein markers were found at the highest levels in the two highest-risk groups in our study.
Assigning patients into phenogroups
We developed a model for assigning patients to phenogroups, which may also be used to assign new patients into the stratified groups, given the same variables. Results of this analysis also indicated the relative importance of the phenotypes (predictors) in stratifying the patients with HFpEF. Using the method of assigning new patients into phenogroups we also validated the complete clustering procedure showing that using only half the patients for detecting phenogroups and assessing outcome differences we could reliably assign new patients into phenogroups of differential outcome increasing our confidence in the robustness of the complete procedure of deriving phenogroups. This finding increases our confidence that the detected phenogroups and outcome differences will hold up in populations similar to the KaRen cohort studied here.
Potential clinical implications
To date there is no evidence-based therapy for HFpEF. HFpEF is a heterogeneous syndrome, thought to be driven by a range of comorbidities, and the diversity of patients may partly explain the failure to demonstrate clinical efficacy in randomised control trials of ACE inhibitors, angiotensin receptor blockers and spironolactone. These trials have relied only on signs and symptoms of HF, which are non-specific for HF and poorly correlated with outcomes. Newly updated stricter criteria for diagnosis of HFpEF may lead to a more well defined HFpEF phenotype,1 mitigating some of these problems, however, further categorisation of patients into well-defined phenogroups with diverse characteristics and event rates may be useful in study design and when investigating novel intervention strategies in HFpEF.
Strengths and limitations
The main strengths of this study include the well-phenotyped patient population from two countries with long-term follow-up of disease outcome with the inclusion of proteomics data on a subset of individuals that help us to draw conclusions regarding molecular correlates of the phenogroups. This study also has some limitations. First, we acknowledge that the most important limitations are the small number of patients (n=320) and the lack of external validation of the phenogroups, making generalisability to the general HFpEF population uncertain. We provide a prediction model, which, assuming the study has the same clinical phenotypes, may be used to assign patients into the same phenogroups of patients with HFpEF. We aim to validate this in further studies, and in addition, this prediction model may be used to validate the results in this study by other researchers. Second, proteomics data were only available for a subset of patients, all Swedish. We assume, but cannot confirm, that the conclusions would also apply to other patients within the same phenogroup.
In conclusion, in this study we identify distinct subgroupings of patients with HFpEF in a deeply phenotyped European study using statistical machine learning, extending previous knowledge on HFpEF subtypes. Adding to previous work, we also integrate our results with protein biomarkers, providing evidence of differential levels of cardiovascular biomarkers relating to HF, AF and kidney function between phenogroups. Categorisation of patients into well-defined phenogroups with diverse characteristics and event rates may be useful in study design and when investigating novel intervention strategies in HFpEF.
Key questions
What is already known on this subject?
HFpEF is a heterogeneous syndrome, however previous studies indicate that clustering of patients with HFpEF based on clinical data and biochemical data can reveal subgroups of patients at greater risk of clinical end points.
What might this study add?
In this study we apply this approach to a well-defined European population and in addition use plasma proteomics on these patients to define molecular patterns of the newly defined HFpEF phenogroups.
How might this impact on clinical practice?
Categorisation of patients with HFpEF into well-defined phenogroups with diverse characteristics and event rates may be useful in future interventional trial design and when investigating novel intervention strategies in HFpEF.
Acknowledgments
The authors thank the cohort participants and team members who contributed to these studies.
References
Footnotes
Twitter @twitganglion, @HFpEF
AM, DZ and LL contributed equally.
Contributors ÅKH, AM, DZ and LL conceived and designed the study. ÅKH performed statistical analyses and wrote the manuscript with contributions from LL, AM and DZ. AM, DZ and LL supervised the project. ED, J-CD, LL, CH, CML performed or supervised clinical data collection and phenotyping. L-MG provided proteomic profiling. SJS, MJB and LB provided technical and clinical contribution as well as discussion. All authors read, provided feedback and approved the final manuscript.
Funding This study was funded in part by grants 20120321 and 20150557 from the Swedish Heart-Lung Foundation, grants 2013-23897-104604-23 and 523-2014-2336 from the Swedish Research Council and 20140220 from Stockholm County council to LL; and from Medtronic to the French Heart Foundation. CML received funding from the Heart-Lung-foundation.
Competing interests ÅKH, AS, MJB, LB, AM and DZ are (or were during the duration of the study) employees of Pfizer. L-MG is an employee of Astra Zeneca.
Patient consent for publication Not required.
Ethics approval Approved by local ethics committees in Sweden and France; Karolinska Institute Sweden, Dnr: 2007/388- 31/2 Studietitel: KaRen Karolinska – Rennes forskningsstudie om hjärtsvikt med bevarad systolisk vänsterkammarfunktion.
Provenance and peer review Not commissioned; externally peer reviewed.