Article Text

Abstract
Objectives To examine service provision in cardiovascular magnetic resonance (CMR) in the UK. Equitable access to diagnostic imaging is important in healthcare. CMR is widely available in the UK, but there may be regional variations.
Methods An electronic survey was sent by the British Society of CMR to the service leads of all CMR units in the UK in 2019 requesting data from 2017 and 2018. Responses were analysed by region and interpreted alongside population statistics.
Results The survey response rate was 100% (82 units). 100 386 clinical scans were performed in 2017 and 114 967 in 2018 (15% 1-year increase; 5-fold 10-year increase compared with 2008 data). In 2018, there were 1731 CMR scans/million population overall, with significant regional variation, for example, 4256 scans/million in London vs 396 scans/million in Wales. Median number of clinical scans per unit was 780, IQR 373–1951, range 98–10 000, with wide variation in mean waiting times (median 41 days, IQR 30–49, range 5–180); median 25 days in London vs 180 days in Northern Ireland). Twenty-five units (30%) reported mean elective waiting times in excess of 6 weeks, and 8 (10%) ≥3 months. There were 351 consultants reporting CMR, of whom 230 (66%) were cardiologists and 121 (34%) radiologists; 81% of units offered a CMR service for patients with pacemakers and defibrillators.
Conclusions This survey provides a unique, contemporary insight into national CMR delivery with 100% centre engagement. The 10-year growth in CMR usage at fivefold has been remarkable but heterogeneous across the UK, with some regions still reporting low usage or long waiting times which may be of clinical concern.
- magnetic resonance imaging
- delivery of health care
- health care economics and organizations
Data availability statement
All data relevant to the study are included in the article or uploaded as supplemental information.
This is an open access article distributed in accordance with the Creative Commons Attribution Non Commercial (CC BY-NC 4.0) license, which permits others to distribute, remix, adapt, build upon this work non-commercially, and license their derivative works on different terms, provided the original work is properly cited, appropriate credit is given, any changes made indicated, and the use is non-commercial. See: http://creativecommons.org/licenses/by-nc/4.0/.
Statistics from Altmetric.com
Introduction
Cardiovascular magnetic resonance (CMR) is an advanced cross-sectional imaging technique and the reference standard for assessment of left ventricular (LV) and right ventricular (RV) volumes and function.1 It has a wide variety of clinical applications including coronary artery disease, cardiomyopathy, heart failure, aortopathy, valvular and congenital heart disease.2 In international guidelines, the American College of Cardiology Appropriate Use Criteria Task Force, with other allied bodies, have deemed CMR as appropriate in the assessment of complex congenital heart disease,3 stable ischaemic heart disease,4 heart failure, cardiomyopathy, pericardial disease, cardiac masses, aortic disease, cardiac sarcoidosis and cardiac amyloidosis,5 and in more challenging cases of regurgitant valvular heart disease.6 In the European Society of Cardiology guidelines on chronic coronary syndromes, non-invasive functional imaging including CMR stress perfusion has a class I indication in the initial diagnostic management of symptomatic patients with suspected and known coronary artery disease.7 In heart failure guidelines, it has a class IIa indication for the assessment of dilated cardiomyopathy and a class I indication in patients with poor echo windows and in patients with certain suspected aetiologies of heart failure such as myocarditis, sarcoidosis and amyloidosis.8
Despite several class I and class II recommendations in the guidelines, there are wide variations nationally and internationally in terms of access to CMR, with availability remaining a major barrier to more widespread use of this technology. The funding of CMR in the UK is complex with different models in England, Northern Ireland, Scotland and Wales. Scanners may be purchased by the National Health Service (NHS) or private hospitals, or by universities, or with charitable funds, and within the NHS running costs may be reimbursed either by local or national commissioners of heathcare.
The British Society of CMR (BSCMR; www.bscmr.org) has periodically surveyed CMR units in the UK. Two previous surveys have been published in 2011 (2008–2010 data) and 2014 (2013 data; abstract only).9 10 The current survey sought to examine CMR growth over a 10-year time horizon, and to assess regional variation and other characteristics of CMR units in the UK. A similar study has recently been performed looking at the provision of cardiac CT in the UK,11 as has a further study looking more generally at cardiac imaging provision.12
Methods
Board members of the BSCMR identified all CMR units in the UK. In the case of England they reviewed all 223 NHS Trusts/hospitals to assess for the presence or absence of a CMR unit. In cases of doubt, further inquiries were made on the hospital’s website and by telephone with the cardiology and radiology departments. In Scotland, Ireland and Wales, where services are more centralised, direct approaches were made to CMR practitioners in the region to identify all hospitals with a CMR unit. For all CMR units the service lead was identified. During 2019, the CMR lead for each Trust was sent an electronic survey (www.sogosurvey.com) to capture key service delivery metrics, including clinical scan volumes for the previous 2 years (2017 and 2018), and separately research scan volumes for 2018. The complete list of questions is provided in box 1. In cases of non-response, reminders were sent with follow-up emails and finally telephone calls. The population of each region within the UK was derived from publicly available data or from the Office for National Statistics.13 14 Statistics were performed in Microsoft Excel (Microsoft) and RStudio (RStudio, Boston, Massachusetts, USA). Continuous variables were assessed for normality via a histogram, and for skewed data variables are presented as median, IQR and range where illustrative. Data were analysed by region of the UK and compared with population statistics. Patient and public involvement was not deemed relevant to the design of the study, which was by its nature a survey.
Questions in the British Society of Cardiovascular Magnetic Resonance (BSCMR) 2019 survey
What is the name of your Trust?
What is the name of the CMR lead in your Trust?
What is the email of the CMR lead in your Trust?
Is your hospital district general/secondary care or academic/tertiary care?
How many MRI scanners do you have that are used for CMR?
For each scanner please answer: manufacturer, age, field strength?
How is your clinical CMR service funded? (National Health Service England specialised commissioning/national tariff, Clinical Commissioning Group/local negotiation, other)?
Reporting
Number of CMR cardiology consultants reporting?
Number of CMR radiology consultants reporting?
Number of CMR fellows in dept?
Number of CMR techs in dept?
Clinical indication (%)
Heart failure
Cardiomyopathy
Function and viability
Stress perfusion
Acquired vascular disease
Valvular heart disease
Myocarditis
Pericardial disease
Paediatric and congenital heart disease
Cardiac transplantation/others (eg. masses).
Service delivery
What year did CMR start?
How many clinical CMR scans performed in 2018?
How many clinical CMR scans performed in 2017?
How many half day CMR sessions per week total across all scanners?
How many patients per half day session?
Mean inpatient waiting time? (days)
Mean outpatient waiting time? (days)
Do you have a programme for pacemaker/device patients?
If you have a programme for pacemaker/device patients, do you only scan conditional devices or also non-conditional devices?
Do you have general anaesthetic lists?
Do you have an interventional CMR programme?
Do you have access to T1 mapping?
Do you have a quality assurance programme in place?
Do you have a regular CMR meeting?
Do you have an audit programme?
Are you part of a hub-and-spoke model?
Training
How many trainees are there in your department?
Which level is training offered to? (1/2/3)
How many level 3 accredited trainers are there in your department?
Is research performed in your department?
Is there external, peer-reviewed research grant funding contributing to research in your department (during past 12 months)?
How many research CMR scans in 2018?
Results
Services and scanners
In 2019, there were 82 CMR units in the UK, and we achieved a 100% response rate to the survey. Of these, 71 were in England, 1 in Northern Ireland, 6 in Scotland and 4 in Wales. In the 2014 survey there were 68 units, and in the 2011 survey (2008–2010 data) 60 units, representing a 37% increase in CMR centres in the last decade. Thirty-seven units were in secondary care (district hospitals) and 45 in tertiary care/regional/academic centres. For every million people in the population, there were 1.3 CMR units in England, 0.5 in Northern Ireland, 1.1 in Scotland and 1.3 in Wales.
The total number of MRI scanners used for CMR was 166 (median 2/centre, IQR 1–3, range 1–5). Of those who provided manufacturer information, 107 (72%) were Siemens, 30 (20%) Philips, 9 (6%) General Electric and 2 (1%) others. In terms of field strength, 123 (81%) were 1.5 T, 27 (18%) 3 T and 1 other. The median age of magnets was 4 years, IQR 1-8, range new to 15 years old; 17 (14%) magnets were 10 years old or older. The median age of CMR units was 10 years, IQR 6–14 years, range 1–35 years.
In terms of scanner distribution, 139 were in England, 4 in Northern Ireland, 17 in Scotland and 6 in Wales. For every million people in the population, there were 2.5 CMR-enabled MRI scanners in England, 2.1 in Northern Ireland, 3.1 in Scotland and 1.9 in Wales. Within England this varied between 2.9 scanners/million in both London and Northeast and Yorkshire regions, and 1.3 scanners/million in the East of England region.
Staffing
We identified 351 consultant physicians reporting CMR, of whom 230 (66%) were cardiologists and 121 (34%) radiologists. The median number of reporting consultants per unit was 4, IQR 2–6, range 1–16. There were in addition 148 fellows, and 411 technologists involved in CMR services. Per million/population the number of CMR consultants was 5.4 in England, 5.3 in Northern Ireland, 4.2 in Scotland and 4.5 in Wales.
Volume
The total number of clinical CMR scans performed in the UK was 100 386 in 2017 and 114 967 in 2018, a 15% increase in 1 year. In addition, there were 10 126 research scans performed in 2018. For comparison, in previous surveys the total annual number of scans in 2008 was 20 597, and in 2010 it was 38 485, although the response rate in these surveys did not achieve 100%. This therefore represents an estimated fivefold growth in 10 years.
In 2018, the median number of scans/centre was 780, IQR 373–1951, range 98–10 000. In 2017, these data were median 750, IQR 374–1600, range 100–7500 based on 80 centres, as two services started in 2018. For comparison, in 2008 the median number of scans was 240.
By head of UK population in 2018, there were 1731 scans/million people. Table 1 shows these data by region. The number of scans/million population were 1907 scans in England, 1302 in Northern Ireland, 827 in Scotland and 396 in Wales. In England, this varied between 4256 scans/million in the London region and 985 scans/million in the Southeast region (figure 1A).
Results of the BSCMR 2019 survey

(A) Map showing number of cardiovascular magnetic resonance (CMR) scans per million population by UK region in 2018. (B) Map showing median outpatient waiting time for CMR by UK region (days).
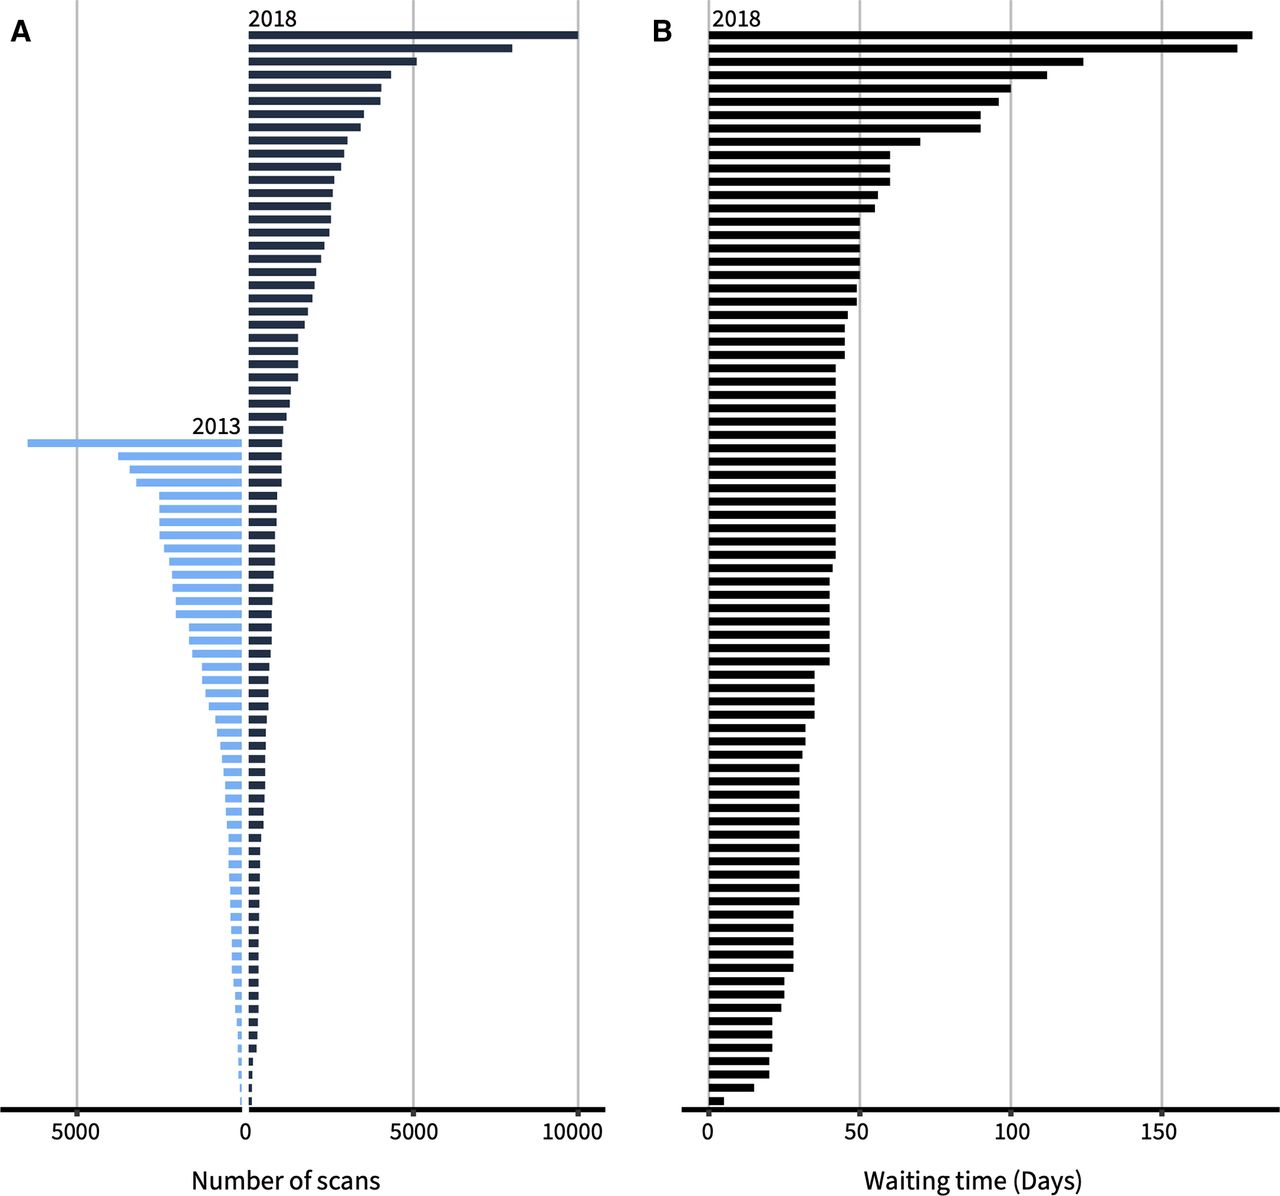
A significant part of the growth has been in the numbers of scans performed in each centre as well as an increase in the number of centres. Data for annual scan volume by centre are shown in table 2 and figure 2A with data from 2013 for comparison. Three very high-volume centres performed >5000 scans/year.
Number (%) of CMR units by scan volume
Waiting times
Centres reported their mean outpatient referral to diagnostic (RTD) scan time. The median RTD was 41 days, IQR 30–49 days, range 5–180 days. Twenty-five (30%) centres had a mean RTD longer than 42 days (6 weeks), and 8 (10%) had a mean RTD of 90 days or more. The median reported RTD was 40 days in England, 180 days in Northern Ireland, 55 days in Scotland and 50 days in Wales. By region in England, the median reported RTD ranged from 25 days in London to 44 days in the Southwest region (table 1, figures 1B and 2B). The median reported inpatient RTD was 3 days, IQR 2–4 days, range 0–7 days.

(A) Number of scans by cardiovascular magnetic resonance (CMR) unit in 2018 (black bars). Data for 2013 are shown in blue for comparison. The units are ranked by volume for each year with no linkage between 2013 and 2018 data. (B) Outpatient waiting times for CMR by unit (days).
Indications
The mean percentage for each indication for CMR was heart failure 21%, cardiomyopathy 27%, function and viability 22%, stress perfusion 24%, acquired vascular disease 6%, valvular heart disease 5%, myocarditis/pericardial disease 10%, paediatric/congenital heart disease 10%, cardiac transplant 0.4%, others, for example, cardiac masses 3%. This adds up to >100% likely indicating some overlap between indications. Of 70 centres answering a question about the performance of stress perfusion CMR, 58 (83%) indicated that they had a stress perfusion service.
Quality/Research/Training
Of the 74 units answering questions on clinical governance, 66 (89%) had a formal quality assurance (QA) programme, 63 (85%) had a regular CMR clinical meeting and 58 (78%) had a regular audit programme. Forty-four (59%) of 74 units were active in research. Of these units, the median number of research scans was 100/year, IQR 30–377, range 2–1600. Fifty-three (72%) of 74 units had cardiology/radiology trainees, mean number per unit 3.4, range 1–25. Thirty-seven (23%) units were offering training up to level 3 and a further 15 (20%) to level 2.
Other aspects of CMR service
Seventy-four units provided data on whether they had a service for patients with cardiac implanted electronic devices (pacemakers and defibrillators). Of these, 60 (81%) provided this service; 20 (33%) were scanning both MRI conditional and non-conditional devices, with 40 (67%) scanning MRI conditional devices only. The 14 (19%) units that did not have a service for patients with cardiac implanted electronic devices included 5 tertiary referral centres. Finally, 54 of 73 units (74%) had access to T1 mapping, 18 of 72 units (25%) had general anaesthetic (GA) cardiac lists and 3 of 74 units (4%) had an interventional CMR programme.
Discussion
The current BSCMR survey is the first to reach a 100% response rate across the UK. We therefore have a unique and valuable insight into the ‘real-world’ state of UK CMR service delivery, not currently available in any other government or NHS dataset. The 100% response rate is itself remarkable and a testament to the engagement of physicians active in CMR in the UK with a representative professional society (BSCMR).
The three iterations of the BSCMR survey have shown a remarkable growth in the use of CMR at approximately fivefold over the last 10 years, although this will to a degree be an overestimate as previous surveys did not achieve a 100% response rate. There is unfortunately a paucity of datasets from other countries with which to compare our results. There are publicly available data from the US Medicare system, which showed that in 2017 there were 26 796 CMR scans performed on Medicare beneficiaries, compared with 102 886 scans in the UK.15 Although Medicare only covers 17.8% of the population of the USA, beneficiaries are in general aged over 65 years where the burden of cardiovascular disease is greatest. Given that the population of the USA is 329 000 000,16 17.8% of the population represents ~58 562 000, giving a rate of CMR among Medicare beneficiaries of ~406 scans/million; the comparator for the UK in 2017 was 1511, 3.7 times higher. The EuroCMR registry collected data on 27 781 scans from 57 sites in 15 countries between 2007 and 201217 and the Society for Cardiovascular Magnetic Resonance has sponsored the Global CMR Registry project which has collected data from 62 456 scans between 2013 and 2017 from 10 centres.18 While these are both registries looking at indications and clinical outcomes rather than scan volumes, it is clear that viewed internationally, the UK CMR activity levels are numerically large. There are significant benefits to patients from the widespread use of this imaging modality in terms of more sophisticated phenotyping, for example, non-invasive rather than invasive assessment for the aetiology of heart failure is both more clinically effective and also safer.19
However, growth has not been uniform across the UK, with wide disparities in use of and access to CMR. The annual CMR volume per unit varies widely from 98 to 10 000 patients. The BSCMR previously recommended a minimum number of scans per centre per year of 300, but some low volume centres may be in their first year of CMR practice.20 In terms of CMR activity by million population for the year 2018, this varied from a low of 396 in Wales to a high of 4256 in London, a greater than 10-fold difference. Data analysis by region may be affected by patients being sent across regional boundaries for CMR, but this also highlights low access to CMR in their home region. However, we should note that CMR services in London include supra-regional and national services such as the National Amyloid Centre, and specialised units for thalassaemia, three centres for paediatric and adult congenital heart disease and a service for non-conditional cardiac devices, and this will lead to apparent higher activity levels in the London region per million population.
In 2010, the BSCMR and British Society of Cardiovascular Imaging estimated CMR activity would need to be ~2275 scans per million adults per year.20 While 10 years later it is likely that the need will have increased, our data show that this target has been achieved in London but not in any other region of the UK. It is interesting to speculate why there is such a variation in activity across the UK. The most likely explanation is that cardiologists with significant experience of CMR are aware of its utility and have a lower threshold for referral than those with more limited exposure. A second possibility is that in some areas long waiting times are a disincentive to refer for CMR. A third possibility is that some areas have very well-established nuclear medicine services and that this is used in preference to CMR for ischaemia and viability assessment, despite the fact that CMR has been shown to have greater diagnostic accuracy,21 22 prognostic ability23 and is more cost-effective from an NHS perspective,24 25 although the rapid expansion in cardiac CT services has further complicated the picture. However, where CMR activity rates are low, it is likely that patients are being managed without the potential benefits and insights of this advanced cardiac imaging technology, not just in coronary artery disease, but across the full range of CMR indications.2 This disparity in access to CMR is one of the main findings of this survey.
Clinical volume is an important measure of access to CMR, but so too are waiting times. This survey shows that the median of the mean reported outpatient waiting times for CMR was 25 days in London and 180 days in Northern Ireland, a sevenfold difference. Given that this is a mean some patients may be waiting significantly longer. For coronary artery disease or cardiomyopathy, for instance, a 6-month wait may be clinically meaningful if decisions about revascularisation or device implantation are being based on the results of CMR exams, so this variation in waiting time may be a clinical concern.
The limitations of this survey are that the data are self-reported and therefore may not be completely accurate, but a strength is the engagement of all UK CMR centres. Small volume private CMR units may not have been captured by this survey, but private scans performed in NHS units have been. Waiting time data may not reflect planned interval scans. Finally as this is a survey we do not present outcome data.
Overall, our data indicate a lack of equitable access to CMR across the UK. Where there is clear evidence of resource under-provision, action is needed by healthcare providers, the NHS and government, bearing in mind the complex funding arrangements for CMR in the UK. High levels of regional variation in access to CMR are unacceptable given its strong evidence base and the high-level recommendations for its use in international clinical care guidelines.
Conclusions
This survey provides a unique, contemporary, ‘real-world’ insight into a national CMR service delivery model with 100% centre engagement. The 10-year growth in CMR usage at approximately fivefold has been remarkable but heterogeneous across the UK, with some regions still reporting low usage or long waiting times which may be of clinical concern.
Key messages
What is already known on this subject?
Cardiovascular magnetic resonance (CMR) is well-established in the UK with high scan volumes by international standards.
The British Society for CMR has periodically surveyed all UK CMR units, starting in 2008.
What might this study add?
There has been an approximately fivefold increase in CMR use in the UK since 2008.
The clinical use of CMR is highly variable across the UK with a >10-fold difference between the region with the highest and the lowest scan volumes.
Waiting times are also highly variable across regions with a sixfold difference between the region with the shortest and the longest mean wait.
How might this impact on clinical practice?
This regional variation is a concern both for equity of provision of advanced cardiac imaging by CMR, and equity of clinical care across the UK, and should be addressed.
Data availability statement
All data relevant to the study are included in the article or uploaded as supplemental information.
Ethics statements
Patient consent for publication
Ethics approval
As this was a survey with no patient-level data or intervention, institutional ethical review or board approval was not required.
Acknowledgments
The authors would like to thank all CMR units and colleagues who completed the survey.
References
Footnotes
Twitter @drniallkeenan, @gabycaptur, @fairbairn_tim, @DrDeclanORegan
Contributors All authors meet all four criteria below: substantial contributions to the conception and design of the work, and the acquisition, analysis and interpretation of data. Drafting the work or revising it critically for important intellectual content. Final approval of the version published. Agreement to be accountable for all aspects of the work in ensuring that questions related to the accuracy or integrity of any part of the work are appropriately investigated and resolved. NGK and JPG are responsible for the overall content as guarantors.
Funding The authors have not declared a specific grant for this research from any funding agency in the public, commercial or not-for-profit sectors.
Competing interests None declared.
Patient and public involvement Patients and/or the public were not involved in the design, or conduct, or reporting, or dissemination plans of this research.
Provenance and peer review Not commissioned; externally peer reviewed.