Article Text

Abstract
Objective: To investigate the impact of blood pressure (BP) on the Doppler echocardiographic (Doppler-echo) evaluation of severity of aortic stenosis (AS).
Methods: Handgrip exercise or phenylephrine infusion was used to increase BP in 22 patients with AS. Indices of AS severity (mean pressure gradient (ΔPmean), aortic valve area (AVA), valve resistance, percentage left ventricular stroke work loss (% LVSW loss) and the energy loss coefficient (ELCo)) were measured at baseline, peak BP intervention and recovery.
Results: From baseline to peak intervention, mean (SD) BP increased (99 (8) vs 121 (10) mm Hg, p<0.001), systemic vascular resistance (SVR) increased (1294 (264) vs 1552 (372) dyne×s/cm5, p<0.001) and mean (SD) transvalvular flow rate (Qmean) decreased (323 (67) vs 306 (66) ml/s, p = 0.02). There was no change in ΔPmean (36 (13) vs 36 (14) mm Hg, p = NS). However, there was a decrease in AVA (1.15 (0.32) vs 1.09 (0.33) cm2, p = 0.02) and ELCo (1.32 (0.40) vs 1.24 (0.42) cm2, p = 0.04), and an increase in valve resistance (153 (63) vs 164 (74) dyne×s/cm5, p = 0.02), suggesting a more severe valve stenosis. In contrast, % LVSW loss decreased (19.8 (6) vs 16.5 (6)%, p<0.001), suggesting a less severe valve stenosis. There was an inverse relationship between the change in mean BP and AVA (r = –0.34, p = 0.02); however, only the change in Qmean was an independent predictor of the change in AVA (r = 0.81, p<0.001).
Conclusions: Acute BP elevation due to increased SVR can affect the Doppler-echo evaluation of AS severity. However, the impact of BP on the assessment of AS severity depends primarily on the associated change in Qmean, rather than on an independent effect of SVR or arterial compliance, and can result in a valve appearing either more or less stenotic depending on the direction and magnitude of the change in Qmean.
- AS, aortic stenosis
- AVA, aortic valve area
- BP, blood pressure
- CO, cardiac output
- Doppler-echo, Doppler echocardiography
- EF, ejection fraction
- ELCo, energy loss coefficient
- LV, left ventricular
- LVOT, left ventricular outflow tract
- % LVSW loss, percentage left ventricular stroke work loss
- ΔPmax, maximum transvalvular pressure gradient
- ΔPmean, mean transvalvular pressure gradient
- Qmean, mean transvalvular flow rate
- SAC, systemic arterial compliance
- SBP, systolic blood pressure
- SV, stroke volume
- SVR, systemic vascular resistance
Statistics from Altmetric.com
- AS, aortic stenosis
- AVA, aortic valve area
- BP, blood pressure
- CO, cardiac output
- Doppler-echo, Doppler echocardiography
- EF, ejection fraction
- ELCo, energy loss coefficient
- LV, left ventricular
- LVOT, left ventricular outflow tract
- % LVSW loss, percentage left ventricular stroke work loss
- ΔPmax, maximum transvalvular pressure gradient
- ΔPmean, mean transvalvular pressure gradient
- Qmean, mean transvalvular flow rate
- SAC, systemic arterial compliance
- SBP, systolic blood pressure
- SV, stroke volume
- SVR, systemic vascular resistance
Transvalvular pressure gradient and aortic valve area (AVA) are the standard indices to determine the haemodynamic severity of aortic stenosis (AS).1,2 However, a patient’s physiological state can affect these indices and therefore the assessment of AS severity. Pressure gradients and AVA vary with transvalvular flow and flow-mediated forces.3,4,5,6,7,8,9,10 Valve resistance, % left ventricular stroke work loss (% LVSW loss) and the energy loss coefficient (ELCo) have been proposed as alternative indices of AS severity that may be less sensitive to transvalvular flow.7,11–21 However, this has not been corroborated in individual patients when transvalvular flow was altered using exercise or inotropic infusion.6,9
The impact of blood pressure (BP) on the assessment of AS severity has received less attention.2 Traditionally, low systolic BP (SBP) and a decreased pulse pressure have been considered signs of severe AS, whereas the presence of hypertension excluded severe AS.22 However, recent data demonstrate that hypertension commonly coexists with and is a risk factor for AS.23–27 Hypertension can lead to an underestimation of AS severity on physical examination.22 Furthermore, BP and systemic vascular resistance may influence the assessment of the haemodynamic severity.2 In a catheterisation study, Laskey et al28 observed a decrease in transvalvular pressure gradient and a potential underestimation of AS severity when peripheral resistance was increased. Similarly, induction of hypertension in an animal model of supravalvular AS resulted in a decrease in pressure gradient and an increase in the area of the supravalvular stenosis.29 In contrast, pressure gradient increased and valve area decreased when systemic vascular resistance was increased in an in vitro model of AS, leading to a potential overestimation of the AS severity.30 AS and hypertension commonly coexist in our ageing population, and the interaction of systemic BP with the evaluation of AS severity needs to be better understood to manage patients optimally.31,32 The purpose of this study was to investigate the effects of systemic BP on the assessment of AS severity using Doppler echocardiography (Doppler-echo) in patients with valvular AS.
METHODS
Study population
This was a transversal study of 22 patients with isolated valvular AS (aortic and mitral regurgitation ⩽1+) who underwent echocardiography at the University of Ottawa Heart Institute, Ottawa, Ontario, Canada. Patients were enrolled if they were ⩾18 years of age, in sinus rhythm and had an abnormal aortic valve with a transvalvular velocity ⩾2.5 m/s. Patients were excluded if they had severe hypertension (>180/110 mm Hg), recent acute coronary syndrome or cerebrovascular accident (during the past 6 months), Canadian Cardiovascular Society class III–IV angina pectoris, New York Heart Association class III–IV congestive heart failure, severe left ventricular dysfunction (ejection fraction (EF) <30%) or symptomatic peripheral vascular disease. The study was approved by the institutional review board and all subjects gave written informed consent.
Study protocol
Baseline supine brachial BP was measured in the non-dominant arm using a mercury sphygmomanometer after 5 min of rest. Each patient underwent a baseline resting Doppler-echo examination. Echocardiographic data were stored on high-density magneto-optical disks for later off-line analysis.
Left ventricular outflow tract (LVOT) diameter was obtained using two-dimensional echocardiography, LVOT velocity using pulsed-wave Doppler and transvalvular velocity using continuous wave Doppler, as described previously.9 The ascending aorta diameter was measured at the sinotubular junction in the parasternal long-axis view. Left ventricular (LV) volumes were derived by the biplane method of discs.
Following the baseline examination, patients underwent a BP intervention protocol using either handgrip exercise or phenylephrine infusion.
Handgrip protocol
Patients were instructed to use their dominant hand to perform rhythmic handgrip exercise (30 contractions/min) at 40% of their maximum voluntary contraction using a calibrated dynamometer. Handgrip exercise was performed for 8 min, with acquisition of Doppler-echo and BP measurements during the final 2 min. Doppler-echo and BP measurements were repeated in recovery after 5 min of rest.
Phenylephrine protocol
Patients underwent a graded intravenous phenylephrine infusion protocol as described previously from our institution (University of Ottawa Heart Institute, Ontario, Canada).33 The phenylephrine infusion was started at 0.4 μg/kg/min and increased to 0.8, 1.6 and 2.4 μg/kg/min at 6 min intervals. The infusion was discontinued if SBP increased >40 mm Hg, diastolic BP increased >20 mm Hg, or the patient developed intolerable symptoms or ventricular arrhythmias. Doppler-echo and BP data were acquired in the last 2 min of the final infusion rate. Doppler-echo and BP data were repeated in recovery 20 min after discontinuation of the phenylephrine infusion.
Doppler-echo haemodynamic analysis
Doppler-echo measurements were averaged from 3 to 5 cardiac cycles. LVOT area (CSALVOT) was calculated from the diameter using a circular assumption. Stroke volume was calculated from the LVOT and transvalvular velocity time integrals (VTILVOT, VTIAS), as34:
SV = VTILVOT×CSALVOT
Mean transvalvular flow rate (Qmean) was derived by dividing stroke volume by the systolic ejection time, and cardiac output (CO) by multiplying stroke volume and heart rate. Systemic vascular resistance (SVR) was estimated as:
SVR = 80×(mean BP)/CO
where mean BP was obtained using a mercury sphygmomanometer. Systemic arterial compliance (SAC) was calculated as35:
SAC = SV/(SBP–DBP)
where SBP and DBP are the systolic and diastolic BPs.
Doppler-echo indices of AS severity
Peak transvalvular pressure gradient (ΔPmax) was calculated using the peak transvalvular (Vmax) and LVOT velocity (VLVOT), and the modified Bernoulli equation34:
ΔPmax = 4×(Vmax2–VLVOT2)
Mean transvalvular pressure gradient (ΔPmean) was obtained by averaging instantaneous pressure gradients over the ejection period. AVA was calculated by continuity equation,5,36,37 where:
AVA = (VTILVOT/VTIAS) × CSALVOT
Valve resistance was calculated as38:
Resistance = (ΔPmean/Qmean)×1333
% LVSW loss was derived as9,19,20:
% LVSW loss = (ΔPmean/LVPmean)×100%
where LVPmean is the mean systolic left ventricular pressure, calculated by adding the SBP and ΔPmean.
The ELCo was calculated as21:
ELCo = (AVA×Ao)/(Ao–AVA)
where Ao is the ascending aorta area.
Statistical analysis
Data are expressed as mean (SD). Differences between indices of AS severity at baseline, BP intervention and recovery were assessed by analysis of variance with repeated measures. The relationships between the change in indices of AS severity and the change in haemodynamic variables were compared using least-squares linear regression analysis. Correlations were described by Pearson’s correlation coefficient. Stepwise linear regression analysis was used to identify haemodynamic variables on univariate analysis that were independent predictors of the change in an index of AS severity. A p value ⩽0.05 was considered significant.
RESULTS
Patient characteristics
Table 1 shows the demographic and baseline Doppler-echo data in the 22 patients. In all, 16 (72%) patients had hypertension and 4 (18%) patients had symptomatic coronary artery disease. The aetiology of AS was degenerative (trileaflet) in 11 patients, bicuspid aortic valve disease in 10 patients and indeterminate in 1 patient. Baseline ΔPmean (SD) was 36 (12) mm Hg (17–62 mm Hg) and AVA was 1.15 (0.32) cm2 (0.72–1.82 cm2).
Demographic and baseline echocardiographic characteristics of the total cohort (n = 22)
Haemodynamic changes during BP intervention
BP was altered by exercise handgrip in 18 patients and by phenylephrine infusion in 4 patients. There were no adverse events in the exercise handgrip cohort, and all patients completed the protocol. Two patients undergoing phenylephrine infusion reported minor symptoms of flushing at 1.6 μg/kg/min; however, the infusion protocol did not have to be discontinued.
Table 2 shows the haemodynamics at baseline, peak BP intervention and recovery. From baseline to peak intervention, SBP increased by 27% (p<0.001) and mean BP increased by 22% (p<0.001). All patients demonstrated an increase in SBP and mean BP (fig 1). The increase in BP was similar in the handgrip and phenylephrine intervention cohorts (Δmean (SD) BP 21 (10) vs 26 (6) mm Hg; p = 0.22). SVR increased by 20% (p<0.001) and SAC decreased by 30% (p<0.001). There was no significant change in stroke volume from baseline to intervention, although Qmean decreased by 5% (p = 0.02; fig 1). The change in Qmean was similar in the handgrip and phenylephrine cohorts (–19 (31) vs –6 (38) ml/s; p = 0.54). LV EF did not change from baseline to intervention (73 (8) vs 72 (9)%; p = NS).
Comparison of haemodynamic data at baseline, intervention and recovery in the total cohort (n = 22)

Distribution of mean blood pressure (BP, panel A) and mean transvalvular flow rate (Qmean, panel B) at baseline, peak BP intervention and recovery in the 22 patients.
Effect of change in blood pressure on indices of AS severity
Table 2 shows the indices of AS severity at baseline, peak BP intervention and recovery, and fig 2 shows the individual changes in Qmean, ΔPmean and AVA. There was no change in ΔPmean from baseline to intervention (fig 3). In contrast, AVA decreased from 1.15 (0.32) to 1.09 (0.32) cm2 (p = 0.02; fig 3). In all, 14 of the 22 patients demonstrated a decrease in AVA with the increase in BP (fig 4). The change in AVA from baseline to peak BP intervention ranged from –0.26 to +0.11 cm2. Notably, 5 of the 22 (23%) patients had a change in AVA that crossed a threshold of 1.5 or 1.0 cm2, thus changing the classification of AS severity according to the American College of Cardiology/American Heart Association Task Force on Practice guidelines.1 The valve stenosis appeared more severe in four patients (two patients changed from mild to moderate AS; two patients changed from moderate to severe AS) and less severe in one patient (severe to moderate AS). The change in AVA with the BP intervention was not related to baseline AS severity (r = –0.06; p = NS).
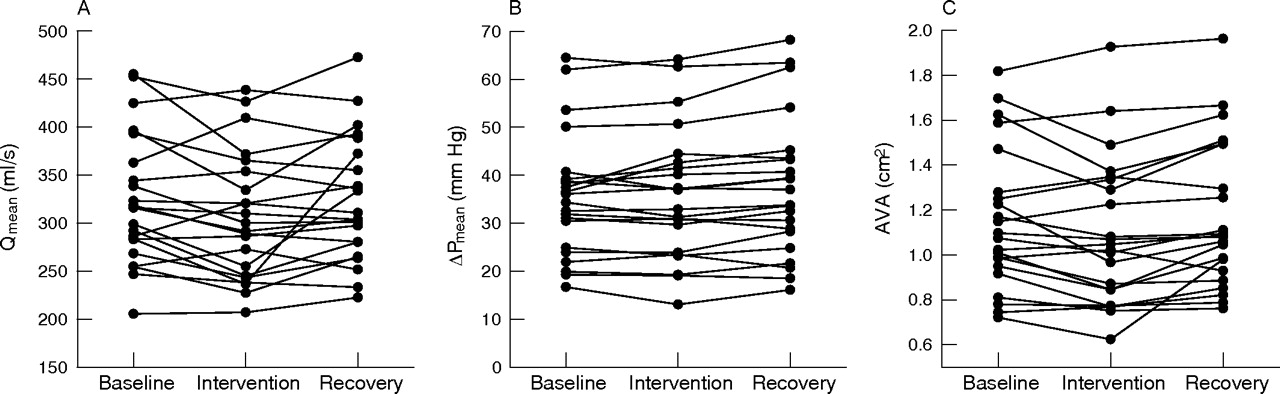
Individual changes in mean transvalvular flow rate (Qmean, panel A), mean transvalvular pressure gradient (ΔPmean, panel B) and aortic valve area (AVA, panel C) at baseline, peak blood pressure intervention and recovery in the 22 patients.

Distribution of mean transvalvular pressure gradient (ΔPmean, panel A) and aortic valve area (AVA, panel B) at baseline, peak blood pressure intervention and recovery in the 22 patients.

Change in aortic valve area (AVA) from baseline to peak blood pressure intervention in the 22 patients. *Identifies patients in whom there was a change in the classification of aortic stenosis (AS) severity.
SBP and mean BP were found to be lower at recovery than baseline, although Qmean was similar. There was no difference between the average ΔPmean and AVA at baseline and recovery in the study cohort. However, for individual patients, the change in AVA at either peak BP intervention or recovery ranged from –0.26 to +0.26 cm2 of the baseline AVA.
Valve resistance, ELCo and % LVSW loss were also affected by the BP intervention (fig 5). From baseline to peak BP intervention, valve resistance increased (p = 0.02) and ELCo decreased (p = 0.04), giving the appearance that the valve stenosis was more severe at a higher BP. In all, 15 of the 22 patients had an increase in valve resistance and 14 patients had a decrease in ELCo. In contrast, the valve stenosis appeared less severe at a higher BP when assessed by % LVSW loss (p<0.001). Of the 22 patients, 21 had a decrease in % LVSW loss with the BP intervention. There was no difference between baseline and recovery valve resistance, ELCo or % LVSW loss.

Distribution of valve resistance (panel A), energy loss coefficient (ELCo, panel B) and percentage left ventricular stroke work loss (% LVSW loss, panel C) at baseline, peak blood pressure intervention and recovery in the 22 patients.
Handgrip and phenylephrine infusion interventions resulted in similar changes in the indices of AS severity.
Relationship between the change in indices of AS severity, BP and transvalvular flow rate
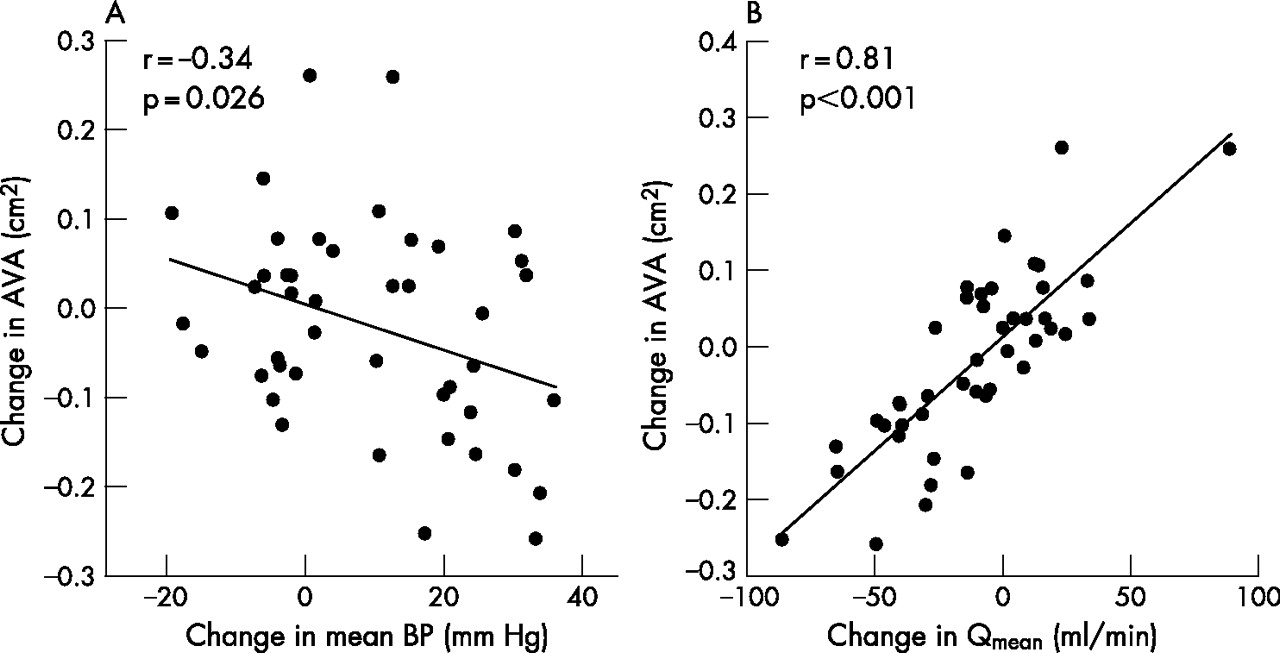
The relationship between the change in mean BP and the change in AVA was examined by plotting the change from baseline to intervention and from baseline to recovery (n = 44). The change in AVA had an inverse linear relationship with the change in mean BP (r = –0.34; p = 0.026; fig 6). Similar inverse relationships were observed for the change in AVA and the change in SBP or SVR (table 3). The change in AVA had a direct linear relationship with the change in SAC. Importantly, there was a strong linear relationship between the change in AVA and the change in Qmean (r = 0.81; p<0.001; fig 6). Only the change in Qmean was an independent predictor of the change in AVA (table 3). The change in BP, SVR and SAC had no independent effect on the change in AVA.
Univariate and multivariate analysis of the haemodynamic variables in which variation predicts a change in the index of aortic stenosis severity
Scatter plot of the relationship between the change in aortic valve area (AVA) and the change in mean blood pressure (BP, panel A) and change in mean transvalvular flow rate (Qmean, panel B) in the 22 patients.
The change in Qmean was also the only independent predictor of the change in valve resistance and ELCo. In contrast, change in Qmean did not predict the change in % LVSW loss. The change in SBP and change in SAC were independent predictors of the change in % LVSW loss. No haemodynamic variable predicted the change in ΔPmean, although the change in ΔPmean was inversely related to the change in AVA (r = –0.43, p = 0.004).
DISCUSSION
The management of patients with AS requires an evaluation of the symptomatic status and an accurate measurement of the severity of valve stenosis.1,2 The latter is required to verify that the degree of valve stenosis is severe enough to account for a patient’s symptoms. In addition, serial assessment of AS severity may identify patients at increased risk for the development of symptoms or an adverse event.39–41 However, the BP may differ between serial assessments, yet the impact of a difference in BP on the assessment of AS severity has received little study, with conflicting results.28–30
In this study, handgrip exercise and phenylephrine infusion resulted in a significant increase in BP and SVR, with minimal effect on heart rate, ventricular dimensions or EF. ΔPmean remained constant, despite the increase in BP. Presumably, LV systolic pressure increased in parallel with the acute augmentation of arterial pressure. In contrast, AVA decreased, resulting in the valve stenosis appearing more severe. Similarly, the valve stenosis appeared more severe when assessed using valve resistance or ELCo. In contrast, the valve stenosis appeared less severe when assessed using % LVSW loss.
Previous studies investigating the effect of BP and SVR on the measurement of AS severity have been contradictory.28–30 Transvalvular pressure gradient increased with increasing systolic pressure and SVR in an in vitro model using an aortic bioprosthesis and constant transvalvular flow rate.30 In contrast, other investigators have suggested that the change in transvalvular pressure gradient is inversely related to the change in SVR,28,29,42 irrespective of flow.28 However, the equation28 predicting a “flow-independent” decrease in transvalvular pressure gradient as a consequence of increased SVR contains both pressure and resistance variables that are inter-related by flow, and are thus not truly flow independent.29,30 We observed no change in ΔPmean during the acute increase in BP and SVR, despite a small decrease in transvalvular flow. The failure of ΔPmean to decrease despite reduced transvalvular flow was because of a small decrease in AVA. Decreased transvalvular flow results in reduced valve-opening forces and a smaller AVA, and, since ΔPmean α (Qmean/AVA)2, a smaller AVA would attenuate the expected decrease in ΔPmean as a result of reduced Qmean.5,6,9 Our in vivo observations are consistent with those in an animal model of supravalvular AS, in which ΔPmax and ΔPmean were dependent only on the stenosis area and transvalvular flow, and not dependent on SVR or SAC.29 Non-simultaneous peak LV pressure to peak aortic pressure differences derived at catheterisation may be affected by arterial compliance independent of transvalvular flow29; however, this pressure difference cannot be measured using Doppler-echo.
In an in vitro model with a constant transvalvular flow rate, AVA derived by the Gorlin equation decreased with increasing systemic pressure and SVR.30 In contrast, both the Gorlin and continuity equation AVA increased when hypertension was induced in an animal model of supravalvular AS.29 In the current study, we observed a decrease in AVA with increased BP and SVR. The decrease in AVA probably occurred as a consequence of the concomitant decrease in transvalvular flow with the acute increase in BP. The change in Qmean was the only independent predictor of the change in AVA. Change in BP, SVR and SAC had no independent effect on the change in AVA. Previous studies have demonstrated a strong linear relationship between AVA and Qmean,5,9 probably related to flow-mediated changes in the anatomic area of the valve stenosis or flow-mediated modification of the coefficient of orifice contraction.3,4,19,43–45 However, from our study, it is not possible to determine whether the mechanism of the observed change in AVA was primarily related to a change in the anatomic valve area, coefficient of orifice contraction, flow profiles within the outflow tract or vena contracta, or a combination of these phenomena. The discrepancy between the observed decrease in AVA with an increase in BP, and the observed increase in AVA in an animal model of supravalvular AS can probably be explained by expansion of the supravalvular stenosis due to increased radial pressure, which does not occur with valvular stenoses.29 Importantly, the change in trans-stenotic flow rate in this animal model was an independent predictor of the change in stenosis area, consistent with our observation.29
Valve resistance, ELCo and % LVSW loss were also affected by the change in BP. Acute increase in BP and SVR resulted in the valve stenosis appearing more severe when assessed by valve resistance and ELCo. The change in Qmean was the only independent predictor of the change in valve resistance and ELCo, similar to AVA. In contrast, the acute increase in BP resulted in the valve stenosis appearing less severe when assessed by % LVSW loss. Not surprisingly, the change in SBP was inversely related to the change in % LVSW loss, since SBP is in the denominator of the % LVSW loss equation. Larger reductions in transvalvular flow as a consequence of acute increase in BP could potentially lead to greater reductions in % LVSW loss, since transvalvular pressure gradient, incorporated in the numerator of the % LVSW loss equation, has a strong relationship with transvalvular flow.5–7,9 Clearly, none of these alternative stenotic indices can be relied upon to provide a constant measure of AS severity during a change in BP or transvalvular flow; however, the impact on the assessment and interpretation of AS severity will depend on the specific stenotic index used.
Clinical implications
In patients with AS, we observed that (1) acute hypertension can affect Doppler-echo indices of AS severity, and that (2) the change in AS severity with a change in BP is a consequence of concomitant changes in transvalvular flow, rather than an independent effect of systemic arterial haemodynamics (ie, SVR or SAC). The observation that the indices of AS severity are affected by changes in BP has important implications for the haemodynamic assessment of patients with AS with hypertension and patients undergoing serial evaluation of disease severity. Haemodynamics including BP and transvalvular flow should be recorded as part of each evaluation, and differences in haemodynamics considered as a potential explanation for a change in AS severity independent of disease progression. Although the change in average AVA with the acute increase in BP and SVR was small (1.15 to 1.09 cm2), the individual patient response was variable (–0.26 to +0.11 cm2 of baseline AVA). In all, 5 (23%) patients had a change in AVA resulting in a reclassification of AS severity according to American College of Cardiology/American Heart Association Task Force on Practice guidelines.1 Even greater changes in AVA (–0.26 to +0.26 cm2 of baseline AVA) were found when analysing in both the intervention and recovery periods, when the BP was lower (fig 6). Although the presence of symptoms is the major determinant for surgical intervention, the magnitude to which AVA can change in a patient (ie, 0.9 vs 1.15 cm2) can clearly affect clinical decision making, especially in “grey” areas, where the symptom status of a patient may be unclear, or when evaluating the need for concomitant valve replacement in patients with milder degrees of AS undergoing coronary artery bypass graft surgery. Furthermore, the observed change in AVA is of a magnitude similar to the expected annual rate of haemodynamic progression (≈0.1 cm2/year). Thus, a patient could be diagnosed as a “rapid progressor” as a result of different haemodynamics at the time of the assessment rather than actual disease progression.39 Importantly, greater BP and associated transvalvular flow changes could result in greater perturbations in AVA, due to the linear relationship between these haemodynamic variables and AVA. Repeating the Doppler echocardiographic evaluation in patients with hypertension after normalisation of the BP may provide measurements that better reflect the severity of the valve stenosis and better identify actual disease progression during the follow-up studies.2
Potential limitations
We used models of acute increase in BP due to increased SVR to investigate the impact of BP on the assessment of AS severity. These models were not chosen for their ability to “mimic” the diverse pathophysiologies of hypertension. Rather, they were employed for their ability to affect predominantly BP and SVR, with little confounding effect on heart rate and transvalvular flow. Although these models may reflect the haemodynamics and define the expected impact of BP on the assessment of AS severity in clinical settings associated with an acute increase in BP due to increased SVR (ie, anxious patient undergoing catheterisation), they may not reflect the haemodynamics and impact of a change in BP in patients with a gradual BP increase or chronic hypertension. Chronic hypertension can be associated with either increased or decreased cardiac output, depending on the specific aetiology and time course within the disease.46 In these chronic settings, the impact of BP on the assessment of AS severity may differ, depending on whether there is an associated increase or decrease in transvalvular flow. Ultimately, the concomitant change in transvalvular flow that occurs with a change in BP will determine the effect on the Doppler-echo assessment of AS severity, with the stenosis appearing more severe if there is a decrease in transvalvular flow, and less severe if there is an increase in transvalvular flow.
CONCLUSION
Doppler-echo assessment of AS severity is dependent on the systemic BP at the time of haemodynamic assessment. Acute hypertension due to increased SVR and associated with a decrease in transvalvular flow can lead to a valve stenosis appearing more severe when assessed by AVA, valve resistance or ELCo, and less severe when assessed by % LVSW loss. However, the impact of BP on the assessment of AS severity depends primarily on the associated change in transvalvular flow rather than on the systemic arterial haemodynamics, and can lead to a stenosis appearing either more or less severe depending on the direction and magnitude of the change in transvalvular flow.
REFERENCES
Footnotes
-
Published Online First 28 November 2006
-
Competing interests: None declared.
Linked Articles
- Editorial
- Miscellanea
- Miscellanea