Article Text

Abstract
Objectives A policy model is a model that can evaluate the effectiveness and cost-effectiveness of interventions and inform policy decisions. In this study, we introduce a cardiovascular disease (CVD) policy model which can be used to model remaining life expectancy including a measure of socioeconomic deprivation as an independent risk factor for CVD.
Design A state transition model was developed using the Scottish Heart Health Extended Cohort (SHHEC) linked to Scottish morbidity and death records. Individuals start in a CVD-free state and can transit to three CVD event states plus a non-CVD death state. Individuals who have a non-fatal first event are then followed up until death. Taking a competing risk approach, the cause-specific hazards of a first event are modelled using parametric survival analysis. Survival following a first non-fatal event is also modelled parametrically. We assessed discrimination, validation and calibration of our model.
Results Our model achieved a good level of discrimination in each component (c-statistics for men (women)—non-fatal coronary heart disease (CHD): 0.70 (0.74), non-fatal cerebrovascular disease (CBVD): 0.73 (0.76), fatal CVD: 0.77 (0.80), fatal non-CVD: 0.74 (0.72), survival after non-fatal CHD: 0.68 (0.67) and survival after non-fatal CBVD: 0.65 (0.66)). In general, our model predictions were comparable with observed event rates for a Scottish randomised statin trial population which has an overlapping follow-up period with SHHEC. After applying a calibration factor, our predictions of life expectancy closely match those published in recent national life tables.
Conclusions Our model can be used to estimate the impact of primary prevention interventions on life expectancy and can assess the impact of interventions on inequalities.
- CORONARY ARTERY DISEASE
- QUALITY OF CARE AND OUTCOMES
This is an Open Access article distributed in accordance with the Creative Commons Attribution Non Commercial (CC BY-NC 4.0) license, which permits others to distribute, remix, adapt, build upon this work non-commercially, and license their derivative works on different terms, provided the original work is properly cited and the use is non-commercial. See: http://creativecommons.org/licenses/by-nc/4.0/
Statistics from Altmetric.com
Introduction
The Global Burden of Disease Study1 estimated that in 2010 cardiovascular disease (CVD), including rheumatic heart diseases, hypertensive diseases, ischaemic heart diseases, pulmonary heart disease, other forms of heart disease, cerebrovascular diseases (CBVDs), diseases of arteries and diseases of veins, was the cause of death in approximately 30% of all global deaths. In Scotland, although mortality rates have declined steadily for decades (eg, coronary heart disease (CHD) mortality rates for men were 72% lower in 2009 than in 1950), in 2009, Scottish CHD mortality rates for men and women were 39% and 64% higher, respectively, than the average for Western Europe.2 Furthermore, despite improvements, inequalities persist in Scotland. For example, in 2011, the European age-standardised CHD mortality rates for the most deprived fifth of the Scottish Index of Multiple Deprivation (SIMD) scores3 were 62% higher than the corresponding rates for the least deprived fifth of SIMD scores.4
There are many types of CVD interventions (eg, lifestyle, pharmaceuticals, legislation, etc.) which aim to reduce the disease burden, ranging from those that target the individual to those with population coverage. Reimbursement agencies, such as the National Institute for Health and Care Excellence5 in England and Wales and the Scottish Medicines Consortium6 in Scotland, require evidence that interventions are cost-effective prior to adoption. A challenge in generating this evidence is that randomised trials are short term in nature and so often modelling is necessary to predict longer term cost-effectiveness.
A definition of a policy model is a model that can evaluate the effectiveness and cost-effectiveness of interventions and inform policy decisions. There are a wide variety of CVD policy models in existence.7 A recent example,8 set in England and Wales, uses Framingham risk equations to build a model which can estimate the impact of potential interventions in terms of CVD events prevented, life years and quality-adjusted life years gained and costs to the National Health Service. A limitation of this model, as the authors acknowledge, is that it uses a limited time frame (10 years) rather than a lifetime perspective.
In developing a model to be used by policy makers, it is important that the approach is consistent with prediction models that are used in clinical practice. The Scottish Intercollegiate Guidelines Network9 has recommended the use of the ASSIGN score10 as the clinical prediction tool for prioritising individuals for primary prevention in Scotland. A key feature of this score is the inclusion of an area-based measure of socioeconomic deprivation, SIMD,3 as an independent risk factor. This has the potential to reduce inequalities because, holding the other risk factors constant, people residing in areas with higher levels of socioeconomic deprivation will be given higher ASSIGN scores. Furthermore, if the ASSIGN score is used in modelling exercises to estimate the impact of new interventions, it also provides an assessment of how the new intervention will affect the level of inequality.
The aim of our study is to develop a CVD policy model for use in Scotland using the same risk factors as ASSIGN but taking a lifetime perspective. The key outputs from this model will be life expectancy, quality-adjusted life expectancy and lifetime healthcare costs. These outputs can be used in decision analysis to assess the cost-effectiveness of interventions and their impact on health inequalities. We will report our model in a comprehensive and transparent manner, following best practice guidelines.11
Methods
We describe the methods below with additional technical details available in the online supplementary appendix.
Model structure
As for ASSIGN, the endpoints of our model are non-fatal CHD hospitalisation, non-fatal CBVD hospitalisation and deaths from CVD. However, with the focus on life expectancy we also needed to consider deaths from non-CVD causes and the additional life expectancy experienced after a non-fatal CHD or CBVD event. Figure 1 illustrates the structure of the state transition model. People enter the model in the CVD event-free state and then transit into one of four events ‘competing’ to be first. If a hospitalised patient died within 28 days of their admission the first event was reclassified as fatal. If the first event experienced is non-fatal, then there is a final transition to death. Men and women were modelled separately.

Structure of the state transition model. CBVD, cerebrovascular disease; CHD, coronary heart disease; CPD, cigarettes per day; CVD, cardiovascular disease; HDL, high-density lipoprotein cholesterol (mmol/L); SIMD, Scottish Index of Multiple Deprivation; SBP, systolic blood pressure (mm Hg); TC, total cholesterol (mmol/L).
Data source
The Scottish Heart Health Extended Cohort (SHHEC) is made up of individuals from the Scottish Heart Health Study12 which recruited random samples of the Scottish population between 1984 and 1987, and individuals from the Scottish MONICA Project13 which recruited in Edinburgh in 1986 and North Glasgow in 1986, 1989, 1992 and 1995. The SHHEC participants, aged between 25 and 74 years, attended a survey clinic where cardiovascular risk factors were measured.
The data were linked to hospital admissions using the Scottish Morbidity Record Scheme and deaths using the General Register Office (GRO) for Scotland. Risk factors used for modelling the first event were age at survey (years), systolic blood pressure (SBP; mm Hg), total cholesterol (TC; mmol/L), high-density lipoprotein (HDL) cholesterol (mmol/L), cigarettes per day (CPD), self-reported diabetes, self-reported family history of heart disease and SIMD score (2004 version). Risk factors used for modelling death after a non-fatal first event were age at first event, self-reported family history of heart disease and SIMD. Any missing data in the risk factors were taken into account using the multiple imputation of chained equations technique.14
It should be noted that the modifiable risk factors of SBP, TC, HDL cholesterol and CPD can only directly influence the risk of having a first event as these variables were only measured at baseline. Therefore, the focus of our policy model is to evaluate primary prevention interventions.
Modelling stage 1: estimating risk of having first event
Survival analysis was used to model the cause-specific hazards of the competing first events (equation 1 in figure 1). By the end of follow-up not all SHHEC participants had experienced a first event, so a parametric approach (Gompertz regression) was required to extrapolate the modelling so total remaining life expectancy could be estimated. Predicted cumulative incidence of events was calculated from the cause-specific hazards and the probability of surviving from any of the competing events at a given time.
Modelling stage 2: estimating life expectancy following non-fatal CHD and CBVD events
Gompertz regression was also used to model the hazard of death following a first event (equation 2 in figure 1). Due to censoring it was necessary to extrapolate the survival analysis to a time point when for a given covariate profile the probability of surviving beyond that time point was zero. The area under the survival curve was obtained by applying the trapezoidal rule15 with half cycle correction and this provided an estimate of remaining life expectancy.
Modelling stage 3: estimating overall life expectancy
The state transition model uses a cycle period of 1 year. At the end of a model cycle an individual can either remain in the CVD-free state or move to one of the four competing events. To calculate remaining life expectancy, the model sums the time before an event and survival time after non-fatal event (area under the survival curve). The model cycles annually for 100 years and within each cycle the model estimates the consequences if each of the competing first events occurred. For example, if a person has a non-fatal CHD event after 3 years the additional life expectancy is those 3 years added to the life expectancy following the non-fatal event predicted from the survival analysis (modelling stage 2). Whereas, if a person dies of CVD causes after 3 years the additional life expectancy is just those 3 years. All these first event possibilities are weighted by the probability of that event occurring at that particular time which comes from the predicted cumulative incidence estimates (modelling stage 1).
For measuring inequalities in life expectancy, we calculated the Slope Index of Inequality (SII)16 which takes into account the whole distribution of life expectancy across the range of SIMD.
Discrimination, validation and calibration of the model
The discrimination of the statistical models was assessed using Harrell's concordance statistic (c-statistic).17 It is important to note this will only assess discrimination where we have observed events to compare with the model predictions. As a validation exercise, we used the West of Scotland Coronary Prevention Study (WOSCOPS)18 to test the extent to which our model can predict events in a Scottish population that did not inform the development of the model. WOSCOPS was a randomised trial investigating the effectiveness of pravastatin in preventing CHD in asymptomatic men aged between 45 and 64 years. Further details of the validation exercise are shown in the online supplementary appendix.
Predicted life expectancies were obtained from a model where the risk factor values are provided by average values from the Scottish Health Survey 2009.19 These predicted life expectancies were compared with life expectancies published in GRO life tables.20 A calibration factor was used to adjust the linear predictor of the Gompertz regressions for first events to minimise the root mean square error between the predicted and observed life expectancy values for individuals aged 40, 60 and 80 years.
Results
Description of demographics and event outcomes
A total of 16 560 SHHEC participants were free of CVD at baseline, 8611 (52%) were women. The distribution of risk factors is shown in table 1. The median survival time to first event was 20.8 years (IQR 14.5, 23.6 years). A total of 6175 people (37.3%) had a first event observed during the follow-up period.
Demographics of SHHEC participants free of cardiovascular disease at baseline
Illustration of the three modelling stages
We illustrate how the model moves from risk of events to remaining life expectancy using the following individual profile: 60-year-old man, no family history of CVD, non-diabetic, SIMD score of 60.8, SBP of 160 mm Hg, TC of 7 mmol/L, HDL of 1 mmol/L and 20 CPD. The predicted cumulative incidence of the four first events and survival probabilities after a first non-fatal event (as well as the survival model estimates that produce the predictions) are detailed in the online supplementary appendix.
Table 2 shows how life expectancy is estimated. The top panel of table 2 shows remaining life expectancy estimated at the end of every cycle and for each of the four first events. For example, at the end of cycle 24 the estimated life expectancy for a man experiencing a non-fatal CHD event at that time is the 24 years alive and event free plus 3.3 years, which is the estimated life expectancy following the event. The probabilities of having a first event for each cycle are shown in the middle panel of table 2. These are obtained from the cumulative incidence curves by subtracting the cumulative probability from the previous year from the current year. The bottom panel of table 2 shows the weighted life expectancies which are obtained by multiplying together the values in the corresponding cells in the previous two panels. The sum of all the cells in the bottom panel of table 2 is the remaining expected life expectancy, which for this illustration equals 14.07 years (so life expectancy is 60+14.07=74.07 years).
Process of estimating life expectancy
Discrimination, validation and calibration of model
The discrimination of all statistical models was good with c-statistics in the range 0.65–0.80 (see online supplementary appendix). Discrimination was better for the first event models than the models following a first non-fatal event, better for the fatal CVD outcome compared with the other competing first events, and generally better for models for women than for men.
Figure 2 shows the comparison between observed cumulative incidence of first events from WOSCOPS with predictions made with our model. For the placebo arm, the predicted line falls well within the CI limits for non-fatal CBVD and fatal CVD events. However, the model underpredicts for non-fatal CHD and overpredicts for fatal non-CVD. The latter may be explained by the fact that WOSCOPS is a clinical trial where stringent exclusion criteria can result in lower mortality than observed in the general population. For the treatment arm, the agreement is good for all cardiovascular endpoints (given the exclusion of cancers from the trial), illustrating that the model has the potential to predict the impact of CVD interventions.


A and B, Validation of model predictions using West of Scotland Coronary Prevention Study trial population. CBVD, cerebrovascular disease; CHD, coronary heart disease; CVD, cardiovascular disease.
Without applying a calibration factor, the original model overpredicted life expectancy. After applying a calibration factor (see online supplementary appendix for details), all model estimates were within half a year of life table estimates with the exception of 80-year-old women.
Illustration of life expectancies
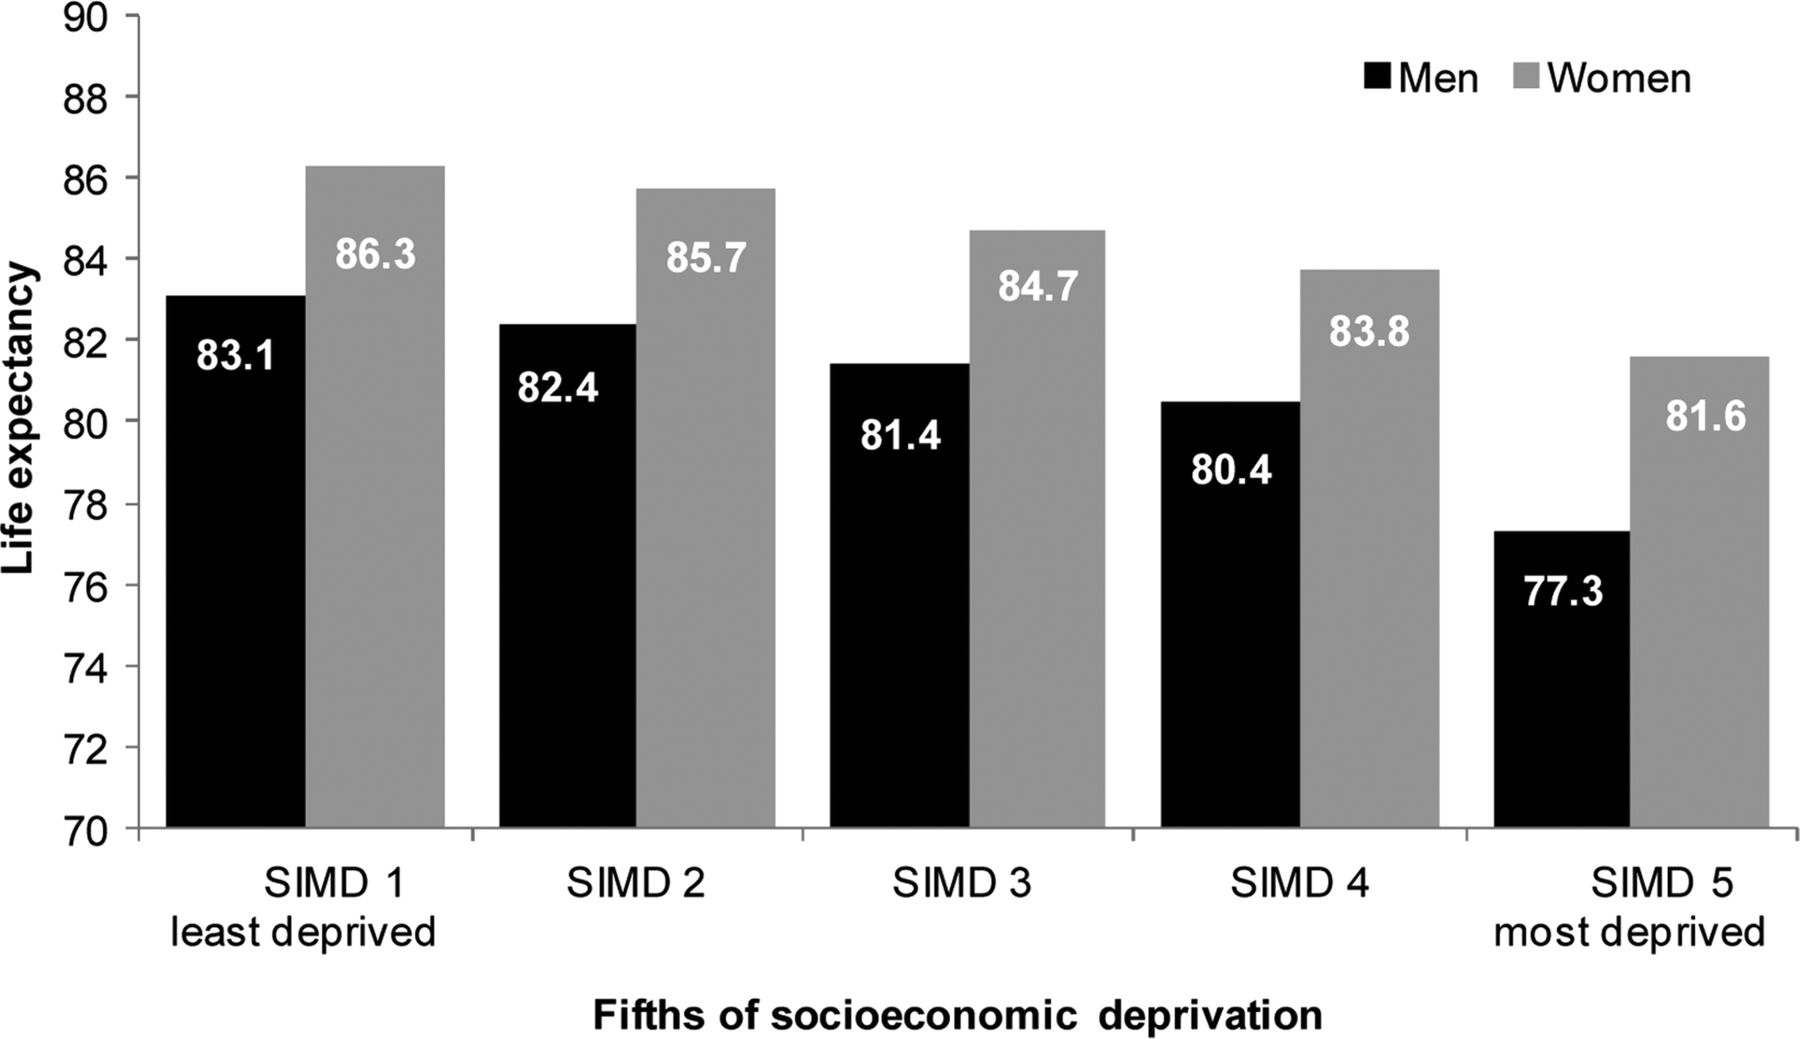
The online supplementary table shows predicted life expectancies for men and women across a wide range of individual profiles. The table shows how age, SBP, cholesterol, smoking (where ‘smoker’ is defined as somebody smoking 20 CPD) and SIMD influence life expectancy while holding diabetes and family history of heart disease constant at their average values. It can be seen that even after adjusting for traditional CVD risk factors, socioeconomic deprivation has a large impact on life expectancy. To illustrate the socioeconomic deprivation gradient, figure 3 shows the predicted life expectancies for 60-year olds across ranked fifths of SIMD scores (within each ranked group average values risk factor values were obtained from the Scottish Health Survey 2009). The difference in predicted life expectancy using the SII to compare the least and most deprived groups is 6.8 and 5.7 years for men and women, respectively.
Predicted life expectancy for ranked fifths of socioeconomic deprivation (SIMD) scores.
Discussion
Summary
This paper introduces an alternative CVD Policy Model, which includes a measure of socioeconomic deprivation as an independent risk factor. The inputs to the statistical models are the ASSIGN risk factors and the output is predicted life expectancy. By including a measure of socioeconomic deprivation as one of the risk factors, the model can account for disparity in life expectancy according to the deprivation.
Comparison with other studies
There are many CVD/CHD policy models in the existing literature and they vary considerably in their methodology. In this section, we consider models that have used life expectancy as the outcome for evaluating the effectiveness of interventions.
The CHD policy model21 is a state transition model developed in the USA. It has been used to evaluate the cost-effectiveness of both primary and secondary prevention strategies.22 In a later application,23 the model was used to evaluate the impact of risk factor modification on life expectancy. Like our model, it used a nationally representative survey to obtain baseline distributions of risk factors but unlike our model it used relative risks from Framingham risk equations in conjunction with national mortality rates to estimate annual incidence rates of CHD and non-CHD events, rather than following up the survey participants as a cohort study. Unlike our model, it did not include a measure of socioeconomic deprivation.
The IMPACT CHD mortality model24 was developed to estimate the fall in CHD mortality in Scotland attributable to treatment and risk factor change in Scotland between 1975 and 1994. It was later used25 to estimate the attributable gains in terms of life years by multiplying the number of deaths prevented/postponed by estimates of median survival taken from Scottish cohort studies linked to national morbidity and mortality records. In the original paper, the reduction in CHD deaths caused by changes in socioeconomic deprivation over time was calculated. The components of this model were obtained from various sources to obtain, for example, percentage reduction in mortality to be expected from one percentage change in risk factors.
The heart protection study was originally a randomised controlled study that demonstrated both the effectiveness and the cost-effectiveness of simvastatin.26 In a later application the cost-effectiveness of simvastatin was evaluated for remaining life expectancy of the trial population for a range of different risks of vascular disease and age groups.27 This evaluation was performed using a Markov state transition model and internally validated by comparing observed with predicted number of events. Unlike our cohort, the trial participants had a history of CVD or were being treated for hypertension. Alongside the treatment effect, many risk factors, including creatinine which was not part of our models (but no measure of socioeconomic deprivation), were used in parametric survival risk equations for vascular endpoints.
The Rotterdam Ischaemic heart disease & Stroke Computer (RISC) model28 is a state transition model which has been externally validated.29 The states of the model are similar to ours but also includes a state for CHD and stroke. Although many risk factors are considered, socioeconomic deprivation was not included. Like our model, the baseline distribution of risk factors and the risk equations for predicting model transition probabilities come from a cohort that has been followed up. The main difference in modelling strategy is that RISC uses a Monte Carlo–Markov framework for obtaining transition probabilities, whereas our approach uses competing risk parametric survival models.
Strengths
A major strength of this model is the data source. The SHHEC survey linked to national hospital discharge and death records allows individuals to be followed up for a long time (median survival time to first event was almost 21 years). The linked data set allowed us to undertake a competing risk analysis to estimate the association between risk factors and CVD (and non-CVD) outcomes using a single cohort of individuals. This is a more sophisticated approach than CVD risk scores based on a single composite endpoint where the estimate of CVD risk does not take into account competing causes. Furthermore, the inclusion of a measure of socioeconomic deprivation as an independent risk factor is congruent with an inequalities policy agenda, which is a particular priority in Scotland. In addition, the risk factors measured in SHHEC were carefully standardised and the data were very complete. Further strengths are that we have reported the performance of the model to discriminate over the observed follow-up period, shown how our model predictions compare with observed data from an external source, and taken into account and reported on how well our model is calibrated.
Limitations
Although there was long follow-up, over 60% of individuals were still to experience a first event at the end of the observation period. Therefore, it was necessary to extrapolate survival curves and we had to use a calibration factor to ensure that the average differences between model predictions and life table estimates of life expectancy were within 1 year. A second limitation is that modifiable risk factors were only measured at baseline with no follow-up measurement occasions. As we intend this model to be used to assess primary prevention interventions we do not view this as a major drawback. However, for targeted interventions any attributed gains in life expectancy could be exaggerated if beneficial changes to other modifiable risk factors not influenced by the intervention under study occur. Third, the first events we modelled were hospitalisations and so less serious CHD and CBVD events that could be treated in a primary care setting are not explicitly modelled as a health state but any future hospitalisation(s) for such patients would be captured. Fourth, as well as capturing the true effect of socioeconomic deprivation, SIMD will be acting as a proxy for unmeasured risk factors and complex causal pathways involving SIMD, unmeasured variables and the interaction between them. As such, it is likely that any predicted gradient in socioeconomic deprivation using SIMD will be an overestimation of the true inequality in life expectancies. Finally, in our validation exercise, our model predictions were different to WOSCOPS for non-fatal CHD and fatal non-CVD endpoints. Although this could be partly due to differences between trial populations and general populations, we acknowledge that our external validation results were suboptimal and in future research we would like to repeat this exercise with another external data source (which includes women).
The model was developed using Scottish data sources (SHHEC and the ASSIGN risk variables), including a Scottish-specific measure of deprivation. It is intended for use in Scotland, in the first instance. Nonetheless, the model may have wider generalisability. It is common for models developed in one setting to be recalibrated for use elsewhere. For instance, the Framingham risk score has been recalibrated for use outside of the USA, such as in England.30 A similar exercise could, in principle, be undertaken for the proposed policy model introduced in this paper.
Public health and clinical implications
Our model can be used to estimate the impact of primary prevention interventions on life expectancy and can assess the impact of interventions on inequalities. Furthermore, our model can be used at the local level for predicting future burden of disease to aid planning and allocation of services. As well as being able to predict 5-year, 10-year and lifetime risk of CVD outcomes given risk factor values for an individual, it can also predict life expectancy. This can help answer patient questions such as ‘how much longer can I expect to live if I take part in this intervention?’ and also be used as a tool to prioritise individuals for intervention.
Key messages
What is already known on this subject?
Cardiovascular disease (CVD; rheumatic heart diseases, hypertensive diseases, ischaemic heart diseases, pulmonary heart disease, other forms of heart disease, cerebrovascular diseases, diseases of arteries and diseases of veins) is a leading cause of premature mortality, morbidity and health service costs. The incidence of CVD has also been shown to be socially patterned. The primary prevention of CVD is a policy priority, including the objective to reduce health inequalities. A policy model is a model capable of evaluating the effectiveness and cost-effectiveness of a wide range of interventions aimed at modifying known CVD risk factors.
What might this study add?
This policy model joins together risk estimation, individual patient decision making and societal policy making. By taking a competing risk approach the model estimates the impact of risk factor modification on CVD events and non-CVD mortality to predict life expectancy. By including a measure of socioeconomic deprivation as an independent risk factor the policy model can be used to assess the impact of interventions on health inequalities.
How might this impact on clinical practice?
This policy model uses the ASSIGN risk factors to estimate CVD risk and can project the full impact of risk factor modification on life expectancy. Consequently, the model can be used consistently as both a clinical and policy tool, to help prioritise individuals for intervention and to evaluate the effectiveness and cost-effectiveness of interventions.
References
Supplementary materials
Supplementary Data
This web only file has been produced by the BMJ Publishing Group from an electronic file supplied by the author(s) and has not been edited for content.
Files in this Data Supplement:
- Data supplement 1 - Online supplement
- Data supplement 2 - Online table
Footnotes
Contributors JDL prepared the manuscript, with contribution from KDL and supervision from AHB. JDL and KDL undertook the analyses. All authors reviewed and contributed to the final manuscript.
Funding The development of the policy model was funded by the Chief Scientist Office for Scotland CZH/4/557.
Competing interests None.
Provenance and peer review Not commissioned; externally peer reviewed.