Article Text

Abstract
Background Extracellular volume (ECV) quantification by cardiovascular magnetic resonance (CMR) measures the extracellular space. Current methodologies require blood haematocrit (Hct) correction, a barrier to easy clinical use. We hypothesised that the relationship between Hct and longitudinal relaxation time of blood (T1blood) could be calibrated and used to generate a synthetic ECV without Hct.
Methods 427 subjects with a wide range of health and disease were divided into derivation (n = 214) and validation (n = 213) cohorts (Table 1 for patient characteristics). All subjects underwent T1 mapping with ShMOLLI at 1.5 Tesla for ECV quantification. Venous blood for Hct was obtained prior to scanning with 44 patients having a repeat Hct within 6 h.
ECV was calculated as: ECV = (Δ[1/T1myo] / Δ[1/T1blood]) * [1-haematocrit]).
Synthetic Hct was approximated from the linear relationship between Hct and native T1blood, and used to calculate synthetic ECV. Histological validation was performed on 18 patients with severe aortic stenosis (age 71 ± 10 years, 78% male). ECV was compared with collagen volume fraction from intra-operative biopsies taken during surgical valve replacement.
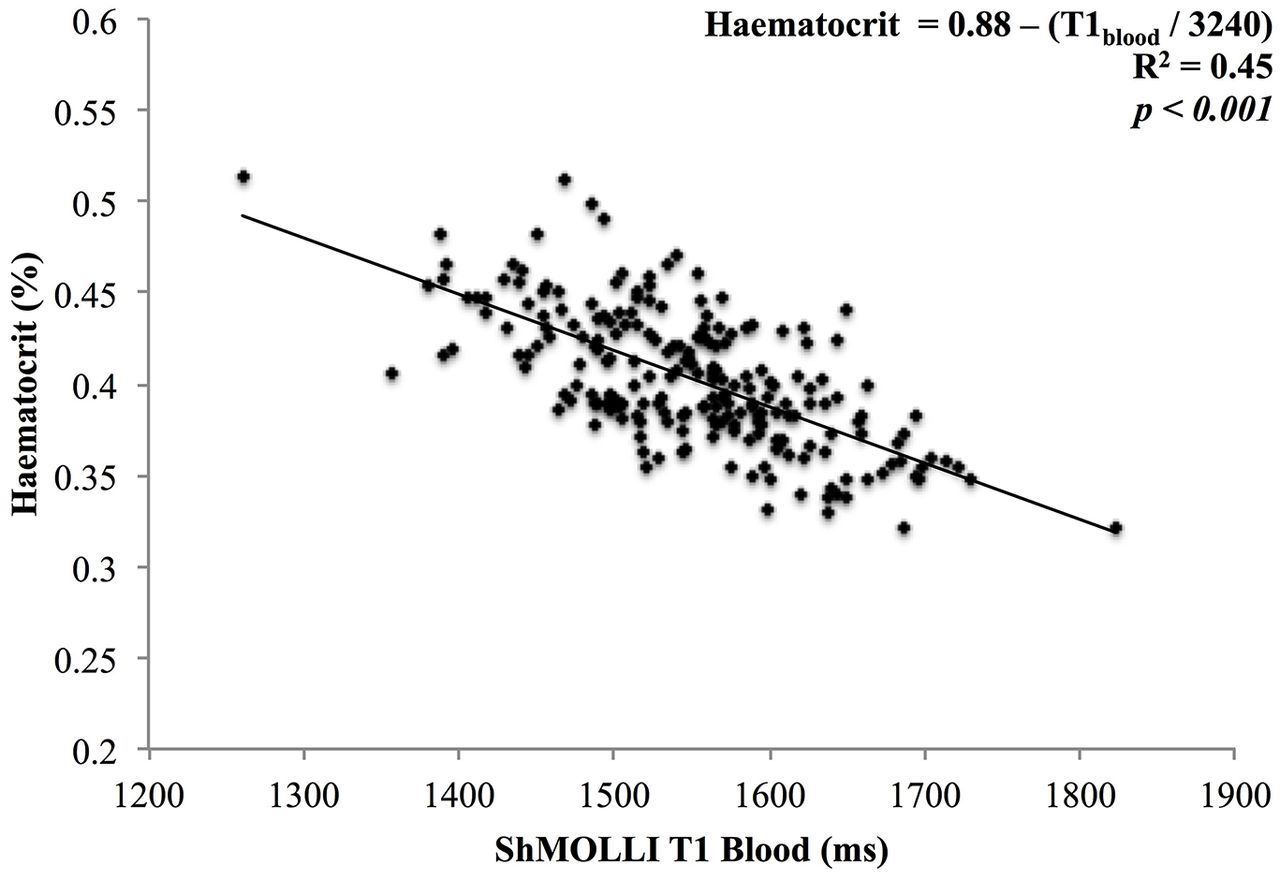
Results In the derivation cohort, native T1blood and Hct showed a linear relationship (R2=0.45; p < 0.001, Figure 1). This was used to derive synthetic Hct = 0.88 – (T1blood/ 3240). Synthetic ECVcorrelated well with ECV (R2 = 0.99; p < 0.001). These results were maintained in the validation cohort. Test:retest variability of haematocrit was higher than expected (n = 44, variability 10% with Hct:Hct R2 = 0.86). On histological validation, synthetic and conventional ECV both correlated well with collagen volume fraction (R2 = 0.61 and 0.69, p < 0.001).
Conclusion Synthetic ECV allows instantaneous non-invasive quantification of the myocardial extracellular space without blood sampling. Inline application of synthetic ECV may be an attractive alternative in clinical practice.
Patient characteristics
Correlation between T1 blood and haematocrit. In the derivation cohort (n = 214), native T1 blood and hematocrit (Hct) showed a linear relationship (R2 = 0.45; p < 0.001). This was used to derive synthetic Hct = 0.88 – (T1blood/3240).