Article Text

Abstract
Aim The flow-area (QA) technique allows measurement of pulse wave velocity (PWV) from a single phase contrast slice. However in the pulmonary circulation reflected waves arrive during systole and may cause erroneous measurements using this technique. The aim of the study was to compare three post-processing calculations, one of which avoids the reflected wave, and the other which corrects for it, on the measurement of pulmonary PWV and its reproducibility.
Materials and methods 10 young healthy volunteers (YHV) (30% male, mean age 31.5 ± 7.6) and 20 older healthy volunteers (OHV) (45% male, mean age 60.2 ± 4.0) underwent MRI using phase contrast sequences through the main pulmonary artery (MPA), right pulmonary artery (RPA) and left pulmonary artery (LPA). Measurements were repeated at 6 months in the YHV cohort and on the same visit in the OHV cohort. QA PWV was calculated using three techniques: QATrad = ΔQ/ΔA; QA3 = ΔQ/ΔA (using only the first three datapoints in the reflectionless upstroke); and QAInv = √(∑ΔA2/∑ΔQ2).
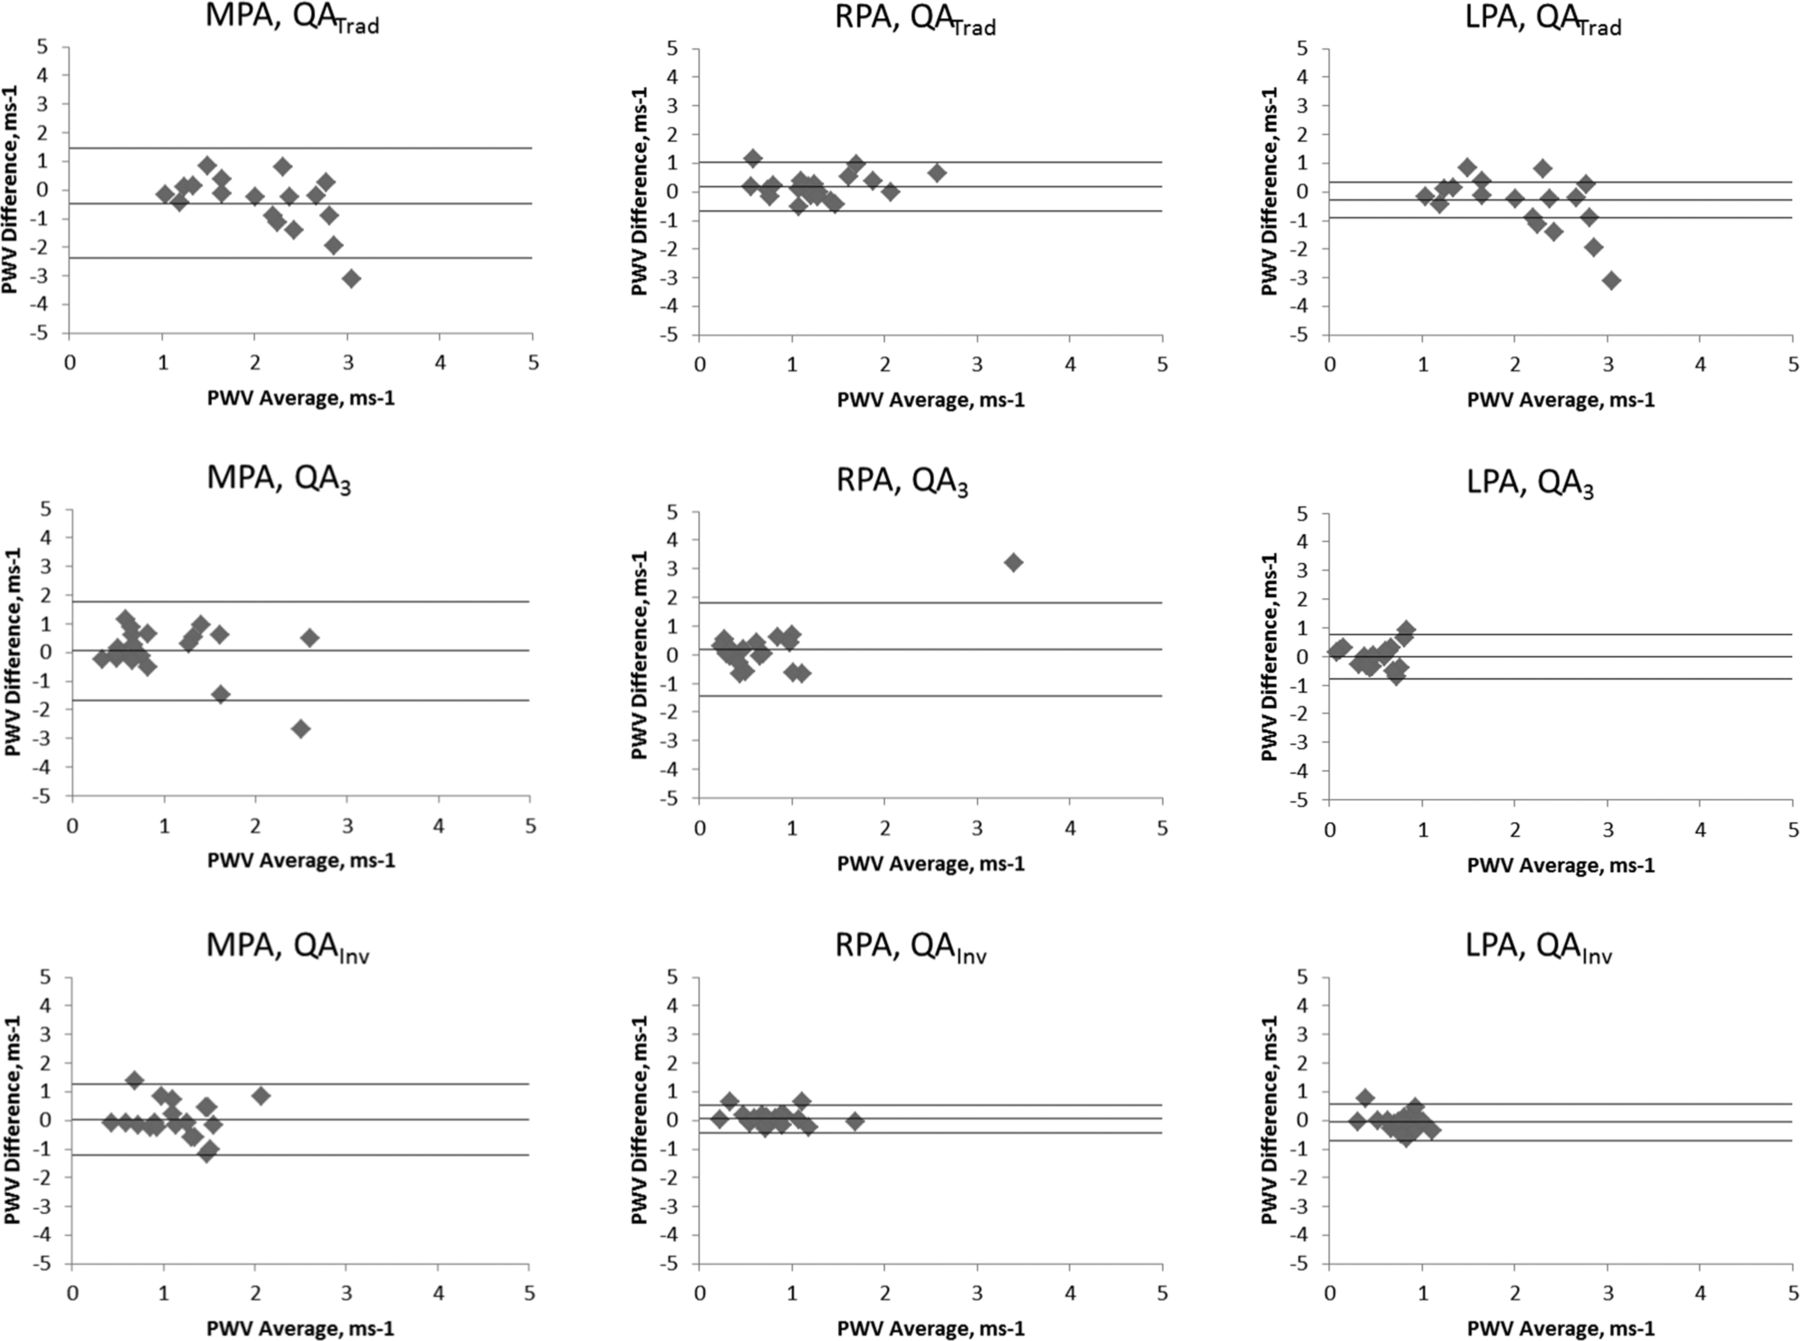
Results QATrad produced significantly higher results than QA3 (p < 0.001) and QAInv (p < 0.001), whilst there was no difference between QA3 and QAInv (p = 0.41). In scan-rescan reproducibility, QAInv yielded improved precision over QATrad and QA3: mean (SD) of PWV differences = −0.46 (0.98) ms−1, 0.05 (0.88) ms−1, and 0.01 (0.63) ms−1 for the QATrad, QA3, and QAInv of the MPA respectively; 0.17 (0.43), 0.19 (0.83) and 0.06 (0.25) ms−1 for the QATrad, QA3, and QAInv of the RPA respectively; and −0.29 (0.31), −0.01 (0.39) and −0.06 (0.32) ms−1 for the QATrad, QA3, and QAInv of the LPA respectively (see Figure 1).
Conclusion Calculations which account for wave reflections yield lower PWV than those that don’t suggesting significant confounding effects from these early reflected waves. Combining a phase contrast sequence acquisition through the right pulmonary artery with a post processing technique to account for wave reflections yields the most reproducible measurements of pulmonary PWV.
Bland-Altman plots comparing interscan PWV repeatability using the 3 techniques in the 3 pulmonary arterial locations