Article Text

Abstract
Aims Patients with hypertrophic cardiomyopathy (HCM) histologically have myocyte hypertrophy and disarray, small vessel disease and fibrosis. The links and sequencing of these abnormalities in phenotype development is unclear. We implemented in-line perfusion mapping in HCM undergoing stress cardiovascular resonance (CMR) and measured pixel by pixel flow at stress and rest, in order to exactly quantify the microvascular dysfunction.
Methods 30 HCM patients and 10 controls, age and gender-matched, referred for stress CMR due to atypical chest pain and having normal findings, underwent adenosine stress perfusion CMR using in-line perfusion mapping in Gadgetron to deliver pixel-by-pixel myocardial blood flow (MBF, mls/g/min) for three short axis views (± an additional long axis) at stress and rest. Transmural (tmMBF), endocardial (endoMBF) and epicardial (epiMBF) were calculated for each LV segment Figure). MBF was correlated with segmental wall thickness (WT) and late gadolinium enhancement (LGE), quantified by the 5 SD method.
Results Stress MBF was lower in HCM (2.23±0.74 vs 3.49±0.82 mL/g/min, p 0.008 for tmMBF). This was most marked for endoMBF. The reductions were associated with increasing wall thickness (endoMBF R: –0.43, p<0.001) and the amount of segmental LGE (endoMBP R: –0.27, p<0.001). MBF could actually fall with stress compared to rest – a myocardial perfusion reserve less than one – this was more common with increasing hypertrophy. Rest MBF was the same in HCM and controls. Apparently normal HCM segments (no LVH, no LGE) had significantly lower stress MBF compared to controls (tmMBF p=0.001, endoMBF p=0.0002, epiMBF p=0.071).
Conclusion Perfusion mapping confirms that HCM patients have reduced MPR that is linked to wall thickness and scar. Stress flow can be lower than rest in hypertrophied segments. Apparently normal segments (no LVH, no LGE) have abnormal MBF suggesting this may be an early marker of the HCM phenotype. Further studies are needed (e.g. in carriers).

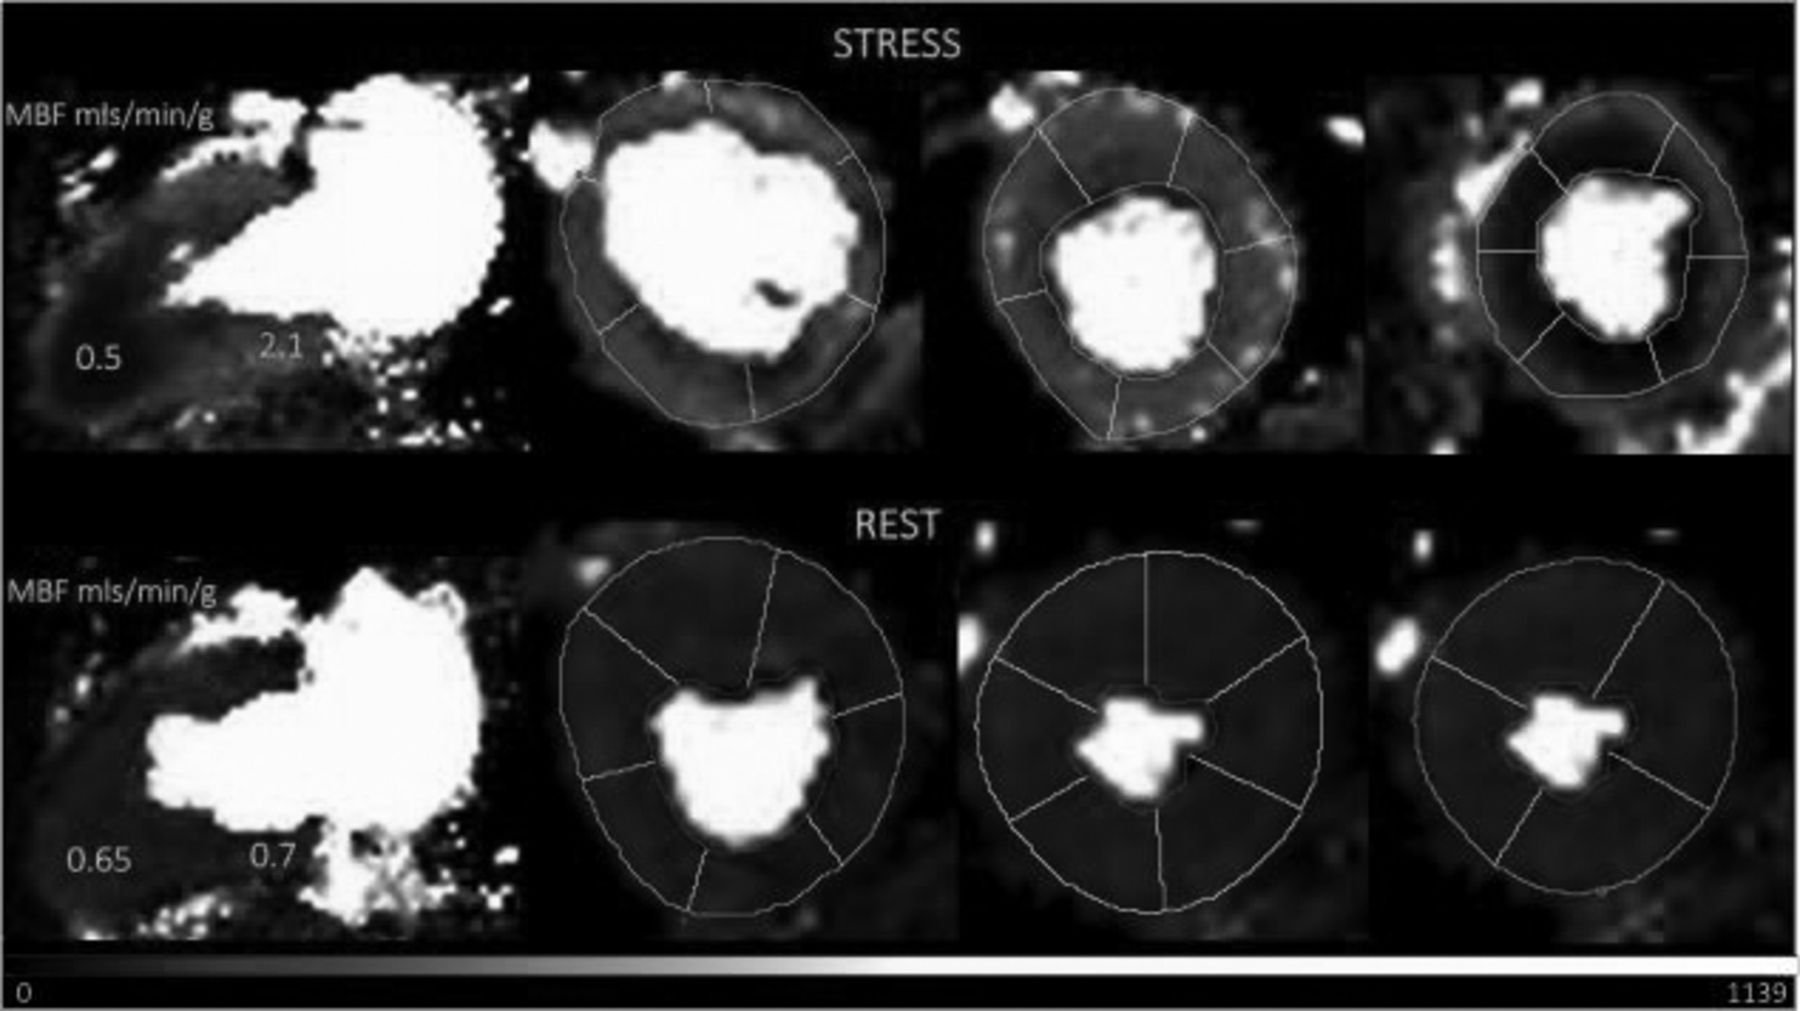
Perfusion map in apical HCM. Long axis (far left) and basal-mid-apical short axis slices (to the right) at stress (upper panel) and rest (lower panel). There is a circumferential endocardial perfusion defect in the apical segments at stress. Each pixel represents myocardial blood flow (MBF). MBF falls in the apical segments during stress.