Article Text

Statistics from Altmetric.com
There is considerable evidence to support the beneficial effects of exercise on cardiovascular health. However, it remains controversial whether physical exertion in the workplace provides the same benefit as sports physical activity (PA). In a study of 3576 employed men with no cardiovascular disease (CVD) at baseline, low levels of occupational PA were associated with a higher risk of CVD events over a median follow-up of 14 years compared with those with moderate occupational PA (1.66, 95% CI 1.06 to 2.59) but higher levels of occupational PA were not associated with a reduced risk of CVD.1 Congruent with previous studies, sports PA was associated with reduced CVD event rates but the protective effect of sports PA was only seen in sedentary workers. Paradoxically, men with high levels of occupational PA who also engaged in recommended levels of sports PA paradoxically had higher CVD event rates (table 1).2
Risk factors-adjusted HRs (with 95% CIs) for SpPA in different OPA categories, and test for SpPA–OPA interaction on the incidence of CHD and CVD events
In the accompanying editorial, Coenen1 suggests several possible explanations for this apparent paradox including differences in the duration or intensity of occupational versus sports PA, inadequate recovery times after activity, confounding lifestyle factors or methodological limitations in self-reporting of activity compared with accelerometer data. Even so, he concludes: ‘The benefits of being physical active are apparent and undeniable in primary and secondary (cardiovascular) disease prevention. However, it appears important that clinicians (including cardiologists) and other healthcare practitioners (eg, general practitioners, occupational physicians and physical therapists) distinguish leisure time from occupational physical activity. Moreover, among these practitioners, a particular focus on vulnerable groups (with lower fitness and underlying diseases and from lower socioeconomic position) is needed. An important implication is that practitioners should be aware of the occupational demands of their patients and incorporate this in their messages towards preventing disease by integrating physical activity in clinical practice.’
Treatment of hypertension is an essential element of primary prevention of CVD. Yet, the validity of using blood pressure (BP) measurements in the office at a single point in time to determine the need for and efficacy of hypertension therapy is questionable. In order to estimate the prevalence of ‘white coat’ hypertension, BP was measured in 1000 subjects after 5 min of rest, with repeat measurement every 2 min for a total of four measurements.3 When the initial BP was compared with the mean of the subsequent three measurements, 34.3% of the patients initially diagnosed as hypertensive were reclassified as normotensive—so-called ‘white coat’ hypertension. Conversely, 3.4% of normotensive patients were reclassified as hypertensive (eg, ‘masked’ hypertension), with hypertension defined as a systolic BP ≥140 or a diastolic BP ≥90 mm Hg (figure 1).

Flow sheet of patients included. AHT, history of hypertension; fBPM, first office blood pressure measurement; No AHT, no history of hypertension; SHT, sustained hypertension; SNT, sustained normotension; SMTH, short-term masked hypertension; STWCH, short-term white coat hypertension.
Although Lavie and co-authors4 agree with the authors that using a single BP measurement is suboptimal, they suggest we need to go even further in our efforts to improve accuracy of hypertension diagnosis. ‘Although multiple office BP measurements may be preferred to single office measurements as demonstrated by Burkard et al,3 clearly BP measurements outside of the office are needed to assess masked HTN, white coat HTN, as well as improve patient engagement and lifestyle interventions. The increased use of technology continues to advance the treatment of many chronic diseases, and certainly digital tools are needed to improve both patient engagement and BP control in the modern era’ (figure 2).
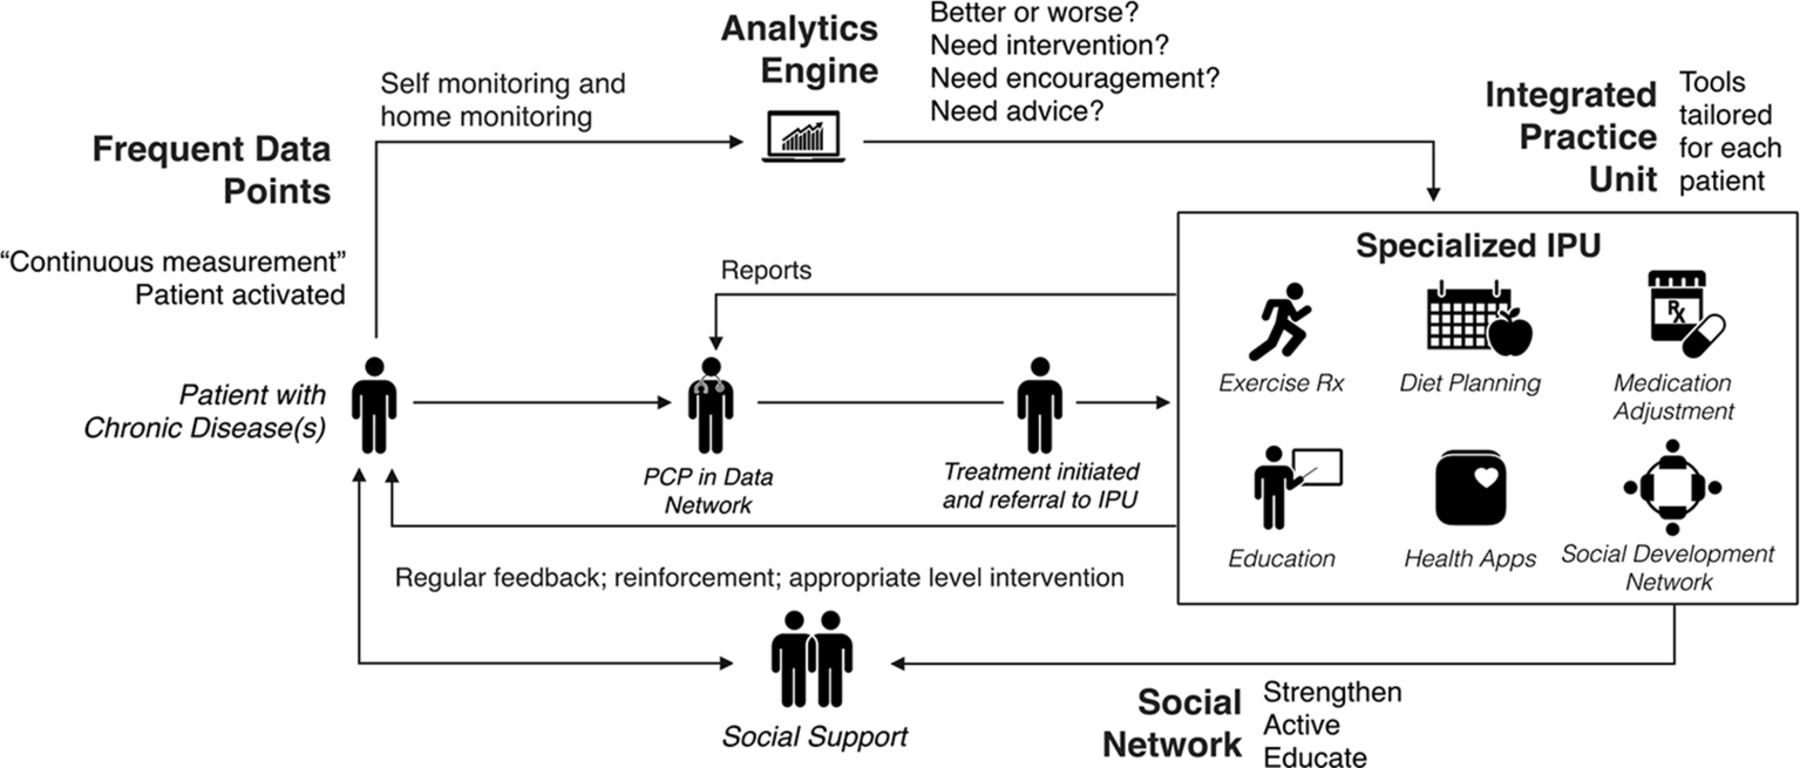
Use of patient-generated health data in conjunction with an integrated practice unit in the management of hypertension. PCP, primary care physician. Reproduced from Milani et al.8
Women with hypertensive disorders of pregnancy are at increased long-term risk of CVD. However, short-term CVD risk after a pregnancy complicated by a hypertensive disorder has not been well studied. Based on administrative hospital discharge data from Florida, Jarvie and colleagues5 examined the risk of readmission for CVD disease within 3 years for almost 1.5 million delivering mothers of single infants. The CVD readmission rates were higher in women with a hypertensive disorder of pregnancy (6.4 vs 2.5/1000 deliveries; p<0.001): a difference that persisted on multivariate analysis (OR 2.41; 95% CI 2.08 to 2.80). In addition, African-American women had higher rates of CVD readmission compared with whites, even after adjustment for hypertensive disorders of pregnancy (OR 3.60; 95% CI 3.32 to 3.90) (figure 3). These data emphasise the need for appropriate primary prevention of CVD and close follow-up in women who experience a hypertensive disorder of pregnancy.

Risk of cardiovascular readmission within 3 years of delivery for individual predictors. All ORs presented were calculated in the full multivariate model that included interaction terms. Reference group values are not illustrated. Only predictors that were statistically significant are illustrated. Covariates included in the model that did not reach statistical significance (not illustrated): other race/ethnicity, transfusion, gestational diabetes mellitus, chronic hypertension, diabetes. *OR value was too large for current scale. COPD, chronic obstructive pulmonary disease.
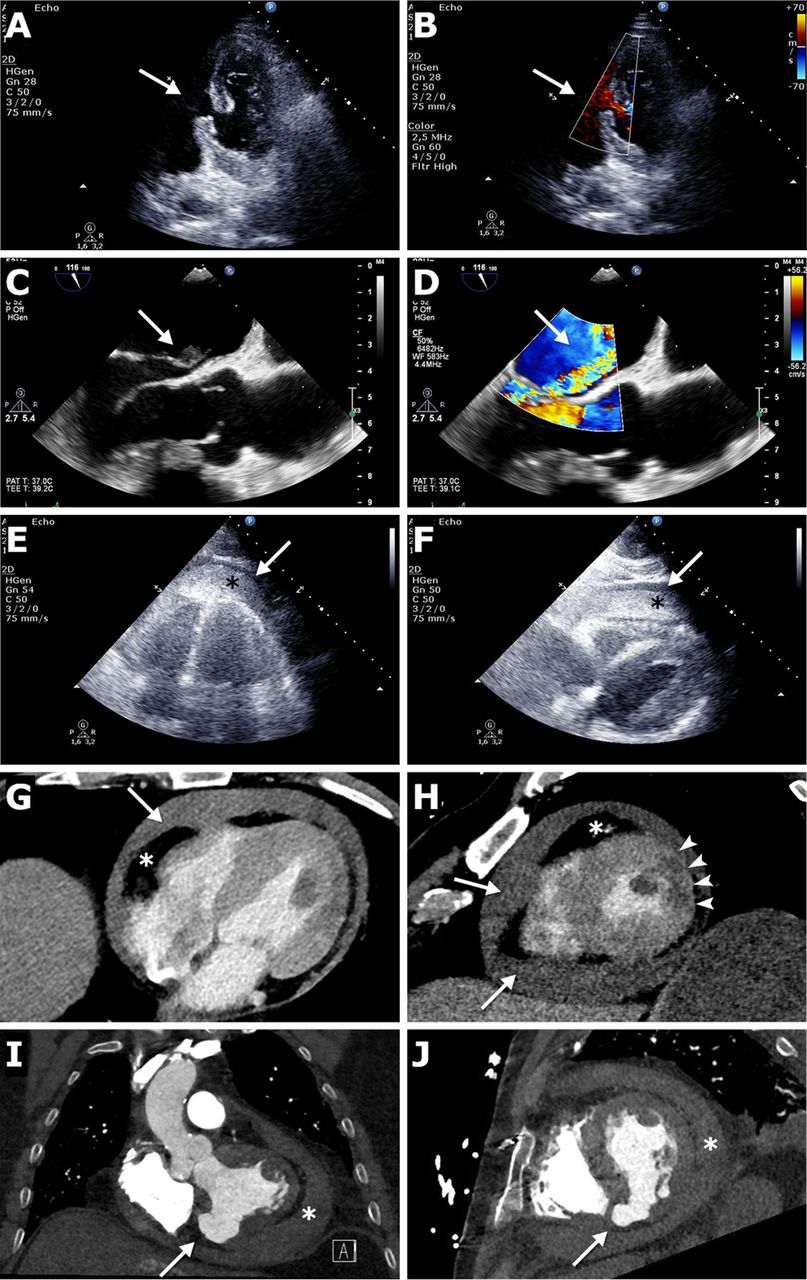
The Education in Heart article in this issue summarises the clinical presentation and management of mechanical complications of myocardial infarction (figure 4).6
Non-invasive imaging of mechanical complications of AMI requiring immediate action. (A) VSR, two-dimensional TTE. A4C view. The rupture of the interventricular septum is visible (arrow). (B) VSR, same patient as in (A), same view. Colour Doppler indicates the defect with left-to-right shunting (arrow). (C) PMR, TEE, ME LAX view. Excessive flail of the posterior mitral leaflet. Note the ruptured papillary muscle head in the LA (arrow). (D) PMR, same patient as in (C), same view. Colour Doppler shows the jet of mitral regurgitation (arrow). (E) FWR, bedside TTE, A4C view. Note the circular haematoma (asterisk) and fluid (arrow) in the pericardial cavity. (F) FWR, bedside TTE, subcostal view, same patient as in (E). Lateral LV infarction. Note the massive intrapericardial haematoma (asterisk) and fluid (arrow) compressing the RV. (G) Emergency CTA in FWR. Axial image demonstrating fluid in the pericardial cavity (arrow). The radiodensity is around 50 HU, characteristic for blood. The epicardial fat is marked with an asterisk. (H) Short-axis reconstruction, same patient as in (G). The infarct area (darker-grey region, marked with arrowheads) is clearly visible. Note the circular pericardial effusion (arrows). The epicardial fat is marked with an asterisk. (I) CTA findings consistent with an LV pseudoaneurysm. The patient underwent CABG 25 years earlier. Coronal image demonstrates a contained rupture of the inferior wall of the LV myocardium (arrow). Note the circular pericardial haematoma (asterisk). (J) Same patient as in (I). Short-axis reconstruction helps localising the defect (arrow). The pericardial haematoma is marked with an asterisk. AMI, acute myocardial infarction; A4C, apical four chamber; CABG, coronary artery bypass grafting; CTA, CT angiography; FWR, free wall rupture; HU, Hounsfield unit; LA, left atrium; LV, left ventricular; ME LAX, mid-oesophageal long axis; PMR, papillary muscle rupture; RV, right ventricle; TEE, transoesophageal echocardiography; TTE, transthoracic echocardiography; VSR, ventricular septal rupture.
The Image Challenge in this issue shows dramatic ECG changes in an athlete and discusses how to interpret this finding. Be sure to encourage your cardiology trainees to submit Image Challenge questions. No doubt you all see interesting images in your clinical practice every day—share them with others in this educational format!7
Footnotes
Competing interests None declared.
Patient consent Not required.
Provenance and peer review Commissioned; internally peer reviewed.