Article Text

Statistics from Altmetric.com
A common question from primary providers is whether an ECG showing a right or left bundle branch block (RBBB or LBBB) is a cause for concern. Rasmussen et al 1 estimated HRs and absolute risk of cardiovascular (CV) outcomes in over 200 000 individuals in whom 0.4% had an LBBB and 2.6% had an RBBB on ECG. Over a median follow-up of 7.8 years, the risk of heart failure was higher when LBBB was present both in men (HR 3.96, 95% CI 3.30 to 4.76) and women (HR 2.51, 95% CI 2.15 to 2.94) with a weaker association between heart failure and RBBB. In contrast, RBBB was more strongly associated with risk of pacemaker implantation in both men (HR 3.26, 95% CI 2.74 to 3.89) and women (HR 3.69, 95% CI 2.91 to 4.67). From these data, the authors provide a risk chart for heart failure and pacemaker implantation by ECG findings (figure 1).

Risk chart depicting 10-year absolute risks of heart failure and pacemaker implantation by age group, sex and block type. Risk estimates are stratified by the presence of comorbidity at time of ECG recording. BBB, bundle branch block; IRBBB, incomplete right bundle branch block; LBBB, left bundle branch block; NIVCD, non-specific intraventricular conduction defect; RBBB, right bundle branch block.
In an editorial, Sridhar and Padala2 summarise the previous literature on the association between LBBB and CV outcomes including a detailed table of previous studies (online supplementary file 1). Although the association of LBBB with adverse outcomes has been previously described, the association of RBBB with heart failure and the need for pacemaker implantation is novel data. They propose several possible mechanisms for this association including RBBB being a marker of underlying myocardial disease, serving as a nidus for tachycardia initiation, or causing mechanical desynchrony. However, given the prevalence of RBBB in the population and the low event rates, careful study is needed to determine if monitoring these patients would be effective and affordable, compared with routine clinical care.
Supplementary file 1
Cardiologists often are consulted regarding the potential CV risk associated with medications used to treat non-cardiac conditions. In particular, the apparent association of valve dysfunction with medications affecting serotonergic pathways has been controversial. In a meta-analysis, Fortier et al 3 found an increased risk of valve disease in patients taking serotonergic medications (OR 3.30, 95% CI 1.99 to 5.49) or dopaminergic medications (OR 2.56, 95% CI 1.68 to 3.91) (figure 2). Although results were consistently significant, most studies were observational and retrospective with considerable variability and heterogenetic between studies.

Forest plots of the odds of developing valvular heart disease (VHD) comparing patients who were exposed or not exposed to any serotonergic medication.
In an editorial, De Backer and Timmermans4 review the potential mechanism of drug-induced valvular heart disease (DIVHD). ‘DIVHD is mediated through 5-hydroxytryptamine receptor (5-HT) 2B signalling, and agents or their metabolites that specifically interact with this receptor are therefore most likely to be at highest risk for DIVHD. Signalling through the 5-HT 2B receptor was shown to elicit mitogenic and secretory responses in ventricular and heart valve interstitial cells. Moreover, 5-HT 2B signalling has been demonstrated in human mitral valve prolapse and might contribute to pathological remodelling of mitral valve prolapse’. They also remind us that ‘DIVHD is clinical reality, and it should be considered in patients with no clear explanation for having valves with leaflet thickening and restrictive, non-calcified features progressively resulting in valvular regurgitation and/or valvular stenosis’.
There is overlap between risk factors for bleeding and ischaemic events after acute myocardial infarction (MI), yet identifying the balance of risk for ischaemic events versus bleeding in managing an individual patient is challenging. In order to better understand which risk factor combinations are associated with differing clinical outcomes, Lindholm et al looked at a nationwide Swedish registry of >100 000 patients with an invasively managed MI in whom 20.6% had ischaemic events and 5.6% suffered a major bleeding episode.5 Six risk factors were considered: age ≥65 years, chronic kidney disease, diabetes, multivessel disease, prior bleeding and prior MI. All six factors were associated with ischaemic events, with a stepwise higher risk for increasing numbers of risk factors. All but prior MI were associated with major bleeding, although risk was mainly driven by a history of major bleeding. The association of specific risk factors and number of risk factors with clinical outcomes is shown in figure 3.

Combinations of risk factors and incidence of ischaemic and bleeding events. Panel (A) shows combinations of risk factors (in patients with at least one risk factor). Each black bar represents a combination of risk factors and indicates how many patients have that specific combination. The dots below the black bars indicate which risk factors are present in that group. The blue bars represent the total number of patients having each risk factor. The coloured inset (top right) shows the distribution of risk factor counts in the population. In panel (B), the incidence rates for major bleeding (X axis) and CVD/MI/stroke (Y axis) in relation to combinations of risk factors are shown (lines indicate 95% CIs). In panel (C), the risk factor combinations that do not include prior bleeding are highlighted. (Panels A–C (except inset) include risk factor combinations with at least 30 patients.) CKD, chronic kidney disease; CVD, cardiovascular disease; GE, greater than or equal to; MI, myocardial infarction; MVD, multivessel disease.
Darmon and Ducrocq6 support the concept of concomitant evaluation of ischaemic and bleeding risks, such as the approach proposed by Lindholm et al.5 Advantages of the current proposal, compared with previous combined risk scores, are the separation of prior bleeding from other elements in the risk score, simplicity of risk score calculation and validation in a large real-world registry rather than in selected subjects from randomised clinical trials. They conclude that comparing risk of ischaemic and bleeding events ‘is even more important when considering that preventing an ischaemic event with an optimised antithrombotic strategy would be underappreciated from the patient’s and physician’s point of view, while inducing a major bleed (or even repeated minor bleeding), would be entirely attributed to treatment’. The approach developed by Lindholm et al 5 may help when evaluating the risk-benefit balance according to the patient’s risk profile.
The Education in Heart article in this issue7 discusses non-invasive measurements of arterial function with practical advice on making these measurements and using them in research studies and in clinical practice.
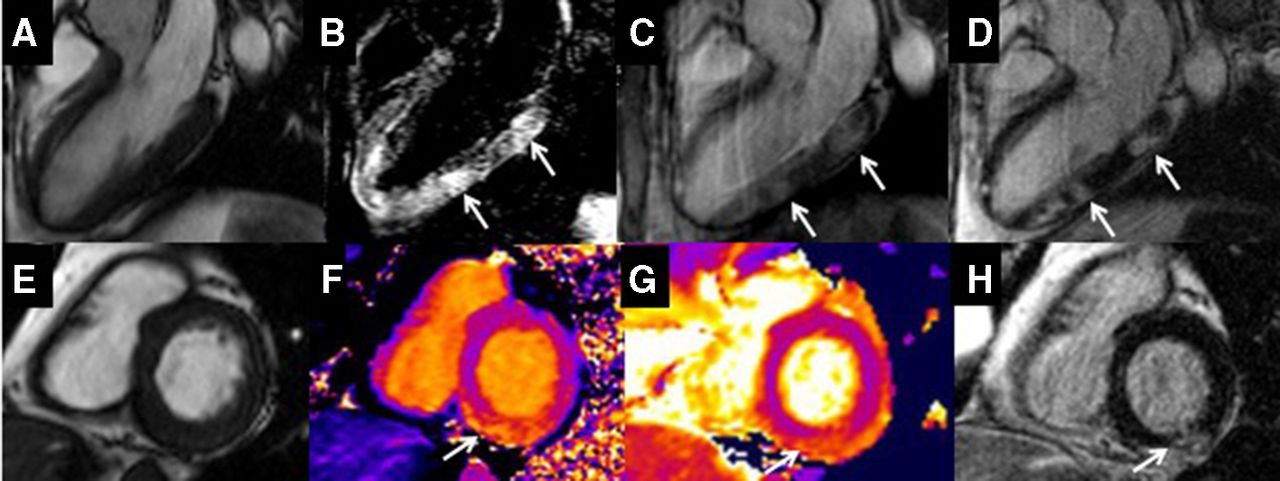
The Image Challenge question8 ask you to interpret the cardiac magnetic resonance images to determine the cause of myocardial infarction with normal coronary arteries in a patient with ulcerative colitis (figure 4).

(A) Balanced steady-state free precession (bSSFP) left ventricular long-axis, three-chamber view. (B) T2 short-tau inversion recovery. (C) Early gadolinium enhancement demonstrating high signal intensity indicative of hyperaemia with capillary leakage (arrowed). (D) Late gadolinium enhancement with high signal intensity indicative of increased extracellular space (arrowed). (E) bSSFP left ventricular short-axis view. (F) Native myocardial T1 mapping with elevated native T1 mapping values in the inferior wall (arrowed). (G) Native myocardial T2 mapping with elevated native T2 values in the inferior wall, indicative of oedema (arrowed). (H) Late gadolinium enhancement with high signal intensity indicative of increased extracellular space (arrowed).
Footnotes
Competing interests None declared.
Provenance and peer review Commissioned; internally peer reviewed.
Patient consent for publication Not required.