Article Text

Abstract
Objectives To explore blood pressure (BP) in athletes at preparticipation evaluation (PPE) in the context of recently updated US and European hypertension guidelines, and to determine the relationship between BP and left ventricular (LV) remodelling.
Methods In this retrospective study, athletes aged 13–35 years who underwent PPE facilitated by the Stanford Sports Cardiology programme were considered. Resting BP was measured in both arms; repeated once if ≥140/90 mm Hg. Athletes with abnormal ECGs or known hypertension were excluded. BP was categorised per US/European hypertension guidelines. In a separate cohort of athletes undergoing routine PPE echocardiography, we explored the relationship between BP and LV remodelling (LV mass, mass/volume ratio, sphericity index) and LV function.
Results In cohort 1 (n=2733, 65.5% male), 34.3% of athletes exceeded US hypertension thresholds. Male sex (B=3.17, p<0.001), body mass index (BMI) (B=0.80, p<0.001) and height (B=0.25, p<0.001) were the strongest independent correlates of systolic BP. In the second cohort (n=304, ages 17–26), systolic BP was an independent correlate of LV mass/volume ratio (B=0.002, p=0.001). LV longitudinal strain was similar across BP categories, while higher BP was associated with slower early diastolic relaxation.
Conclusion In a large contemporary cohort of athletes, one-third presented with BP levels above the current US guidelines’ thresholds for hypertension, highlighting that lowering the BP thresholds at PPE warrants careful consideration as well as efforts to standardise measurements. Higher systolic BP was associated with male sex, BMI and height and with LV remodelling and diastolic function, suggesting elevated BP in athletes during PPE may signify a clinically relevant condition.
- Echocardiography
- Hypertension
- Cardiac Risk Factors And Prevention
Statistics from Altmetric.com
Introduction
Regular physical activity lowers blood pressure (BP) and is an effective strategy for the prevention and treatment of hypertension (HTN).1 2 However, there are reports of a substantial proportion of athletes fulfilling diagnostic criteria for HTN.3 Importantly, as increased BP in youth is prognostic of the development of cardiovascular disease,4 5 screening for HTN in young athletes may have implications for primary prevention. US guidelines have recently revised the thresholds for diagnosing HTN from ≥140/90 to ≥130/80 mm Hg in adults6 and adolescents.7 In contrast, European guidelines currently recommend ≥140/90 mm Hg as the thresholds defining HTN in adults,8 as do current guidelines for diagnosing HTN in athletes.9 The Stanford Sports Cardiology programme has facilitated preparticipation evaluation (PPE) for precollege, college and professional athletes for the last decade. The lowering of thresholds for HTN at PPE may identify athletes with higher cardiovascular risk, providing an opportunity for primary prevention. This needs to be balanced by the fact that these thresholds used in the new US guidelines may result in higher number of athletes being referred for unnecessary HTN monitoring.10 Furthermore, methodology in the assessment of BP at PPE may play a role in the interpretation of these data.
One consequence of chronically elevated BP is left ventricular (LV) remodelling, with increased LV mass (LVM) and concentric remodelling, leading to LV dysfunction.11 12 There is evidence of an impact of BP and HTN on cardiac remodelling and function already in children.13 14 LV remodelling is also an established feature of the athlete’s heart,15 16 however the physiological remodelling is proportional and the LV mass/volume ratio (MVR) and LV function are maintained.17 18 Thus, considering the LV remodelling pattern in addition to LVM could provide insight as to the clinical significance of BP assessed during PPE.
The objectives of our study were (i) to evaluate BP measured during PPE in a large heterogeneous cohort of young athletes in the context of recently updated HTN guidelines, (ii) to explore the demographic and anthropomorphic determinants of BP in this population and (iii) to evaluate the impact of BP on LV remodelling and function in a group of college athletes.
Methods
Study design
This retrospective study was composed of two cohorts (see online supplementary figure 1). All athletes who underwent PPE within the Stanford Clinical PPE Programme between years 2010 and 2016 were considered in cohort 1. This included precollege, college and professional athletes. Inclusion criteria were: (i) age 13–35 years; (ii) complete records for (a) resting BP, (b) type of sport and (c) demographics. Exclusion criteria were (i) initial ECG findings requiring follow-up, regardless of final pathology or not; (ii) a previous diagnosis of HTN and/or current BP medication.
Supplemental material
Cohort 2 included athletes who underwent routine echocardiography as part of the Stanford PPE Screening Programme between 2008 and 2016. We included athletes with (i) image quality allowing for calculation of LVM and volume; (ii) records of (a) resting BP the same day echocardiography and (b) demographic and anthropomorphic measures. Exclusion criteria were (i) known HTN and/or current BP medication or (ii) pathological findings on echocardiogram. For the purpose of this study, the term ‘football’ describes American-style gridiron football, and ‘soccer’ describes the sport in Europe termed football. All participants signed a consent form approved by the institutional review board at Stanford University.
Preparticipation clinical evaluation
PPE was performed by experienced medical personnel (a sports cardiologist with support by nurses) either at Stanford University (collegiate athletes), at the athlete’s sport club (professional athletes) or in a community setting (precollege athletes), adopting the AHA 14-Element model19 (personal/family history and physical examination) with the addition of a 12-lead ECG. Height and weight were measured, and ethnicity was self-reported. The final determination and follow-up of PPE results, including ECGs, were made by an experienced sports cardiologist.
Measurement and classification of blood pressure
Resting BP was obtained at the time of PPE (cohort 1) or at the echocardiographic examination (cohort 2) using standard protocols.9 20 Briefly, BP was measured in both arms using an automated oscillometric cuff positioned at the level of the heart (in a majority of observations with Spot Vital Signs, WelAllynlyn, New York, USA), assuring proper cuff-size. Subjects were positioned seated with the forearm rested flat on a supportive surface after at least 5 min of rest. The higher value in either arm was reported, and in cases of which the initial reading was ≥140/90 mm Hg, BP was remeasured in both arms. If still exceeding 140/90 mm Hg after remeasurement, follow-up was recommended with the primary care or sports physician.
BP was categorised per the 2017 US (American Heart Association/American College of Cardiology) and 2018 European (European Society of Cardiology) guidelines for HTN (figure 1A).6 8

Current thresholds for categorising blood pressure according to US (American Heart Association/American College of Cardiology (AHA/ACC)) and European (European Society of Cardiology (ESC)) guidelines (panel A) and the proportion of athletes in each blood pressure category according to respective set of guidelines, overall and for each sex (panel B). In panel C, the relationship between systolic and diastolic blood pressure is visualised, where background colour corresponds to the different blood pressure thresholds in the US guidelines. Solid line indicates linear regression line and dashed lines upper and lower limits of the individual CI.
Athletic echocardiography screening protocol
Echocardiography was performed using a commercially available system (iE33; Philips Medical Imaging, Andover, Massachusetts, USA). The echocardiographic protocol included two-dimensional and colour Doppler images in parasternal and apical views. Images were analysed Xcelera workstations. Standard measures of LV size, LV ejection fraction (LVEF) and diastolic parameters were performed. LVM and volume (LVEDV) were calculated using the area-length method in end-diastole from short-axis and apical 4-chamber images and indexed to body surface area (BSA). MVR was derived by dividing LVM and LVEDV.21 In diastole, the relative wall thickness (RWT) was calculated from short-axis images as ((2×average wall thickness)/LV diameter) and LV sphericity index was determined as (LV length in the apical 4-chamber view/LV diameter in short-axis view). Mid-wall Lagrangian longitudinal strain (LS, %) was calculated from apical 4-chamber images by manual tracings of ventricular length ((L1−L0)/L0×100), where L1 represents end-systolic and L0 represents end-diastolic wall length.22
Statistical analysis
Continuous data were expressed as mean±SD, categorical data as number of observations and frequency. For BP, upper 95th percentiles were calculated. Differences between groups were evaluated using one-way analysis of variance or Student’s t-test for continuous variables and Χ² test for categorical variables. P values <0.05 were considered to be statistically significant. Relationships between BP and descriptive variables were explored using bivariate correlation, univariate linear regression and multiple stepwise linear regression analysis. For regression analyses, unstandardised B-coefficients with 95% CIs are presented. IBM SPSS Statistics for Windows, V.25.0 (IBM, Armonk, New York, USA) was used for statistical analysis.
Results
Stanford clinical PPE cohort
In total, 2733 athletes (table 1) were included after excluding four athletes with previously diagnosed HTN, 95 athletes with initial ECG readings suggesting further follow-up (see online supplementary figure 2), 30 athletes aged >35 years and 147 athletes aged <13 years. Thirty-five different sports were represented (see online supplementary table 1). Overall, 52.3% of athletes engaged in either of football (15.1%), soccer (13.5%), rowing (8.8%), basketball (7.9%) or baseball (7.0%). Professional athletes differed demographically from others in that 89.0% were football players, 97.2% were male and 58.7% were of African-American decent.
Supplemental material
Supplemental material
Characteristics of 2733 athletes presented by seniority level
Average SBP was higher in males than in females at all seniority levels, while DBP only differed between sexes in college athletes (figure 2). In unadjusted analysis, average SBP varied from 117±11 and 117±12 mm Hg in soccer players and cross-country runners, respectively, to 125±14 mm Hg in football players, which was associated with a corresponding difference in age between sports (figure 3). There was no difference in BP between male football players at a college versus professional level; overall or in subgroups of athletes of either Caucasian or Afro-American ethnicity (see online supplementary table 2).

The distribution of systolic blood pressure (SBP) in male (blue) and female (red) athletes with mean values (SD) presented for each sex (panel A). In panels B and C, violin plots of the distribution as well as the 25th, 50th and 75th percentiles for SBP and diastolic blood pressure (DBP) across seniority level for males (blue) and females (red) are presented. P values at the top of each panel for difference between seniority level in females (red) and males (blue), and for difference between sexes at each level at bottom of each panel.

Mean systolic blood pressure (SBP) in all sports with ≥40 athletes, in relation to average age per sport. Circle area is proportional to the number of athletes in each sports category (reference: sailing n=40, soccer n=368) and circle colour indicate the proportion of males in each sport category, as explained in imposed legend.
Of all athletes, 34.3% (n=938) and 8.8% (n=241) had an SBP and/or DBP exceeding the HTN thresholds in the US and European guidelines, respectively (figure 1B). With the US guidelines, 6.6 times as many females (22% vs 3.3%) and 3.4 times as many males (42% vs 12.5%) exceeded the threshold for HTN compared with using European guidelines. Out of the athletes with a BP exceeding any threshold for HTN by the US guidelines, 38.9% fulfilled only SBP criteria (ie, DBP <80 mm Hg), 34.6% only DBP criteria (ie, SBP <130 mm Hg) and 26.5% fulfilled both criteria (figure 1C). Details on the number of athletes by seniority level and sex exceeding respective threshold is presented online supplementary figure 3.
Supplemental material
Male sex, age, height, weight, BMI and Afro-American decent were all weak to moderate, unadjusted correlates of BP, with stronger correlations to SBP than DBP (see online supplementary table 3). When adjusting for sex, age, Afro-American ethnicity, height and BMI, age had no independent association with SBP and BMI was the only factor associated with SBP in all seniority levels (table 2). Male sex was positively and Afro-American descent weakly negatively associated with SBP in precollege and college athletes. After excluding professional athletes from the analysis, age was weakly associated with SBP (B (95% CI)=0.47 (0.24 to 0.70), p<0.001) with minimal effect on other associations (see online supplementary table 4).
Independent predictors of systolic blood pressure (mm Hg)
Stanford PPE screening cohort
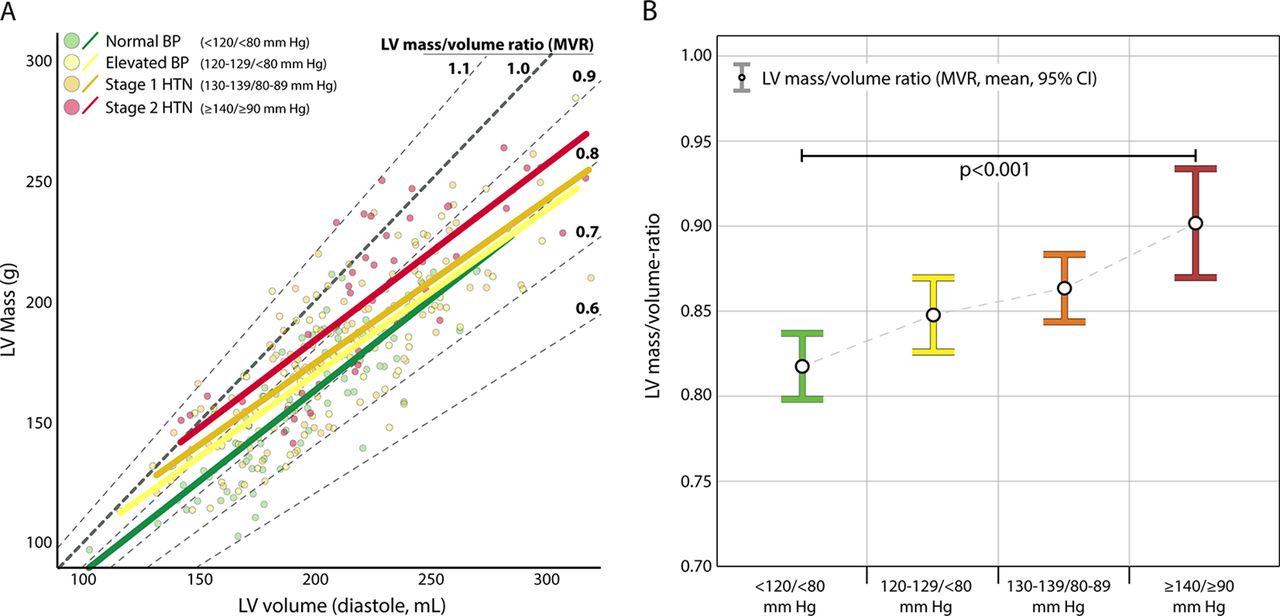
In the 304 college athletes (aged 17–26 years) in cohort 2 (table 3), there were 219 football players (all male), 43 basketball players (20 male) and 42 volleyball players (25 male). Overall, 139 (45.7%) athletes had a BP ≥130 and/or ≥80 mm Hg and 43 (14.1%, all male) had a BP ≥140 and/or ≥90 mm Hg. Athletes in higher BP categories had higher BMI, were more likely football players and male and they had larger absolute and indexed LVM. RWT and MVR were greater in higher BP categories (both p<0.001), while sphericity index was similar across groups (p=0.391). The difference in MVR between groups is visualised in figure 4. There was no difference in LV function as measured by LVEF and LV LS between groups, while early and late diastolic (E/A) ratio was lower with increasing BP (p<0.001) and there were trends towards lower e’ and E-wave velocity in higher BP groups (p=0.105 and 0.102, respectively).
Characteristics and echocardiographic measures in 304 collegiate athletes at routine preparticipation echocardiographic screening, presented by blood pressure categories
Bivariate, unadjusted correlations between BP and LV parameters are presented in online supplementary table 5. In adjusted analyses, multiple stepwise regression (entering sex, age, Afro-American descent, height, BMI, SBP and DBP as independent variables), resulted in a model for MVR (R² 0.21, p<0.001) including Afro-American descent (B (95% CI)=0.08 (0.06 to 0.10), p<0.001), BMI (B=0.004 (95% CI 0.002 to 0.006), p=0.001) and SBP (B=0.002 (95% CI 0.001 to 0.002), p=0.001). For LVM, the model (R²=0.56, p<0.001) included BMI (B=3.56 (95% CI 2.94 to 4.18), p<0.001), height (B=1.66 (95% CI 1.30 to 2.02), p<0.001), male sex (B=20.49 (95% CI 11.41 to 29.58), p<0.001) and Afro-American descent (B=7.10 (95% CI 0.94 to 13.26), p=0.024).
Discussion
The main finding of our study is that in a large cohort of athletes undergoing PPE, BP exceeded the thresholds recommended in the new US guidelines in one-third of athletes, four times as many as with the European guidelines. Although mean BP increased with seniority level, height, BMI and sex rather than age appeared to explain the variability in SBP. Furthermore, we observed that athletes in higher BP categories presented with a greater degree of concentric LV remodelling (greater MVR) and with differences in diastolic function as compared with those in lower BP categories.
BP in relation to recent HTN guidelines
There was a large discrepancy in the number of athletes exceeding the thresholds defining HTN using the current US versus European guidelines (34.3% vs 8.8%), especially in females (22.0% vs 3.3%). This reflects the fact that many of the athletes in our cohort had SBP between 130 and 140 mm Hg and/or DBP between 80 and 90 mm Hg (figure 1C). Current recommendations for BP measurement and HTN management in athletes (published in 2015),9 based on the now former US guidelines,20 recommend that an initial reading of ≥140/≥90 mm Hg (8.8% in our cohort) should be followed up for HTN. Thus, adopting the thresholds in the new US guidelines for BP screening could have a large impact on the number of athletes recommended for follow-up for HTN.
A clinical diagnosis of HTN is based on BP measurements on at least two separate occasions,6–8 which precludes a HTN diagnosis for the athletes in our study. The comprehensive recommendations for BP measurement standardisation within the guidelines6 8 can be challenging to adopt, or fully adhere to in the PPE setting, which may be reflected in the large variability in the protocols used for BP measurement across previous studies reporting BP in athletes.3 Although the PPE situation may vary considerably between institutions and countries, common difficulties in acquiring optimal BP measurements include logistic issues (time constraints, many athletes or a team screened at a single occasion) as well as the sometimes stressful, unfamiliar environment for the athlete. By adding ambulatory BP measurements to screening BP in athletes, studies have reported a high prevalence of both white coat HTN23 as well as masked HTN.23 24 Thus, a second BP measurement on a separate day (when feasible) or remeasuring BP in all athletes with an initial reading of ≥130/≥80 mm Hg would probably result in lower reported BP values. If lower BP thresholds are to be introduced at PPE, this should come with a high level of adherence to the strict standardisation of BP measurements advocated by the guidelines.6 8 9 While the findings of the current study need to be interpreted in the context of the ongoing challenges in standardisation, our results clearly demonstrate the impact of adapting different thresholds for defining elevated BP or HTN during PPE. While this screening has continuously evolved to more reliably detect underlying cardiac diseases predisposing athletes to sudden cardiac death,19 we would like to offer a note of caution before implementing thresholds derived from and evaluated in other settings, without also adopting stricter protocols for measurement.4 6 7
Factors associated with BP in youth and in young athletes
SBP increased from precollege to professional athletes, paralleled by an increase in age, height, weight and BMI. Male sex was associated with higher SBP at all seniority levels. While height and BMI were the strongest independent predictors of SBP in our cohort, age was not associated with SBP in adjusted analysis. Our cohort appears representative of contemporary athletes with mean SBP consistent with the averages from 51 original articles on BP in athletes summarised in a meta-analysis by Berge et al 3: 114/72 mm Hg (females) and 121/75 mm Hg (males), with only marginally higher values in the current study.3
The association between height and BP in children and adolescents is established,7 as is the higher prevalence of HTN in young subjects with high BMI.14 25 26 Direct comparison between the prevalence of HTN in our athletes to a general young adult or adolescent US population is difficult, considering the use of different definitions of HTN over time and between studies.7 25 In 761 subjects aged 12–17 years from the National Health and Nutrition Examination Survey,25 the prevalence of either high or borderline high BP was 15%, similar to what has been reported in urban student athletes.26 The proportion of athletes exceeding the updated, lower thresholds for HTN in our group of precollege athletes was 36.5% in males and 25.5% in females, respectively. These data reinforce a concerning prevalence for elevated BP in the adolescent population and highlights that athletic populations are not immune to cardiovascular risk factors. As both BMI and BP in adolescence and young adulthood have been coupled to adult cardiovascular disease and mortality,4 PPE in this population may represent an opportunity for early intervention.
Cardiac remodelling in athletes in relation to BP
Greater LVM and LVEDV is a common finding in competitive athletes when compared with untrained subjects,15 and is considered to represent a physiological remodelling in response to repeated volume load during endurance exercise training.16 This remodelling is generally reported as proportional, represented by similar wall/cavity ratio (RWT)15 27 and MVR17 28 as in untrained subjects. While MVR and RWT in the athletes of the current study were within normal limits compared with previous observations,21 athletes with higher BP had higher MVR and RWT than those with lower BP. In addition, SBP assessed during PPE was linearly associated with MVR independently of ethnicity and BMI.
BP level measured in healthy non-athletic children and adolescents has previously been shown to correlate with LV mass13 14 as well as to LV concentric remodelling,14 and recently to predict adult LV concentric hypertrophy.29 In addition, Trachsel et al 24 reported higher MVR in middle-aged marathon runners with masked HTN than in normotensive runners.24 Our results extend these previous findings to a group of young, presumptuously healthy athletes, suggesting that the process of adverse cardiac remodelling from chronically elevated BP may begin as early as college level. In addition, although LV systolic function at rest was similar across BP categories, those with higher BP presented with lower E/A ratio and trends towards lower E-wave and e’ velocities, all markers of diastolic function. Diastolic dysfunction is prevalent in hypertensive heart disease, already at a young age30 and is thought to precede more severe LV dysfunction.11 Whether our findings reflect subclinical diastolic dysfunction or if they simply are a physiological marker of increased BP remains to be elucidated.
Limitations
First, the retrospective design holds several limitations. As follow-up was completed by the athlete’s primary healthcare team, we were unable to obtain serial BP measurements and review outcomes in this cohort. Optimally, BP should have been remeasured at the level of 130/80 mm Hg in concordance with the current guidelines. Future study designs should endeavour to include ambulatory or in office measurement to validate our findings. Second, echocardiography findings presented from cohort 2 were from a relatively small cohort (n=304), of which a large proportion were male football players, and will require further validation. Third, ethnicity was self-reported with minimal or no guidance, which is inferior to using guided interviewing or, optimally, genetically determined ancestry. Finally, the use of cardiac MRI would provide a more precise measure of LV remodelling; however, this modality is impractical in PPE and echocardiographic-determined measures can be more readily used in the clinical sports cardiological setting.
Conclusions
Height, BMI and sex (and not age) explained most of the variability in SBP in our large, heterogenous cohort of athletes, in which a substantial proportion of athletes presented with a BP above the threshold for HTN per current US guidelines. The independent associations between BP and cardiac remodelling suggest that elevated BP in athletes during PPE may signify a clinically relevant condition. However, before considering the lower BP thresholds, efforts for standardising BP measurements at PPE need to be undertaken.
The relation between left ventricular (LV) mass and volume in each athlete (panel A), where dot colour represents what blood pressure category each athlete falls into. The linear relationship between LV mass and volume per blood pressure category is illustrated by coloured lines. The grey diagonal lines correspond to different LV mass/volume ratio (MVR) as noted at end of each line. In panel B, average LV mass/volume ratio (with 95% CIs) in each blood pressure category is displayed.
Key questions
What is already known on this subject?
Physical activity is beneficial for primary prevention of hypertension, although smaller previous reports have described relatively high blood pressure in competitive athletes of varying age and sport disciplines.
What might this study add?
This study shows that when applying the recently updated US hypertension thresholds, a third of athletes exceeded these thresholds.
By including athletes over a large age- and body habitus span, we provide insight into the effects of these characteristics on blood pressure in athletes.
In addition, this study shows that blood pressure level already at a young age may have an impact on cardiac morphology and function in athletes.
How might this impact on clinical practice?
Implementing the new US hypertension thresholds at preparticipation evaluation could likely increase the number of athletes for clinical follow-up for hypertension.
This is important to acknowledge when current guidelines for blood pressure measurements and recommendations in athletic populations are revised.
High blood pressure at preparticipation evaluation may, however, represent a clinically relevant phenomenon, and careful considerations are warranted in choosing the appropriate blood pressure level where follow-up is warranted.
Acknowledgments
The authors would like to thank the personnel and volunteers at Stanford Clinical and Echocardiographic Pre-Participation Evaluation programme for their great efforts.
References
Footnotes
KH and KJM contributed equally.
VF and FH contributed equally.
Contributors KH and KJM contributed equally to this study as first authors, and VF and FH contributed equally as senior authors. FH, KH, KJM and VF conceptually planned the study, with valuable additions made by JWC, EA, MA and SPB. EA and VF built the database. KJM and FH performed the echocardiography, and SPB, KJM, KH and FH read and/or extracted the data from digital images to a spreadsheet. VF read all ECGs. KH performed the statistical analyses and drafted the first version of the manuscript. All authors contributed in intellectually reviewing and improving the manuscript and approved the final submitted version. All authors agree to be accountable for all aspects of the work.
Funding General funding from the Division of Cardiovascular Medicine at Stanford Cardiovascular Institute was used to finalise this project. KH received funding from the Swedish Society of Medicine and the Fulbright Commission.
Competing interests None declared.
Ethics approval Stanford Institutional Review Board (IRB no. 25673 and IRB no. 12245).
Provenance and peer review Not commissioned; externally peer reviewed.
Patient consent for publication Not required.
Linked Articles
- Editorial