Article Text

Abstract
Objective To determine the implications of applying guideline-recommended definitions of aortic stenosis to echocardiographic data captured in routine clinical care.
Methods Retrospective observational study of 213 174 patients who underwent transthoracic echocardiographic imaging within Allina Health between January 2013 and October 2017. The sensitivity, specificity, positive predictive value, negative predictive value and accuracy of echocardiographic measures for severe aortic stenosis were determined relative to the documented interpretation of severe aortic stenosis.
Results Among 77 067 patients with complete assessment of the aortic valve, 1219 (1.6%) patients were categorised as having severe aortic stenosis by the echocardiographic reader. Relative to the documented interpretation, aortic valve area (AVA) as a measure of severe aortic stenosis had the high sensitivity (94.1%) but a low positive predictive value (37.5%). Aortic valve peak velocity and mean gradient were specific (>99%), but less sensitive (<70%). A measure incorporating peak velocity, mean gradient and dimensionless index (either by velocity time integral or peak velocity ratio) achieved a balance of sensitivity (92%) and specificity (99%) with little detriment in accuracy relative to peak velocity and mean gradient alone (98.9% vs 99.3%). Using all available data, the proportion of patients whose echocardiogram could be assessed for aortic stenosis was 79.8% as compared with 52.7% by documented interpretation alone.
Conclusion A measure that used dimensionless index in place of AVA addressed discrepancies between quantitative echocardiographic data and the documented interpretation of severe aortic stenosis. These findings highlight the importance of understanding the limitations of clinical data as it relates to quality improvement efforts and pragmatic research design.
- echocardiography
- electronic medical records
Statistics from Altmetric.com
Introduction
Increasingly, imaging data are captured in structured reporting systems that may support queries to identify populations with specific conditions.1 An example opportunity relates to the use of structured data from echocardiographic reporting systems to identify patients with severe aortic stenosis. Linkages of this data to additional clinical and administrative data may facilitate the pragmatic study of emerging valve therapies and novel approaches to care delivery.2 3
Before embarking on these efforts, it is important to understand limitations of structured data captured in routine clinical care. For example, the estimation of aortic valve area (AVA) requires accurate assessment of several echocardiographic parameters. In clinical practice, the interpreting clinician may provide an assessment of stenosis severity on the basis of transaortic velocities and gradients without correcting discordant measures of AVA entered into data fields by the sonographer. As a result, the automated query of echocardiographic data could be misleading. Similarly, automated queries of transaortic velocity and gradients may fail to identify severe aortic stenosis in low flow states.
Comparing aortic valve stenosis severity determined from automated queries of structured echocardiographic data with that of the interpreting clinician may inform an optimal approach to the use of routinely captured echocardiographic data in the study of aortic valve disease. Accordingly, we sought to apply guideline recommended definitions of aortic stenosis to routinely captured quantitative echocardiographic data and assess the diagnostic accuracy of this approach compared with aortic stenosis severity as documented by the interpreting clinician. Furthermore, we determined the ability to categorise aortic stenosis severity from quantitative data when a structured interpretation was not provided.
Methods
Data source
Data for this study were derived from the Allina Health Enterprise Data Warehouse.2 Data on transaortic peak velocity, mean gradient, AVA and indexed AVA (based on velocity time integral (VTI)), dimensionless index (as determined from VTI or peak velocity ratio) and documented category of aortic stenosis were captured in structured echocardiographic reporting platforms and analysed at the level of 2 significant digits for numeric data. Institutional review board approval was obtained for this analysis.
Study setting and patient population
We retrospectively identified the first transthoracic echocardiogram for all 213 602 patients who underwent transthoracic echocardiographic imaging in Allina Health between 1 January 2013 and 31 October 2017 (figure 1). Allina Health provides care to patients in Minnesota and western Wisconsin at 12 hospitals and more than 80 clinics. We excluded 36 (<0.01%) patients whose index echocardiogram occurred on the same day as aortic valve replacement and 392 (0.2%) patients with prior aortic valve replacement. In our primary analysis, we excluded 136 107 (62.8%) patients with incomplete documentation of echocardiographic elements (peak velocity, mean gradient, AVA, indexed AVA, VTI dimensionless index, peak velocity ratio dimensionless index or clinical interpretation) in the echocardiographic report necessary to ascertain agreement between valve measurements of aortic stenosis severity and documented severity. In secondary analyses, we determined the proportion of patients for whom aortic stenosis severity could be defined despite incomplete data.

Cohort identification.
Aortic stenosis severity
Aortic stenosis was categorised by the echocardiographic reader as ‘none’, ‘mild’, ‘mild to moderate’, ‘moderate’, ‘moderate to severe’, ‘severe’ and ‘critical’. The echocardiographic reader had access to standard definitions of aortic stenosis severity at the time of study interpretation. The echocardiographic reader’s interpretation was used as the reference standard as this is the assessment that informs clinical care. In our primary analysis, severe aortic stenosis included ‘severe’ and ‘critical’ stenosis. We included ‘moderate to severe’ stenosis in a sensitivity analysis.
Statistical analysis
We determined the proportion of patients with severe aortic stenosis on the basis of guideline recommendations3 for transvalvular gradients (peak velocity≥4.0 m/s or mean gradient≥40 mm Hg) or AVA (VTI-based AVA≤1.0 cm2) in the overall population and stratified by documented interpretation of aortic stenosis severity. Given recommendations to index valve area to body size,4 we also determined the proportion of patients with severe aortic stenosis on the basis of indexed AVA (VTI-based indexed AVA≤0.6 cm2/m2). We also determined the proportion of patients with severe aortic stenosis on the basis of dimensionless index measures (VTI and peak velocity ratio)≤0.250.4 Next, we determined the proportion of patients with severe aortic stenosis by incorporating combinations of transvalvular gradients, AVA, indexed AVA and dimensionless index. Finally, we report the sensitivity, specificity, positive predictive value, negative predictive value and accuracy of echocardiographic measurements of severe aortic stenosis relative to documented severe aortic stenosis by the echocardiographic reader. Accuracy was defined as the percentage of patients correctly classified by the criteria (ie, the sum of true positives and true negatives divided by the total number of patients). These assessments were repeated in sensitivity analyses in which documented ‘moderate to severe’ aortic stenosis was considered severe. Finally, we determined the implications of using quantitative data for the categorisation of aortic stenosis severity among patients with missing documented interpretation of aortic valve stenosis.
Results
A total of 1219 (1.6%) patients were categorised as having severe aortic stenosis by the echocardiographic reader (table 1). Among patients with documented severe aortic stenosis, peak velocity or mean gradient-based measures of severe aortic stenosis were present in 876 (71.9%) patients. In patients with documented aortic stenosis, dimensionless index was consistent with severe aortic stenosis in 972 (79.7%) patients by VTI ratio and 981 (80.5%) patients by peak velocity ratio. AVA was consistent with severe aortic stenosis in 1147 (94.1%) patients and indexed AVA was consistent with aortic stenosis in 1185 (97.2%) patients with documented severe aortic stenosis.
Quantitative echocardiographic measures of severe aortic stenosis by documented interpretation
Among 75 848 patients with non-severe aortic stenosis by documented interpretation, peak velocity or mean gradient-based measures of severe aortic stenosis were rarely present (0.3%). Dimensionless index measures consistent with severe aortic stenosis was also infrequent (<1%), while AVA (2.4%) and indexed AVA (4.9%) measurements consistent with severe aortic stenosis were more common.
Relative to the documented interpretation, indexed AVA as a measure of severe aortic stenosis had the highest sensitivity (97.2%) but the lowest positive predictive value (23.3%) (table 2). Similar high sensitivity and low positive predictive value was observed for AVA. The aortic valve peak velocity and mean gradient were highly specific (>99%), but less sensitive (<70%). A measure incorporating peak velocity, mean gradient and either VTI or peak velocity determined dimensionless index achieved a balance of sensitivity (92%) and specificity (99%) with little detriment in accuracy relative to a measure based on peak velocity and mean gradient alone (98.9% vs 99.3%). Sensitivity analysis in which patients with documented interpretation of ‘moderate to severe’ aortic stenosis were considered to have severe aortic stenosis demonstrated similar findings (online supplementary file).
Supplemental material
Diagnostic characteristics of quantitative measures of severe aortic stenosis relative to documented severe aortic stenosis
Subgroup analyses stratified on sex demonstrated similar findings for women and men as observed for the entire cohort (online supplementary file). In patients with reduced ejection fraction (EF) (≤35%) or low stroke volume index (<35 mL/m2),5 the sensitivity of peak velocity and mean gradient measures of aortic stenosis were particularly low (<50%) but very specific (100%). Aortic stenosis as determined by a measure of dimensionless index, peak velocity and mean gradient achieved balance in sensitivity and specificity with high accuracy in all subgroups (online supplementary file).
Of the 136 107 patients with an incomplete echocardiographic documentation of the aortic valve stenosis, at least one aspect of valve stenosis severity was documented (peak velocity, mean gradient, dimensionless index (by either VTI or peak velocity) or clinical interpretation) in 93 005 (67.7%) patients. This increased the proportion of patients whose echocardiogram could be assessed for aortic stenosis to 79.8% (170 072 patients) compared with 52.7% (112 333 patients) by documented severity alone. In the 35 266 patients with a documented impression of valve stenosis severity, but no assessment of peak velocity, mean gradient or dimensionless index, 12 (<0.1%) were categorised as having severe aortic stenosis. Of the 100 841 patients without a documentation of aortic stenosis severity, the assessment of peak velocity, mean gradient or dimensionless index (by either VTI or peak velocity) was consistent with severe aortic stenosis in 1205 (1.2%) patients.
Discussion
We evaluated approaches to using structured echocardiographic data in the identification of patients with severe aortic stenosis when compared with the final echocardiographic interpretation. In nearly 80 000 patients, a measure that incorporated peak velocity, mean gradient and dimensionless index demonstrated balance in sensitivity (92%) and specificity (99%) with a high degree of accuracy (99%) relative to documented severe aortic stenosis. Incorporating data from both the structured impression and echocardiographic measurements allowed for the assessment of aortic valve stenosis severity in 80% of patients, as compared with 53% by documented impression alone and nearly doubled the number of patients with severe aortic stenosis that could be identified from echocardiographic data.
Echocardiographic data captured in routine clinical care has been leveraged to populate patient registries and perform retrospective observational studies, including studies that have informed the outcomes of patients with asymptomatic severe AS6 and causes of death among patients with severe AS.7 These prior studies have applied guideline recommended quantitative echocardiographic measures, including valve area, in the identification of patients with severe AS. In the present study, nearly two of every three patients categorised as having severe aortic stenosis on the basis of guideline recommended quantitative measures were categorised as non-severe aortic stenosis by the interpreting clinician. This disagreement in interpretation was driven by a lack of specificity for AVA measurements. Incorporating dimensionless index in place of AVA improved on this limitation. Future studies from these registries might consider additional analyses restricted to patients with severe AS on the basis of peak velocity, mean gradient and dimensionless index to provide additional specificity to their findings.
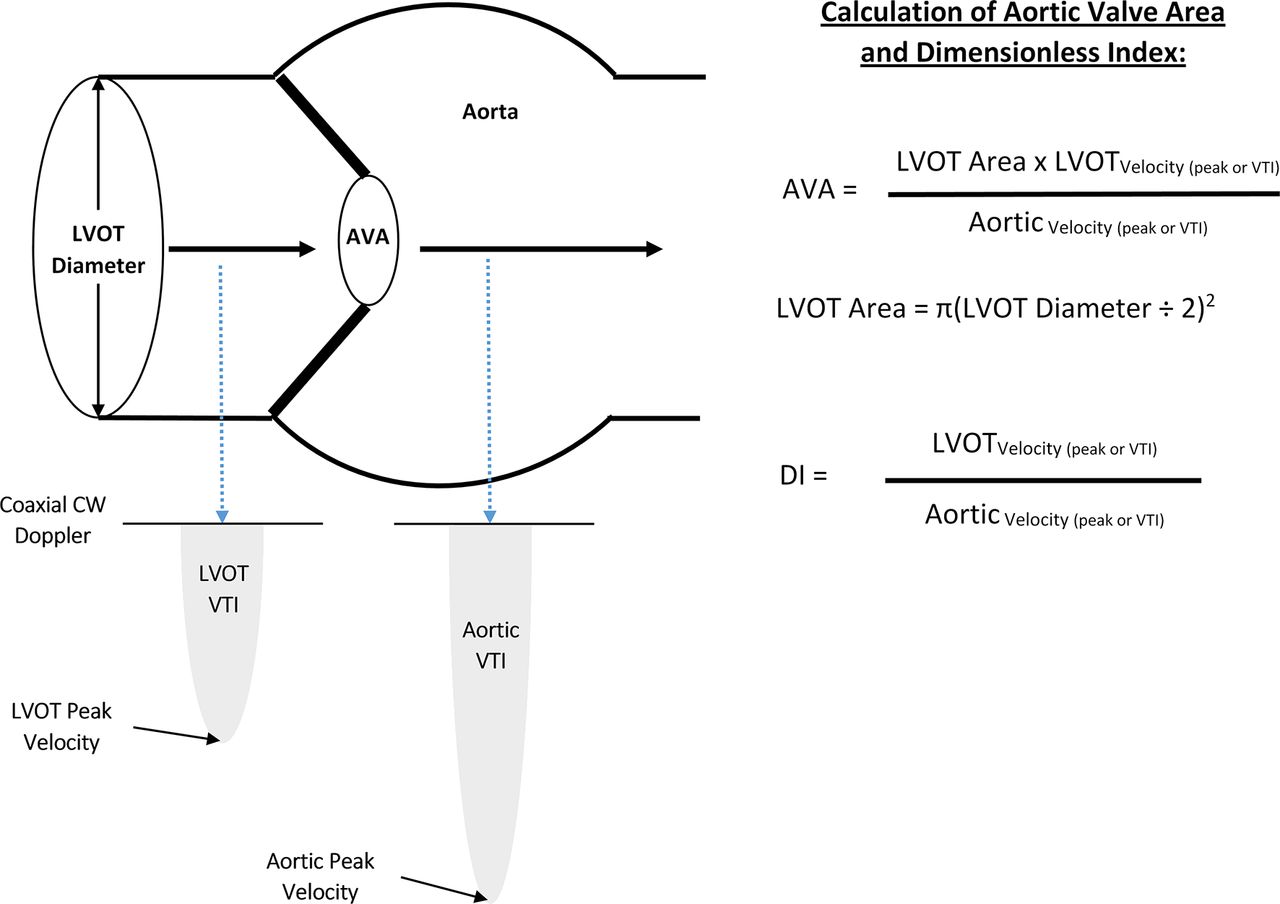
A schematic of the echocardiographic elements used for measurement of aortic stenosis is shown in figure 2 to further contextualise our findings. Although our findings emphasise greater agreement between dimensionless index and the clinical interpretation of aortic stenosis severity, concerns have been raised about the potential for LVOT velocities and resultant dimensionless index ratios to be influenced by extremes of LVOT dimension.8 Our subgroup analysis provides indirect information to minimise these concerns, as dimensionless index in place of AVA remained preferable in both women (potential for smaller LVOT dimensions) and men (potential for larger LVOT dimensions).
Schematic of echocardiographic measures of aortic stenosis as the measurement of left ventricular outflow tract (LVOT) diameter is squared in the calculation of AVA, inaccuracies in this measurement can contribute substantially to error. The dimensionless index does not depend on the measurement of LVOT diameter. The present study suggests routinely captured data on aortic velocities, mean gradient, and dimensionless index are more accurate than AVA in the assessment of severe aortic stenosis when compared with the clinically relevant interpretation of the echocardiographic reader. AVA, aortic valve area; CW, continuous wave; DI, dimensionless index; VTI, velocity time integral.
As interest grows in the use of clinical data to support prospective interventions in learning healthcare systems and pragmatic clinical trials,9 10 it will become increasingly important to understand the limitations of data captured in the process of providing routine clinical care. The present study suggests the direct application of disease state definitions to quantitative clinical data without validation against the clinical record has the potential to lead research and quality improvement efforts astray. Furthermore, to support pragmatic approaches to research design, authors of guideline statements should ensure disease state definitions are parsimonious and maximise the ability of clinical data to identify patient cohorts of interest.
Strengths of our study include the large sample size and comparison of routinely captured data to a clinically relevant standard, rather than a central lab, given our intent of informing pragmatic research design. Limitations include study of a single healthcare system which may impact generalisability, though the Allina Health system provides cardiovascular care for a large region in the Minnesota and western Wisconsin. Furthermore, as the quality of echocardiographic image acquisition can vary, it is possible that greater attention to high quality ascertainment of parameters used to determine aortic stenosis could influence our findings. However, our findings reflect a cardiovascular delivery setting with concurrent valvular research efforts11 that likely contributes to high quality echocardiographic imaging. Our study includes subgroup analyses for a limited number of characteristics of greatest potential impact on the diagnostic characteristics of routinely captured echocardiographic data. However, covariates are limited in our available echocardiographic data. Data linkages are ongoing to allow incorporation of covariates that will provide additional granularity in future analyses. Finally, we applied a fixed threshold for dichotomisation of aortic stenosis severity based on prior guidelines and recommendations. As a result, we are unable to create receiver operative characteristic curves and determine diagnostic accuracy as a function of the area under the curve. We determined accuracy on the basis of per cent patients correctly classified by the criteria, but limitations of this measure (ie, the potential to be ‘accurate’ in settings of perfect specificity and zero sensitivity) must be considered and this assessment of accuracy must be evaluated in the context of sensitivity, specificity, positive and negative predictive values.
In summary, we found the direct application of guideline recommended definitions of severe aortic stenosis to routinely captured echocardiographic data was limited by inadequate specificity for AVA measurements. An emphasis on peak velocity, mean gradient and dimensionless index resulted in more accurate assessment of severe aortic stenosis when compared with the clinically relevant interpretation of the echocardiographic reader. These findings highlight the importance of clinical data validation prior to application for pragmatic research and quality improvement efforts.
Key messages
What is already known on this subject?
Data from echocardiograms performed in routine clinical care are being used to populate registries and address research questions. Insights on the limitations of using routinely captured echocardiographic data are limited.
What might this study add?
In this retrospective observational study of 213 174 patients, aortic valve area had a poor positive predictive value (37.5%) for identification of severe aortic stenosis. A measure incorporating peak velocity, mean gradient and dimensionless index (either by velocity time integral or peak velocity ratio) achieved a balance of sensitivity (92%) and specificity (99%).
How might this impact on clinical practice?
Application of guideline definitions to routinely captured echocardiographic data requires validation prior to direct application in clinically embedded pragmatic research or quality improvement efforts.
Footnotes
Contributors Conception and study design: SMB. Data collection: KF, KM. Data analysis and interpretation: SMB, KF, KM, PS, CES, MG, PS. Drafting the manuscript: SMB. Critical revision of the manuscript: SMB, KF, KM, PS, CES, MG, PS. Final approval of the version to be published: SMB, KF, KM, PS, CES, MG, PS.
Funding The authors have not declared a specific grant for this research from any funding agency in the public, commercial or not-for-profit sectors.
Competing interests None declared.
Patient consent Not required.
Ethics approval Allina Health.
Provenance and peer review Not commissioned; externally peer reviewed.
Data sharing statement Data from this observational study are not available for sharing.