Article Text

Statistics from Altmetric.com
Trying to explain potential outcomes, and their likelihoods, is a challenge. Indeed, patients who just had a catheterization procedure remember few of the related risks and benefits.1 Patients are often unfamiliar with the terminology, and vary widely in health status, numeracy, health literacy and information preferences. Complicating things further is the difficulty of ensuring that patients understand the ‘material risks’ for them as individuals: a matter not only of probability but also of the impact it could have on them personally.
This task is not only an ethical imperative but also a legal one, enshrined in law in many countries, such as the 2015 Montgomery judgement in the UK (figure 1). At the Winton Centre, our research into how individuals understand risk aims to offer a few considerations and recommendations to help clinicians achieve this.
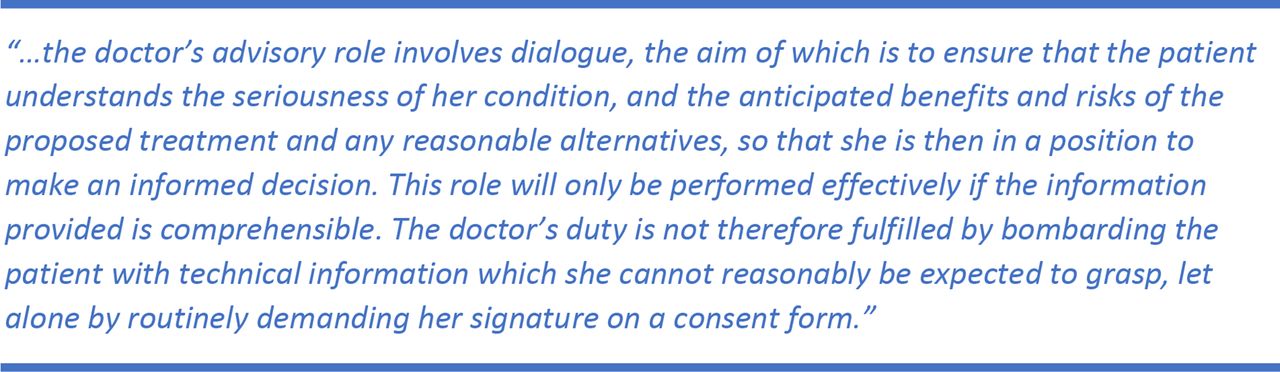
Conclusions of the Supreme Court in Montgomery v. Lanarkshire Health Board, Lords Kerr and Rees.
Communicating numbers
In a recent series of surveys covering more than 12 000 people and 12 countries, we asked the question ‘Which of the following numbers represents the biggest risk of getting a disease: 1 in 100, 1 in 1000, or 1 in 10?’. One in six participants answered incorrectly. Other research shows over a quarter could not answer the question ‘If a person’s chance of getting a disease is 20 out of 100, this would be the same as having a __% chance of getting the disease’.2
To try to avoid these misunderstandings, some clinicians use words instead of numbers,3 but this can backfire. For example, patients who were told that pancreatitis was a ‘rare’ complication of atorvastatin assumed that its incidence was 450 times higher than it actually was and had more negative impressions of the medication than patients who were told about the risks numerically.4
When making comparisons, keep the denominator the same (eg, ‘1 out of 200 people’ vs ‘4 out of 200 people’, not ‘1 in 200’ vs ‘1 in 50’), and compare risks to benefits in the same terms wherever possible; be explicit about time frames (eg, ‘a year from now’); be clear about the reference class (eg, ‘people like you who have this procedure’); and frame outcomes in a balanced way (eg, ‘one would experience… while the other 199 would experience…’). If available statistics are not necessarily appropriate for this patient, this should be made explicit (eg, ‘We usually say the risk is… But for you, it may be higher/lower, because…’).
Using graphics can allow people to ‘see’ the numbers and appreciate their context. For example, showing outcomes for 100 people, and using different shapes or colours to represent patients who had different experiences can give an instant impression. Those with higher numeracy tend to count the icons; those with lower numeracy use the impression of the area.5 See figure 2 for an example.

Icon arrays illustrating the outcomes of patients described in a trial of epinephrine for those suffering an out-of-hospital cardiac arrest.6 The graphics give an instant impression of the numbers and reduce the risk of positive-only or negative-only framing by showing both positive and negative outcomes simultaneously.
Communicating uncertainty
Although everyone wants certainty, we must be honest about the unknown. A statistic cannot represent a patient’s personal risk. Discuss factors that may affect their risk as compared with conventional statistics, and acknowledge the inevitable uncertainties. Rounding uncertain numbers (‘5’ rather than ‘4.8’) can make them easier to interpret and can correctly imply that they are not exactly known. When confidence intervals are wide, stating them as a range (‘anywhere from two people to five people…’) may underscore the lack of certainty. However, presenting extra numbers may confuse a patient further if they have to be rattled off in a short time: graphical representations of uncertainty may help avoid overload.
Describing potential negative outcomes
The language chosen to describe outcomes is as important as the language chosen to describe probability. It should convey some sense of severity and what it actually means for the patient (eg, effects on quality of life). For example, the word ‘bleeding’ does not distinguish between a paper cut and severe blood loss. Being explicit about the duration of effects can also be important. In interviews with women who had undergone breast cancer treatment, we found that several who had experienced chronic consequences of treatment did not feel adequately informed of this possibility. Although they had been warned that side effects could be very severe, they had not realised that long-term effects were possible.
However, one can go overboard. It is well known that visualising negative scenarios can lead to substantial overestimation of their probabilities. This may be particularly important in acute care scenarios where emotions and fear are already likely to be running high.
In conclusion, then, avoid using words to convey likelihoods: use numbers, and support them with graphics wherever possible. Be upfront and as precise as possible about uncertainties (again, using numerical ranges rather than verbal cues of uncertainty where possible). Be as balanced as you can about both benefits and risks, and avoid framing the numbers in just one direction. Moreover, the best way to check whether you have been successful in your communication is to stop and ask the patient to explain back what they have understood: this gives you a chance to assess what they are understanding, as well as what is important to them.
Footnotes
Contributors All contributors contributed to the drafting of the manuscript.
Funding The authors have not declared a specific grant for this research from any funding agency in the public, commercial or not-for-profit sectors.
Competing interests None declared.
Patient and public involvement Patients and/or the public were not involved in the design, conduct, reporting or dissemination plans of this research.
Patient consent for publication Not required.
Provenance and peer review Commissioned; internally peer reviewed.