Article Text

Abstract
Objective Early prediction of atrial fibrillation (AF) development would improve patient outcomes. We propose a simple and cheap ECG based score to predict AF development.
Methods A cohort of 16 316 patients was analysed. ECG measures provided by the computer-assisted ECG software were used to identify patients. A first group included patients in sinus rhythm who showed an ECG with AF at any time later (n=505). A second group included patients with all their ECGs in sinus rhythm (n=15 811). By using a training set (75% of the cohort) the initial sinus rhythm ECGs of both groups were analysed and a predictive risk score based on a multivariate logistic model was constructed.
Results A multivariate regression model was constructed with 32 variables showing a predictive value characterised by an area under the curve (AUC) of 0.776 (95% CI: 0.738 to 0.814). The subsequent risk score included the following variables: age, duration of P-wave in aVF, V4 and V5; duration of T-wave in V3, mean QT interval adjusted for heart rate, transverse P-wave clockwise rotation, transverse P-wave terminal angle and transverse QRS complex terminal vector magnitude. Risk score values ranged from 0 (no risk) to 5 (high risk). The predictive validity of the score reached an AUC of 0.764 (95% CI: 0.722 to 0.806) with a global specificity of 61% and a sensitivity of 55%.
Conclusions The automatic assessment of ECG biomarkers from ECGs in sinus rhythm is able to predict the risk for AF providing a low-cost screening strategy for early detection of this pathology.
- atrial fibrillation
- biomarkers
Data availability statement
No data are available.
Statistics from Altmetric.com
Introduction
Atrial fibrillation (AF) is the most prevalent arrhythmia1 and may be associated with several life-threatening complications such as embolic stroke, heart failure and dementia.2 3 Approximately 33 million people worldwide present AF.4 AF prevalence is directly proportional to age, being three to four times higher in patients with age >80 years than in those in the 60-year to 70-year range.5 In Spain, a country with high life expectancy, AF prevalence reaches 17% in the elderly (>80 years) population becoming a major source of concern for the country’s health system.6 Since silent AF is present in one‐third of patients with this arrhythmia, cardiovascular complication is frequently the clinical debut of the disease. In this sense, several studies suggest that current AF prevalence may be largely underestimated,4 7 reinforcing the necessity of implementing effective, low cost and fast screening interventions capable of estimating the risk of developing AF.
Current development of big data techniques allows performing massive analysis of clinical data in cardiology.8 In parallel, quantitative methods to detect ECG biomarkers have been increasingly used over the last years,9 leading to the development of highly sophisticated ECG software capable of quantifying and identifying hundreds of ECG measures from standard 10 s 12-lead recordings, thus providing the physician with reliable interpretations.
Nowadays, most health centres around the world store huge amounts of already quantified and interpreted ECGs, which, after a proper analysis,10 could be used to investigate new biomarkers, as for example to predict AF appearance.
The aim of the present work was to establish a global prediction model and a risk score for AF development using biomarkers extracted by automatic ECG assessment of a large cohort of ECGs. Patients with several ECGs over time were classified in two groups: patients with an ECG showing AF preceded by one in sinus rhythm (SR) and patients with SR in all their ECGs. The comparison between these two groups allowed developing a global model from which we obtained ECG biomarkers for predicting AF risk, which were later used to establish the Atrial Fibrillation Automatic Assessment (AFAA) risk score.
Methods
Data and study population
A retrospective cohort study was conducted at the University Hospital La Princesa (Madrid, Spain) between 5 May 2010 and 4 February 2019. A total of 132 772 patients (329 670 ECG recordings) were analysed. ECGs were originally requested by several units, including outpatient medical centres, emergency room, among others (see online supplemental figure 1 for further details).
Supplemental material
All data needed for the analysis—ECG measures and interpretations—were obtained from the ECG files (in XML format) and stored for further analysis. The only additional data available in the ECG files were age and sex.
ECG recordings
All analysed ECGs came from routine 10 s 12-lead measurements, processed, quantified and interpreted by the Philips DXL Algorithm11 and stored in XML format. In addition to heart rate and rhythms, the software algorithm provides a quantified analysis of amplitude, duration, area and shape for every P-wave, QRS complex, ST segment and T-wave in each lead, resulting in 566 variables for every 10 s ECG recording.
Data cleaning
Several ECGs and their corresponding patients were first discarded: ECGs with low quality and artefacts (25 958 ECGs, 6961 patients), ECGs from patients with unknown age (42 643 ECGs; 6405 patients) and ECGs from patients with only one ECG (71 384 ECGs; 71 384 patients). After excluding these data, a cohort of 48 022 patients (189 685 ECGs) was obtained.
Studied cohort
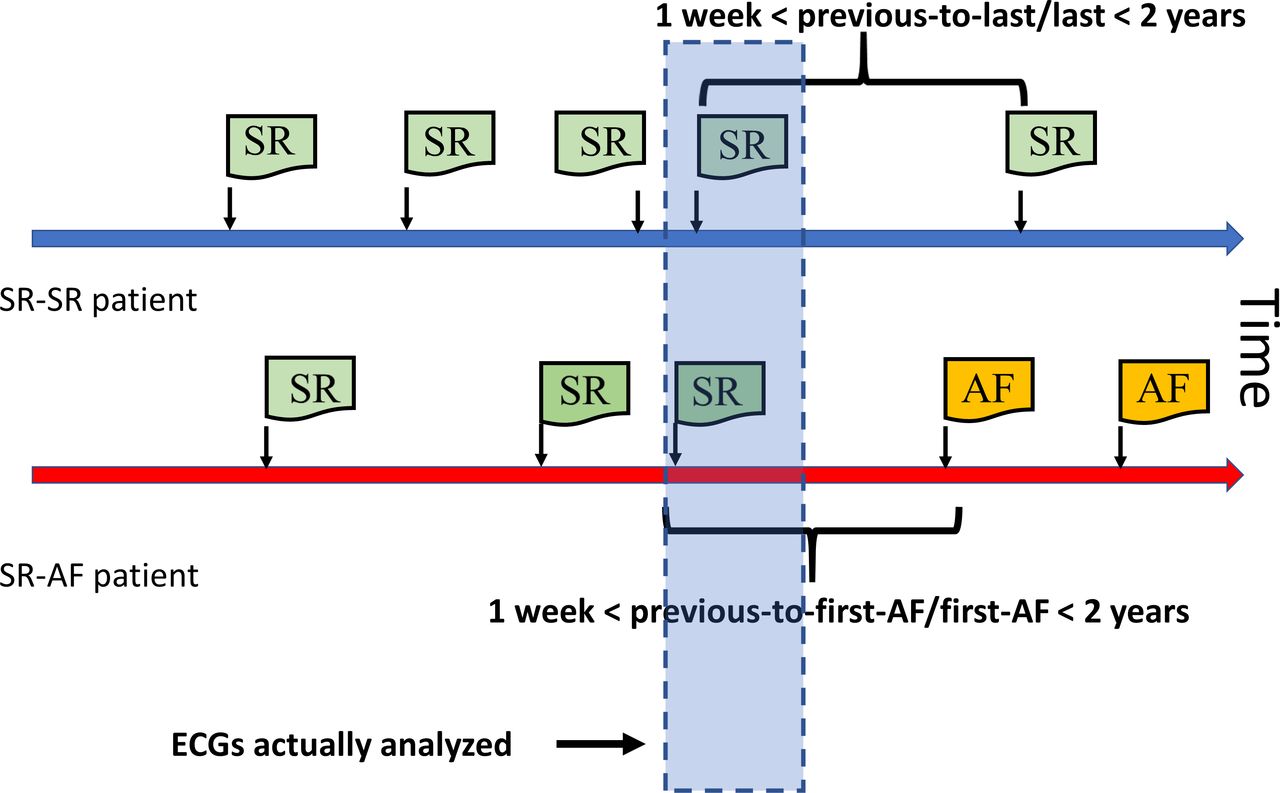
After an exhaustive selection of ECGs—including a cardiologist’s assessment—from patients with AF and non-AF (see figure 1 and online supplemental text S1 for a detailed description of the selection process), a cohort of 16 316 patients’ ECGs in SR was obtained. In this cohort, 505 ECGs in SR correspond to those patients who showed an ECG with AF at any later time, this group was named as SR-AF. The other group, that is, the SR–SR group, included patients’ ECGs with all their future ECGs in SR (n=15 811). This selection process is sketched in figure 2 for the case of two representative patients.
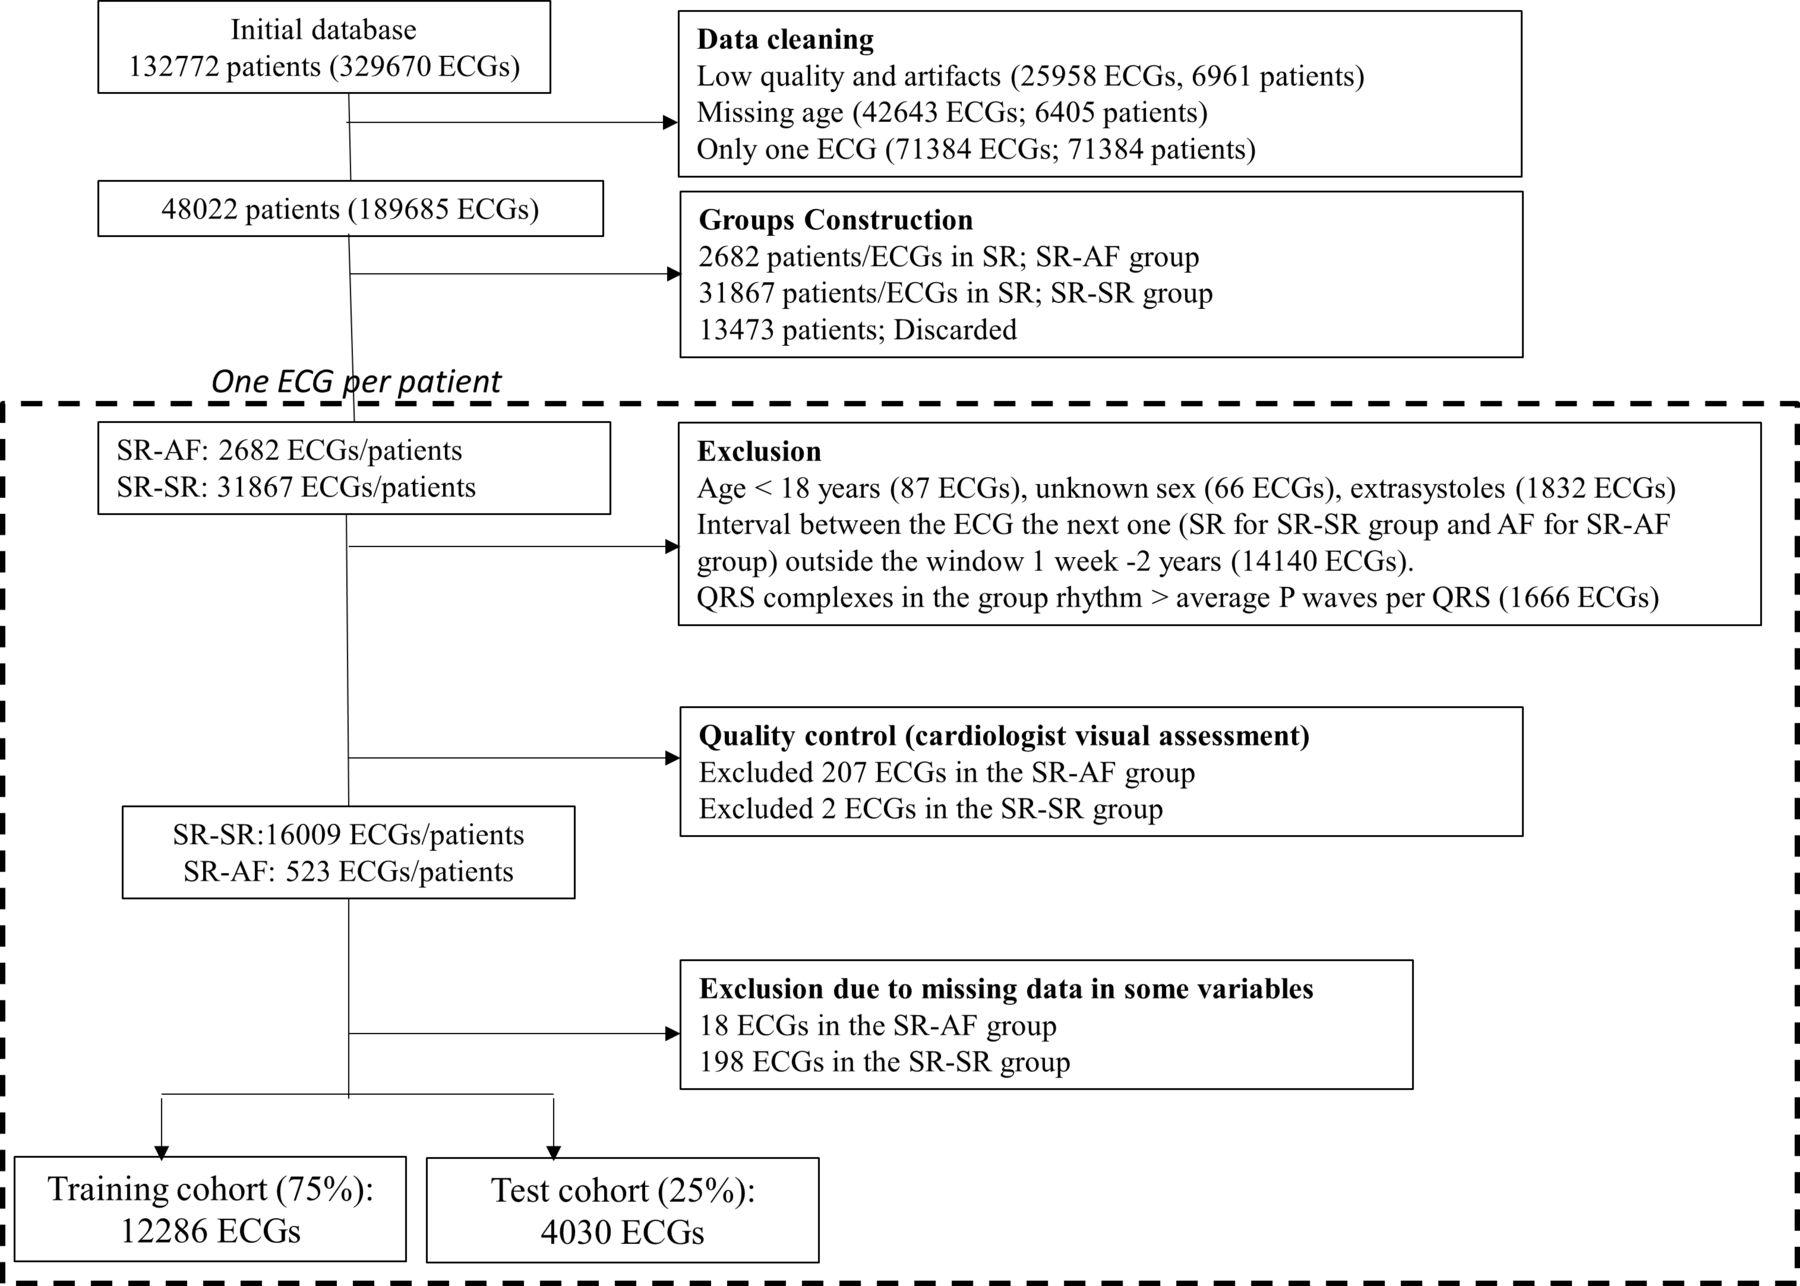
Patient selection flowchart. AF, atrial fibrillation; SR, sinus rhythm.

Sketch of ECG selection in patients representative of both groups, SR–SR and SR–AF. The last two ECGs of patients belonging to the SR–SR group are selected if the interval between them is in the range between 1 week and 2 years (thick blue line). For the SR–AF group, the first ECG in AF and the preceding one in SR are selected if the interval between them is in the range between 1 week and 2 years (thick red line). The bluish rectangle shows the actual ECGs selected for analysis from both groups. AF, atrial fibrillation; SR, sinus rhythm.
Data analysis
Training and test sets
The studied cohort was split in training and test datasets in a way that 75% of the patients were randomly assigned to the training set and the remaining 25% to the test set. This was performed in such a way that none of the patients’ ECGs belongs to both data sets and they were only assigned exclusively to one or the other dataset. Both sets maintained the proportion of SR–AF and SR–SR ECGs of the original cohort.
Variable selection
By using solely the training set, a preliminary selection of variables was conducted with a univariate logistic regression under the objective of studying the association between ECG measures and the outcome (SR–AF or SR–SR group). Only variables with p<0.05 (adjusted by the Bonferroni correction) were considered, resulting in 228 significant variables. Subsequently, we applied a variance inflation factor (VIF) test to measure the inflation in the variances of the parameter estimates caused by collinearities and we determined which predictors fulfilled the criterion of VIF <4 as a control of non-collinearity.12 Only 47 variables passed this last step. This is explained by the fact that 37 variables were measured in each lead, producing high level of collinearity between them. Finally, variables showing not available (NA) data in more than 1% of the cases were removed (instead of being imputed, as explained in the online supplemental text S2), resulting in 32 variables, namely: age, sex, distance between ECGs, aVF pdur, V3 pdur, V4 pdur, V5 pdur, V3 pppparea, II qamp, II ramp, V1 ramp, I rdur, aVL rdur, V1 rdur, V3 rdur, aVR samp, V1 samp, V4 samp, V3 sdur, aVL.qrsdur, aVF.qrsdur, V3 tptpdur printstddev, stfrontaxis, tfrontaxis, meanqtc, transpcwrot, transptermangle, transqrsinitmag, transqrstermmag, frontqrsinitangle, sagpcwrot. The definition of these terms according to the Philips nomenclature is explained in online supplemental table S1.
Global model
Before fitting the multivariate model, ECGs presenting missing values (NA) in any variable in the training set were removed from both the training and the test sets (n=18 in the SR–AF group and n=198 in the SR–SR group). This procedure was chosen instead of imputing values as it was explained in online supplemental text S2. Thereafter, a multivariate logistic model was constructed by using the predictors selected in the training cohort. To assess the validity of the model for predicting AF risk, we determined the area under the curve (AUC) of the receiver operating characteristic (ROC) curve of the model in the test set.
AFAA risk score
In order to translate the previous model to a clinically meaningful score capable of predicting AF risk, we determined a risk score based on the categorisation of the continuous variables (n=32) to combine them with the variables that were already categorical (n=1).
Continuous variables were categorised by considering their relationship with the outcome variable and determining the range of values corresponding to the lowest AF incidence and then, the range’s length was used to construct as many categories as it allowed. Subsequently, all the new categorical variables and those that were already categorical were fitted in a multivariate logistic regression. Thereafter, the model was used to determine the OR for the selected variables according to a stepwise algorithm based on the Akaike’s information criterion. The estimated multivariate model coefficients of the resulting significant (p<0.05) variables were used as a weight of the corresponding variables in the model. The final score for each patient was calculated as the overall sum of those values, that is, for each patient and for each significant variable in the model that presented the range in which the values were considered significant in the multivariate model, we assigned the corresponding points of the estimated coefficient.13 As with the global model, the model was trained with the training set and its validity was established by using the AUC of the ROC of the test set and the corresponding 95% CI. Comparisons between AUCs were done by using the Delong test.
All calculations were performed using our own codes and base functions in GNU Octave and R, V.3.5.1.
Results
Cohort characteristics
A total of 132 772 patients were considered for eligibility. After cleaning and applying the exclusion criteria, a final cohort of 16 316 patients was selected (distributed in 505 patients for the SR–AF group and 15 811 for the SR–SR group). The median age was 66 years (25th–75th percentile: 52–79 years), 8340 (51%) were women and the mean elapsed time between the previous-to-last ECG and the last ECG was 9.4±6.4 months. In the SR–AF group, median age was 82 years (25th–75th percentile: 71–87 years), 267 (53%) patients were women and the mean of elapsed time was 10±6.6 months; the SR–SR group presented a median age of 66 years (25th–75th percentile: 52–78 years), a 51% (8073) of female patients and a mean elapsed time between the ECG recordings of 9.4±6.4 months. Unlike sex, age and elapsed time between ECGs presented statistically significant differences between groups (p<0.001, p=0.038, respectively).
Global model
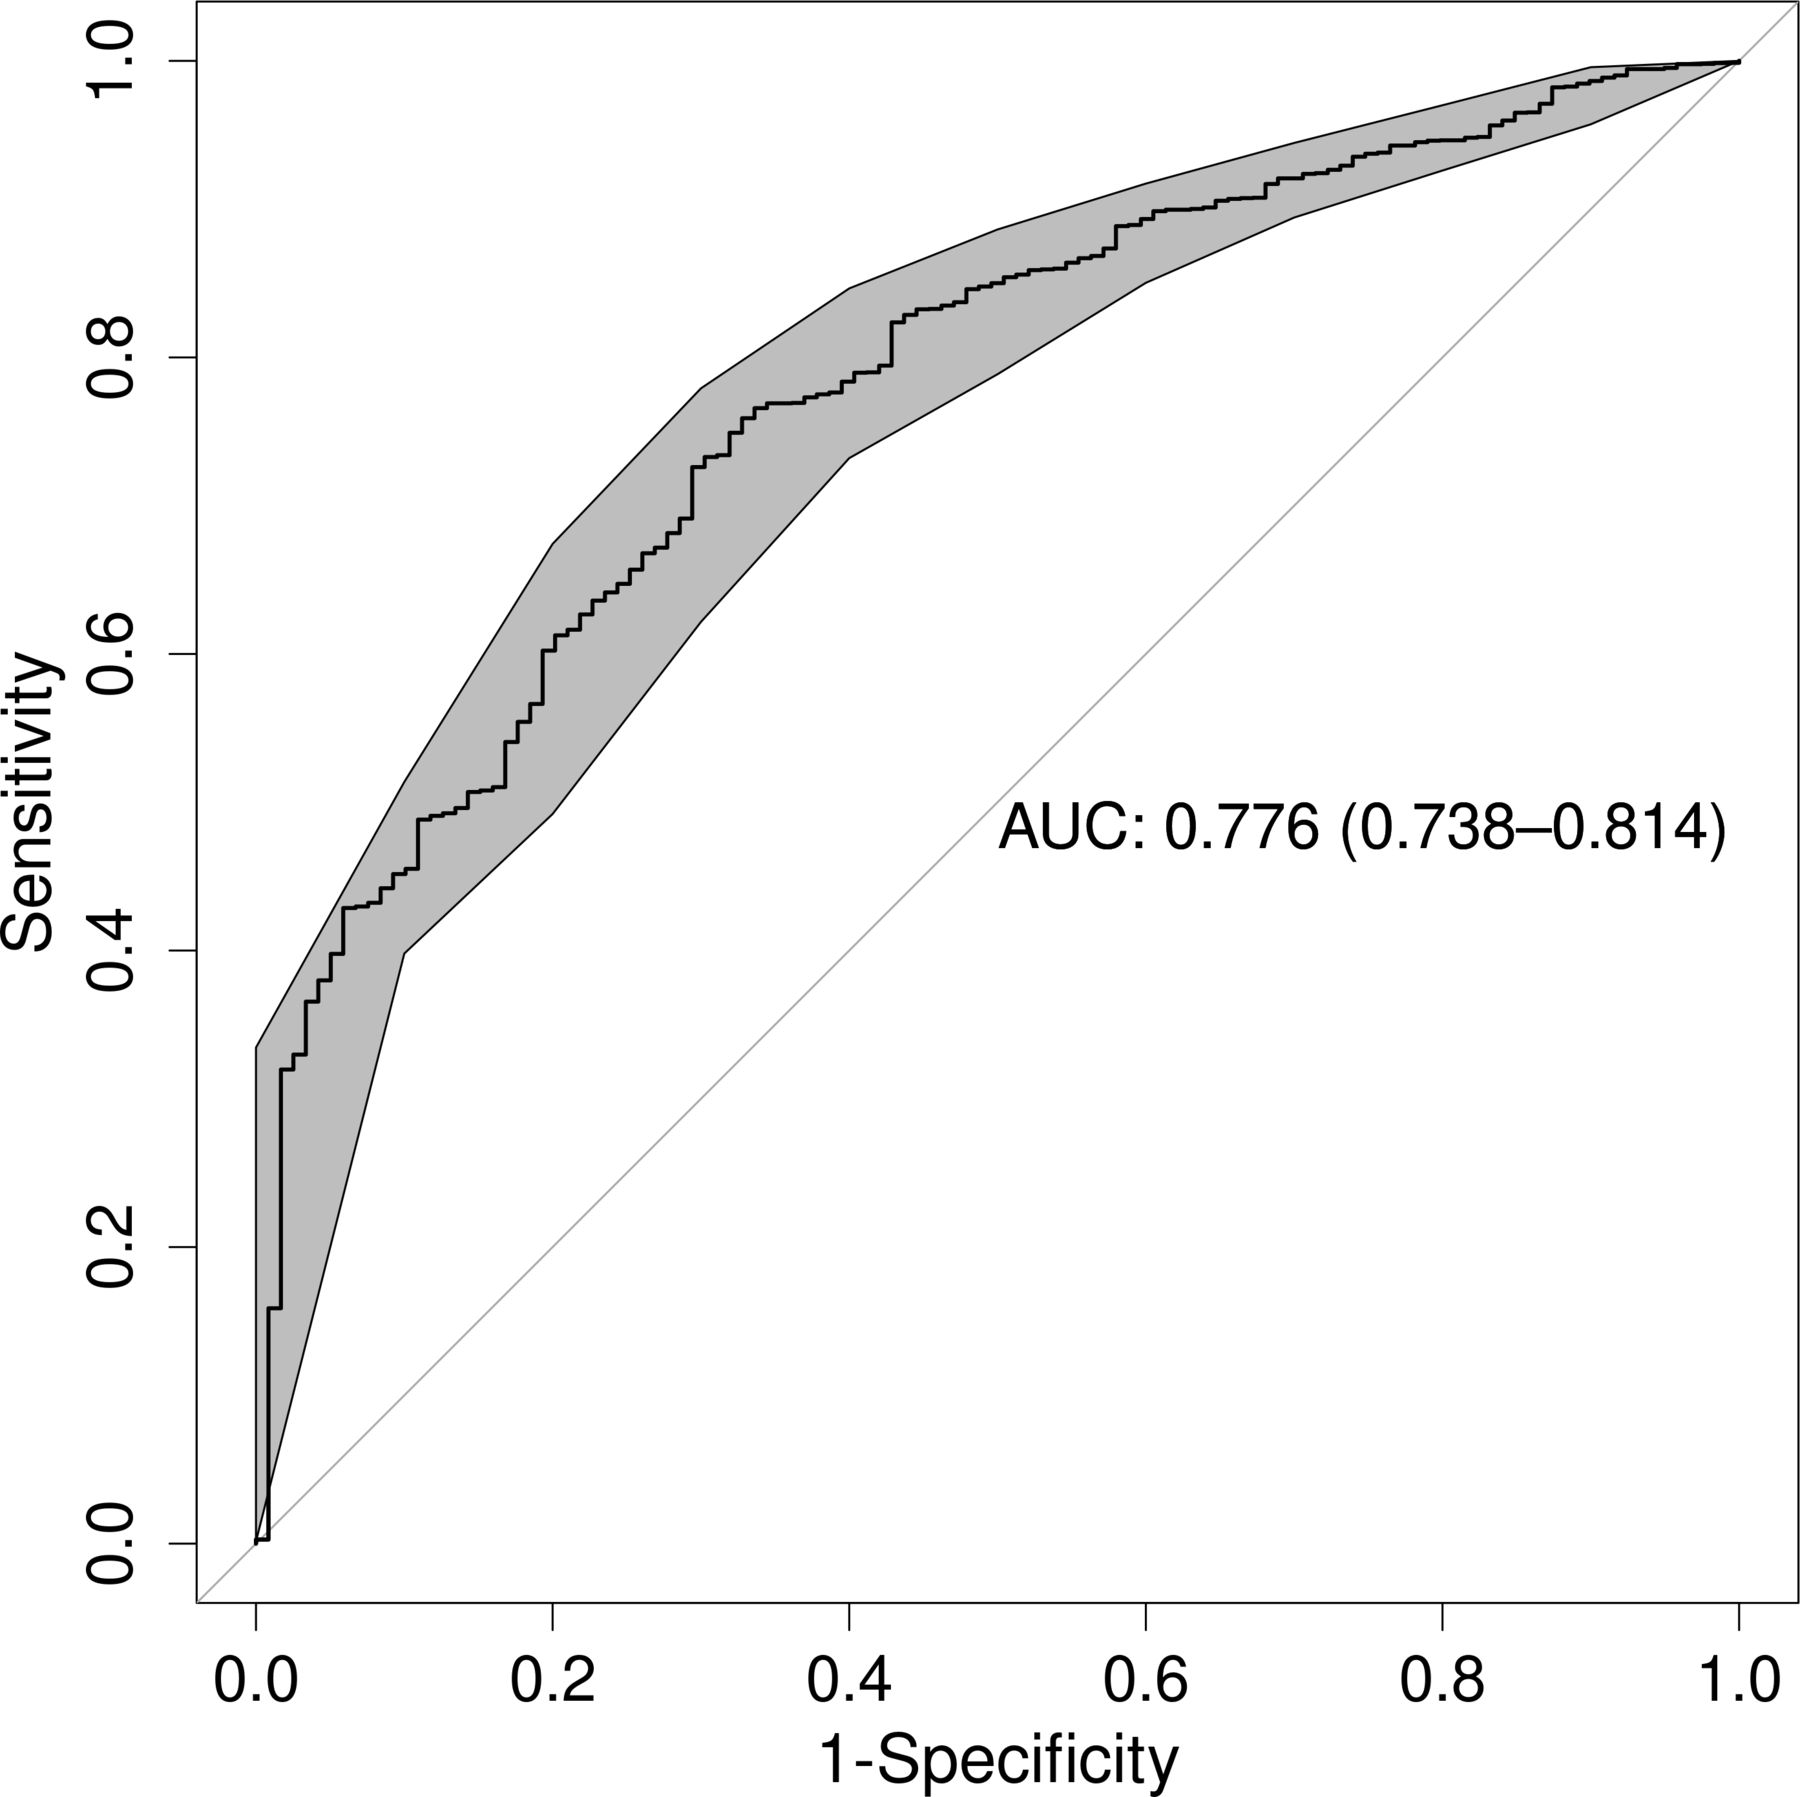
A global model was constructed by using the 32 variables obtained in the univariate selection process performed on the training set. After performing multivariate logistic regression using the training dataset, the predictive validity of the model was assessed using the test dataset, obtaining an AUC of 0.776 (95% CI: 0.738 to 0.814) (figure 3). Alternatively, a Lasso regression was also conducted resulting in a similar model to the one obtained by the logistic regression (see online supplemental text S3). In view of that, we kept for the risk score construction those significant variables obtained from the multivariate logistic regression.

ROC curve of the general model for the test cohort. The bold line shows the value of the ROC curve. The values in the centre of the graph represent AUC and the 95% CI. AUC, area under the curve; ROC, receiver operating characteristic
AFAA risk score
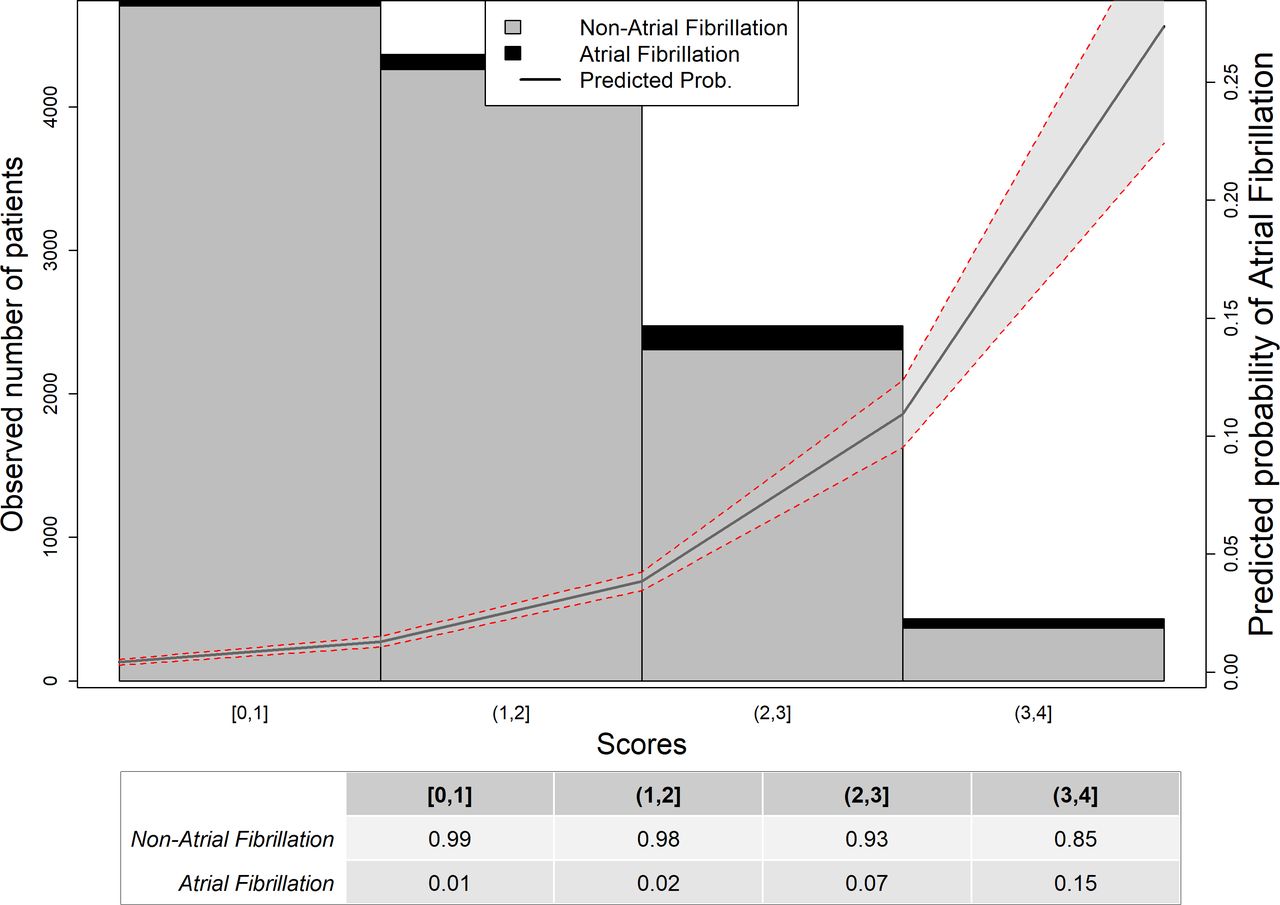
Although the predictive power of the global model looked appropriate, its implementation in clinical practice would be complex. Thus, we constructed a risk model. First, we categorised the continuous variables with which we subsequently performed a logistic regression in the training set (online supplemental table S2 and determined the corresponding ORs (table 1). The estimated coefficients of the statistically significant variables of the global model were used as weights and scores of the following risk factors: age, duration of P-wave in aVF, V4 and V5; duration of T-wave in V3, mean QT interval adjusted for heart rate, transverse P-wave clockwise rotation, transverse P-wave terminal angle and transverse QRS complex terminal vector magnitude (table 2). Although elapsed time between ECGs presented significant differences, this variable was not used in the score model since its use is not feasible in clinical practice. Score values ranged from 0 to 4, being 0 no risk of AF and 4 high risk of AF. The representation of AF probability according to the score is shown in figure 4, this probability reached 0.7%, 0.8%, 2%, 7%, 9% and 66% for each of the possible integer values of the score, that is, 0 to 5, respectively. The performance of the score was estimated from the AUC of the ROC curve generated by applying the score to the test cohort, reaching 0.764 (95% CI: 0.722 to 0.806) (figure 5A). The global specificity was 61%, the sensitivity was 55% and the Youden index presented a threshold of 1.75, with a specificity of 67% and a sensitivity of 75%. Further details of the score validity can be found in online supplemental table S3. In the online supplemental information can be found the effect of age on the global model.

Probability of AF based on risk score values. Bars show the number of patients in the training cohort for each score value (non-AF in grey and AF in black). The trend line shows the estimated probability of AF. The table below represents the percentage of patients in the training cohort for each score value. AF, atrial fibrillation.

(A) ROC curve of the risk score for the test cohort. The bold line shows the value of the ROC curve. The values at the centre of the graph represent AUC and the 95% CI. (B) ROC curves of models analysing different age scenarios. ROC curves of logistic regression models constructed using datasets representing four scenarios: black line, including all patients (global model); red line, excluding those patients under 65 years; blue line, patients from the SR group randomly selected to equalise the age, sex and temporal distance between ECGs; green line, dataset that only considers age in the model. AUC, area under the curve, ROC, receiver operating characteristic; SR, sinus rhythm.
OR of selected variables
Variable weights of the risk score
Effect of age on the global model
Since the SR–AF group was (on average) 16 years older than the SR–SR group, age could be considered as a critical factor able to explain the differences between both groups. To rule out the age effect, we used the same procedure employed to construct the global model in three different scenarios: removing those patients under 65 years; by matching patients from SR–SR group by age, sex and intervals between ECGs and finally, using only ages. Comparison of the AUCs for the different scenarios (figure 5B) showed that the initial model, considering all the variables, outperformed the other scenarios, except for the scenario that excluded those patients aged <65 years, when considering the AUCs instead of the p values. Specifically, we found an AUC of 0.776 (95% CI: 0.738 to 0.814) for the initial model, while AUC was 0.781 (95% CI: 0.744 to 0.8177, p=0.86) for the scenario that excluded those patients <65 years, 0.653 (95% CI: 0.593 to 0.714, p<0.001) for the scenario that randomly selected patients from SR–SR group in order to equalise the age, sex and elapsed time between ECGs, and 0.764 (95% CI: 0.723 to 0.804, p=0.36) for the only age model. Variables selected for each model can be found in online supplemental table S4.
Discussion
The present work aimed to identify AF predictive biomarkers by using data obtained from an automatic ECG measure extraction software. From the comparison of 16 316 SR ECGs and considering 566 variables, we determined a global predictive model and a risk score for AF. The global predictive model presented a discrimination power of approximately 0.8 in the test cohort, in line with previous predictive studies.14 15 Recently, an artificial intelligence-oriented study, less based on traditional ECG knowledge, reported better discrimination values16 than the ones presented here but at the expense of disregarding, for instance, critical aspects such as age difference between groups. Moreover, since the artificial intelligence approach using convolution neural networks worked itself as a biomarker, specific ECG features could not be presented as predictors of AF. The approach presented here aimed to define a potential risk model suitable for clinical practice using identifiable critical ECG measures.
The OR of the model that originates the risk score includes several risk factors, and most importantly, thresholds, some of which have been already related to AF prediction. Age is a well-established AF risk factor,5 which in our case presented a similar threshold to that of a risk score recently described.17 As expected, P-wave-related variables were also correlated with increased AF risk, which is in accordance with studies focused on electrophysiological markers of AF.18 In particular, the P-wave duration threshold has been reported to have a U-shape relationship with AF risk, that is, extreme durations are related with higher AF risk. For instance, the Copenhagen ECG study showed that a P-wave duration shorter than 89 ms is an AF risk factor,19 whereas an excessive duration has also been associated with increased risk.20 Similarly, we found here that both short and long distances of P-wave were risk factors. Our risk score shows that a positive P-wave duration in lead aVF—aVF.pdur—longer that 200 ms contributes to increasing the risk of developing AF. Although this limit is well beyond normal21 or even pathological P-wave duration values, it should be remarked that this value was obtained from what the automatic software quantification declares as a correct value. Likely, in some cases the inclusion of U-wave or the final part of a biphasic T-waves in the P-wave measurement may lead to a P-wave duration overestimation. This fact serves to remind the realm on which this work should be considered, that is, a risk score based on the ECG automatic assessment.
P-wave axis is commonly reported in ECGs, though little attention is given to this measure; however, abnormal values of this parameter are also a marker of AF risk,22 which could be related to our results. Long PR interval has also been described as a risk factor in the Framingham Heart Study risk score.14 Likewise, in our model a higher variability of the PR interval along the 10 s ECG was associated with increased AF risk. Noteworthy, increased prevalence of AF has been related to long QT interval.23 The relationship between long QT and AF might be explained by the fact that electrolytic disorders might produce both long QTc and an increased risk of AF.24 Interestingly, the thresholds of QTc interval reported in the Copenhagen ECG study25 and the study by Perez et al 22 (≥420 ms and >450 ms, respectively) are close to the value described here. All the ECG findings herein reported may be expression of structural heart disease or conduction abnormalities, as both are associated with ECG changes and AF development.
AF prevalence in the final cohort (3.2%) was comparable with the prevalence described in Spain,6 thus validating the representativeness of our sample. One of the major concerns about our results was the potential confounding effect of age, since prevalence is directly associated with increasing age5 and the SR–AF group was 16 years older than the SR–SR group. However, we found that the performance of models considering different age scenarios was worst than that of the main model. Besides, ECG biomarkers were similar, supporting the validity of ECGs.
The present work has several limitations. The cohort was recruited in a single hospital, but its demographic characteristics are similar to the general population.6 In addition, the cohort presented a group imbalance (lower number AF patients) which is inherent to this type of studies and was partially solved in the analysis carried out using scenarios involving age differences. Another concern is related to the automatic interpretation of AF. However, the exclusion criteria, the previously reported successful use of this algorithm,10 and the interpretation of randomly selected SR ECGs and all the AF ECGs made by experienced cardiologists provide sufficient confidence in the correctness of this procedure. The information provided by medical records were not considered in this study since it was inaccessible at this time. This is an issue on which we are working on to improve the discriminant power of our risk model.
We have found several biomarkers in SR ECGs that can be integrated in a score model able to predict the risk of developing AF, which would increase the cost-effectiveness of screening strategies for early detection of AF.
Key messages
What is already known on this subject?
Although some studies deal with the subject automatically predicting the appearance of new atrial fibrillation (AF) in patients with ECGs in sinus rhythm, none of them provide specific ECG features as predictors of developing AF.
What might this study add?
Our study provides a new score to identify populations at higher risk of developing AF based on the automatic ECG interpretation. In addition, the detected independent AF predictors could be explained by using rational evidence-based arguments.
How might this impact on clinical practice?
Identifying general population at higher risk of developing AF by using a 10 s 12-lead ECG recording would increase the cost-effectiveness of screening strategies for early detection of this pathology.
Data availability statement
No data are available.
Ethics statements
Patient consent for publication
Ethics approval
The Clinical Research Ethics Committee of Hospital de la Princesa approved this study with a waiver of obtaining informed consent from patients.
References
Supplementary materials
Supplementary Data
This web only file has been produced by the BMJ Publishing Group from an electronic file supplied by the author(s) and has not been edited for content.
Footnotes
AS-G and AC are joint first authors.
GJO and JJ-B are joint senior authors.
GJO and JJ-B contributed equally.
Contributors JJ-B conceived this study. GJO and AS carried out the numerical analysis, JMC collected, selected and provided XML files. JJ-B, AC, JMC and FA evaluated and interpreted numerical results and all ECGs. AS carried out the numerical analysis, performed all the statistical analysis and the literature search. All co-authors produced the initial draft of the manuscript and reviewed the final manuscript version. GJO and JJ-B are guarantors of this paper.
Funding Authors received a research grant from the Carlos III Institute of Health under the health strategy action 2020–2022 with reference PI20/00792.
Competing interests None declared.
Provenance and peer review Not commissioned; externally peer reviewed.
Supplemental material This content has been supplied by the author(s). It has not been vetted by BMJ Publishing Group Limited (BMJ) and may not have been peer-reviewed. Any opinions or recommendations discussed are solely those of the author(s) and are not endorsed by BMJ. BMJ disclaims all liability and responsibility arising from any reliance placed on the content. Where the content includes any translated material, BMJ does not warrant the accuracy and reliability of the translations (including but not limited to local regulations, clinical guidelines, terminology, drug names and drug dosages), and is not responsible for any error and/or omissions arising from translation and adaptation or otherwise.