Article Text

Abstract
Background Diagnosis of cardiac amyloidosis (CA) requires advanced imaging techniques. Typical surface ECG patterns have been described, but their diagnostic abilities are limited.
Objective The aim was to perform a thorough electrophysiological characterisation of patients with CA and derive an easy-to-use tool for diagnosis.
Methods We applied electrocardiographic imaging (ECGI) to acquire electroanatomical maps in patients with CA and controls. A machine learning approach was then used to decipher the complex data sets obtained and generate a surface ECG-based diagnostic tool.
Findings Areas of low voltage were localised in the basal inferior regions of both ventricles and the remaining right ventricular segments in CA. The earliest epicardial breakthrough of myocardial activation was visualised on the right ventricle. Potential maps revealed an accelerated and diffuse propagation pattern. We correlated the results from ECGI with 12-lead ECG recordings. Ventricular activation correlated best with R-peak timing in leads V1–V3. Epicardial voltage showed a strong positive correlation with R-peak amplitude in the inferior leads II, III and aVF. Respective surface ECG leads showed two characteristic patterns. Ten blinded cardiologists were asked to identify patients with CA by analysing 12-lead ECGs before and after training on the defined ECG patterns. Training led to significant improvements in the detection rate of CA, with an area under the curve of 0.69 before and 0.97 after training.
Interpretation Using a machine learning approach, an ECG-based tool was developed from detailed electroanatomical mapping of patients with CA. The ECG algorithm is simple and has proven helpful to suspect CA without the aid of advanced imaging modalities.
- electrocardiography
- cardiomyopathies
- heart failure
- diastolic
Data availability statement
All data relevant to the study are included in the article or uploaded as supplemental information.
This is an open access article distributed in accordance with the Creative Commons Attribution Non Commercial (CC BY-NC 4.0) license, which permits others to distribute, remix, adapt, build upon this work non-commercially, and license their derivative works on different terms, provided the original work is properly cited, appropriate credit is given, any changes made indicated, and the use is non-commercial. See: http://creativecommons.org/licenses/by-nc/4.0/.
Statistics from Altmetric.com
Introduction
Cardiac amyloidosis (CA) is a rapidly progressive form of cardiomyopathy with poor prognosis.1 2 Cardiac involvement arises from the deposition of insoluble fibrous material of misfolded precursor proteins in the heart.3 The typical clinical presentation includes signs and symptoms of heart failure (HF), complicated by rhythm disturbances that may occur years before the onset of HF.4 Despite emerging disease-modifying therapies, diagnosis is often delayed and requires advanced imaging techniques.5 Typical surface ECG patterns such as low voltage or pseudo-infarct patterns have been described, but their diagnostic abilities are rather limited and their role in clinical practice is currently negligible.6
Recently, electrocardiographic imaging (ECGI) has been developed as a non-invasive modality to study electrophysiological abnormalities, arrhythmogenic substrates and arrhythmias.7 Using ECGI, the aim of the present study was to obtain electrocardiographic maps of patients with CA. A machine learning approach was then used to decipher the complex data sets obtained by ECGI and helped to generate a simple surface ECG-based diagnostic algorithm for the detection of CA.
Methods
Study design
Detailed electrocardiographic maps were obtained using ECGI in 20 consecutive patients with transthyretin amyloidosis (ATTR)-CA in a non-invasive manner. Eleven patients with heart failure and preserved ejection fraction (HFpEF) served as controls (group 1). For ECG algorithm generation, electroanatomical maps generated from ECGI were correlated with ECG traces from 12-lead surface ECG recordings. Characteristic patterns of correlated leads were externally validated by comparing ECG trace representations from 30 consecutive patients with CA and 50 patients with other causes of HF, including 25 patients with hypertrophic cardiomyopathy (HCMP) and 25 patients with HFpEF (group 2). The algorithm was further validated in a blinded, randomised manner, with 10 independent cardiologists asked to classify clinical ECG tracings from group 2 as CA-negative or CA-positive before and after training on the proposed diagnostic algorithm. Finally, demographic and clinical characteristics were compared according to ECG patterns in 221 individual surface ECG readings from patients with amyloidosis (group 3). A graphical representation of the study is depicted in online supplemental figure S1.
Supplemental material
Patient and public involvement
Consecutive treatment-naïve patients with CA who had been registered in the amyloidosis outpatient clinic of the Medical University of Vienna were prospectively enrolled. Eligible patients were asked to participate in the study after the diagnosis of CA has been confirmed. The algorithm for diagnosis of ATTR and cardiac light-chain (AL) amyloidosis is provided in online supplemental appendix. All patients gave written informed consent. Data from control patients were available from a prospective registry that included patients with HCMP and HFpEF (EK #1278/2018).
Trial procedures
Electrocardiographic imaging
The mapping process involved the fitting of a multi-electrode vest to capture electrical signals from the body surface of study participants. Electrical signals from 250 electrodes were then combined with heart–torso anatomical data from non-contrast gated CT scans to construct biventricular three-dimensional electroanatomical maps using the CardioInsight software (Medtronic, Fridley, Minnesota, USA).
Electroanatomical maps were defined as previously described, based on the normalised electrogram (EGM) magnitudes in millivolts (mV), the activation pattern in milliseconds (ms) and potential changes over time in mV.8 9
Voltage maps were derived from the magnitude of the unipolar EGMs over the entire epicardium in a given patient. Based on the normalised magnitude of voltage, abnormalities were classified as electrical scar regions <30% of the maximal magnitude and dense electrical scar regions <15%.8 Activation maps captured the time of the steepest slope of each electrical potential measured on the cardiac surface. Activation time was determined by the maximal negative slope of the EGM during QRS and adjusted for heart rate. Potential maps displayed electrical potentials at all locations on the heart surface at any time within the map interval. A ciné of the map interval was generated to study potential changes over time.
Electroanatomical maps generated from three consecutive ventricular beats were then projected onto normalised and coregistered anatomical heart surface models (online supplemental appendix). By calculating mean value maps, we visualised differences in voltage, activation and potential maps between CA and controls.
Machine learning
Differences in the coregistered activation and voltage maps of patients with CA and controls were visualised using the uniform manifold approximation and projection.10 Data were z-scored prior to analyses. Moreover, we investigated region-specific differences in cardiac activity by using the segmented anatomical regions from the coregistered heart models and performed k-means clustering on activation and voltage map data. Due to the limited number of ECGI recordings and the goal to translate the results to surface ECG recordings, we used an unsupervised machine learning approach. The number of clusters was estimated using the gap statistics.11 Since the number of clusters in patients with CA and controls was known a priori, we assessed whether k-means clustering with one or two clusters optimised the gap criterion. Furthermore, we evaluated the agreement between the clusters identified with k-means and the observed patient categories. Anatomical regions that showed the highest agreement between predicted and observed patient clusters were considered the regions with the highest predictive power for identifying patients with CA. To detect differences in excitation propagation, we calculated the covariance of the coregistered mean potential maps.
ECG processing
ECG traces from 12-lead surface ECG recordings were correlated with ventricular electroanatomical maps, acquired with ECGI and predefined by 19 anatomical regions (online supplemental appendix). Timing from onsets of the QRS complexes to the R-wave peaks (R-peak timing) was correlated with the activation maps, and the amplitude of the R-peaks was correlated with voltage maps. Bonferroni-Holm correction was used to adjust for multiple testing.
Statistical analysis
Continuous data were presented as median and IQR and discrete data were presented as counts and percentages. For ECG algorithm generation an analysis of variance (ANOVA) with a Tukey’s range post-hoc test was used to compare R-peak timing and the amplitude of the R-peaks across patients with CA, HCMP and HFpEF. Non-normally distributed data were log-transformed and approximate normal distribution was visually assessed using histogram plots. Repeated measurements were analysed using repeated measures ANOVA (RM-ANOVA). For validation of the diagnostic algorithm, we calculated the sensitivity, specificity, accuracy and Fleiss’ kappa of the classification results. Furthermore, we approximated a receiver operating curve of the cardiologists’ binary ratings and treated the inter-rater variability as a discrimination threshold. Data processing and analyses were performed using Matlab V.2015(a) (MathWorks, Natick, Massachusetts, USA) and we performed factor analysis of mixed data in R V.4.0.2 (R Foundation for Statistical Computing, Vienna, Austria). Alpha was 0.05 and statistical testing was two-tailed.
Results
Patient characteristics
From June to September 2018, 20 patients with amyloidosis and 11 controls underwent ECGI. The clinical characteristics are summarised in table 1. At the time of recording, patients with transthyretin cardiac amyloidosis (ATTR-CA) had a median heart rate of 64 beats per minute. Half of the patients were in sinus rhythm. Of the patients, 40% had atrial fibrillation or flutter and two patients were pacemaker (PM)-dependent, in whom it was not possible to record an intrinsic signal during the application. Patients’ surface ECG showed low voltage with amplitudes <0.5 mV in limb leads in 20%, atrioventricular block in 35% with a median PQ interval of 201 ms (IQR: 190–228), and a ventricular conduction delay in 60% with a median QRS interval of 100 ms (IQR: 86–108; table 2).
Baseline demographic and clinical characteristics of patients with amyloidosis and controls fitted with ECGI
ECG characteristics of patients with amyloidosis fitted with ECGI (group 1) and the validation cohort (group 2)
Electrocardiographic imaging
Electroanatomical maps indicated that ventricles of patients with CA exhibited significantly lower voltage and faster activation time compared with controls (median voltage in mV: 2 (IQR 2–4) in CA vs 4 (IQR 2–5) in controls; median activation time in ms: 53 (IQR 36–72) in CA vs 72 (IQR 63–89) in controls, p<0.001, RM-ANOVA).
Detailed examination of the ventricular voltage maps provided further information. Principal component analysis (PCA) showed two different clusters between CA and controls. Mean anatomically segmented voltage maps of CA displayed the lowest voltage in the right ventricular and left ventricular inferobasal regions (figure 1 and online supplemental figure S2). Electrical scar region was localised in the basal inferior regions of both ventricles and in the remaining right ventricular segments. Predefined areas of electrical scarring below the 30th and 15th percentile of the maximum amplitude revealed significantly lower voltage values in patients with CA compared with controls (mean voltage of areas ≤30%: 1.18±0.54 in CA vs 2.00±0.76 in controls, corrected p<0.001; mean voltage of areas ≤15%: 0.95±0.54 in CA vs 2.00±0.76 in controls, p<0.001, both RM-ANOVA). The spatial distribution of electrical scar tissue showed a greater extent of low voltage in almost all segments of patients with CA, with particularly affected areas in the basal, inferior and right ventricular segments.

Mean ventricular voltage maps generated from electrogram magnitudes in CA (A) and controls (B) indicate an increased deposition of amyloid in the basal inferior regions of both ventricles and the remaining right ventricular segments in CA. Electrical scar tissue was defined as the maximum amplitude below the 30th percentile of the measured maximum voltage (C) and dense electrical scar tissue below the 15th percentile (D), with significantly lower mean voltage values in patients with CA compared with controls. The spatial distribution of electrical scar tissue between cardiac models of patients with CA (E) and controls (F) shows a greater extent of low voltage in almost all segments of patients with CA, with particularly affected areas in the basal, inferior and right ventricular segments. ANOVA, analysis of variance; CA, cardiac amyloidosis; RV, right ventricle; RVOT, right ventricular outflow tract.
The earliest epicardial breakthrough of the myocardial activation was visualised on the right ventricle in CA (figure 2). PCA of mean activation maps identified two distinct clusters as well as characteristic outliers being either bifascicular blocks with right bundle branch block (RBBB) and left anterior fascicular block (LAFB) or PM. Outliers were excluded from further analysis.

Mean ventricular activation maps (normalised to heart rate) from CA (A) and controls (B) reveal an early epicardial breakthrough of the extraction on the right ventricle in CA. PCA of the activation maps from three consecutive ventricular beats of CA and controls identifies two distinct clusters and characteristic outliers had bifascicular blocks (left anterior fascicular block and right bundle branch block) or pacemakers (C). Cluster centroid distances of region-specific PCA with respect to activation patterns in CA and controls show the greatest cluster differences in the basal regions of both ventricles, the left mid-anterolateral segment of the left ventricle and the remaining right ventricular regions (D). AF, atrial fibrillation; bpm, beats per minute; CA, cardiac amyloidosis; LAFB, left anterior fascicular block; ms, miliseconds; PCA, principal component analysis; PM, pacemaker; RBBB, right bundle branch block; RV, right ventricle; RVOT, right ventricular outflow tract.
Region-specific PCA revealed significant variability between the activation patterns of CA and controls. Greatest cluster differences could be found in the basal regions of both ventricles, the left mid-anterolateral segment of the left ventricle and the remaining right ventricular regions.
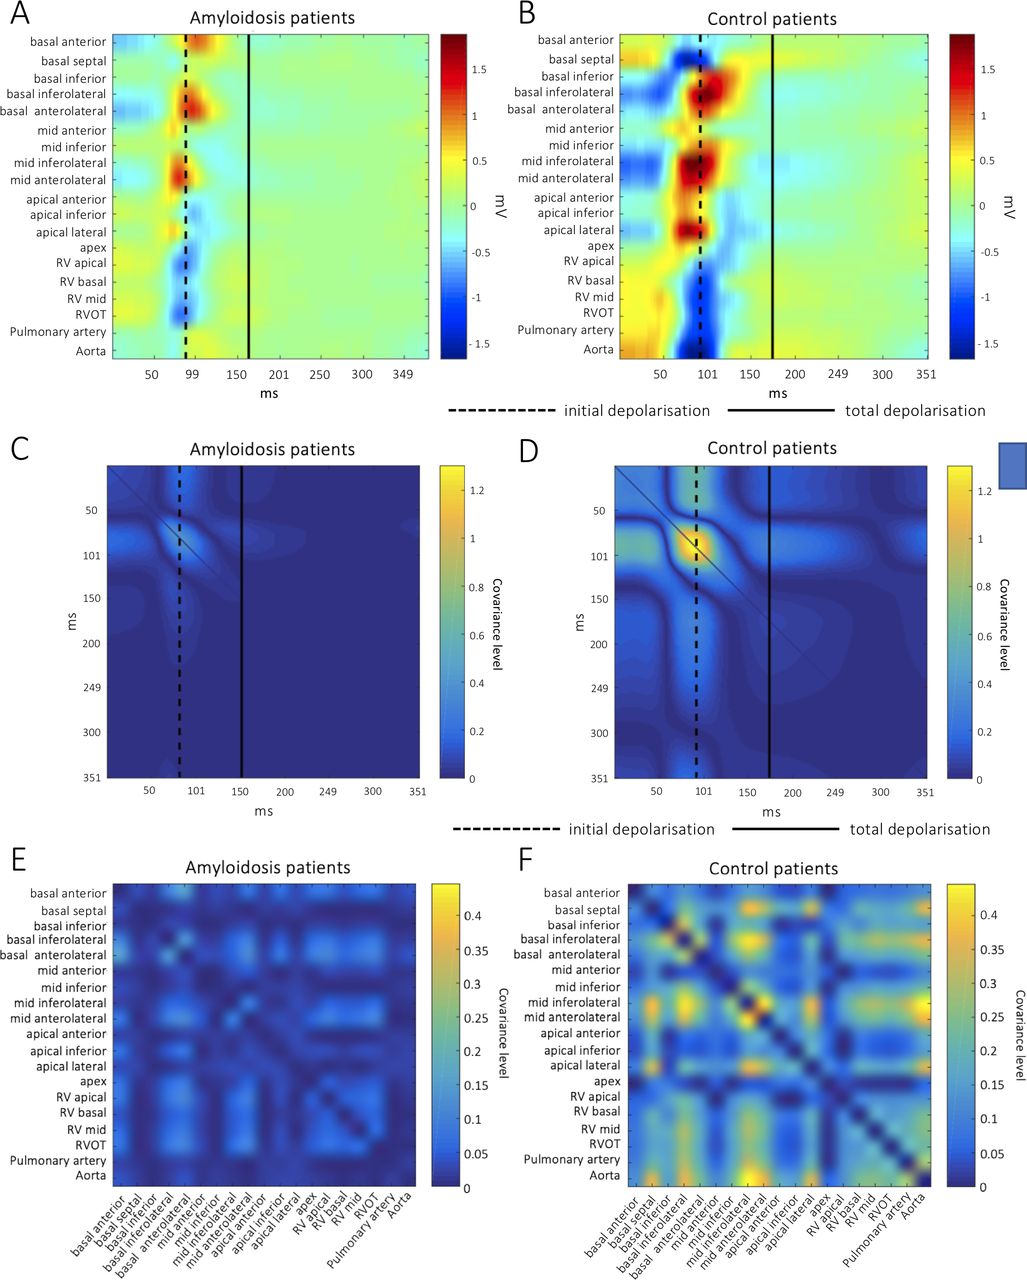
Ventricular propagation of mean potential maps confirmed a faster depolarisation in CA compared with controls (depolarisation time: 88 ms in CA vs 95 ms in controls, p<0.001; figure 3). Calculated covariance indicated a disordered excitation sequence in patients with CA (level of covariance at the time of depolarisation: 0.3 in CA and 1.3 in controls, p<0.001, RM-ANOVA; figure 3). The clear correlation of segments connected by the excitation sequence in the functional connectivity analysis of controls was lost in CA, suggesting a rather diffuse propagation pattern.

Mean ventricular potential maps. QRS potential propagation according to anatomical regions in patients with CA (A) and controls (B) reveals a faster depolarisation in CA. The rarefied colour spectrum in A is explained by the lower voltage in CA compared with controls. As compared with CA (C), calculated covariance shows a distinct peak (yellow colour) at the time of depolarisation in controls (D), indicating a disordered excitation sequence in CA. In contrast to CA (E), functional connectivity within all annotated anatomical regions in controls (F) indicates a clear correlation of segments connected by the excitation sequence. In CA, this correlation is lost and indicates a rather diffuse propagation pattern. CA, cardiac amyloidosis; RV, right ventricle; RVOT, right ventricular outflow tract.
ECG algorithm
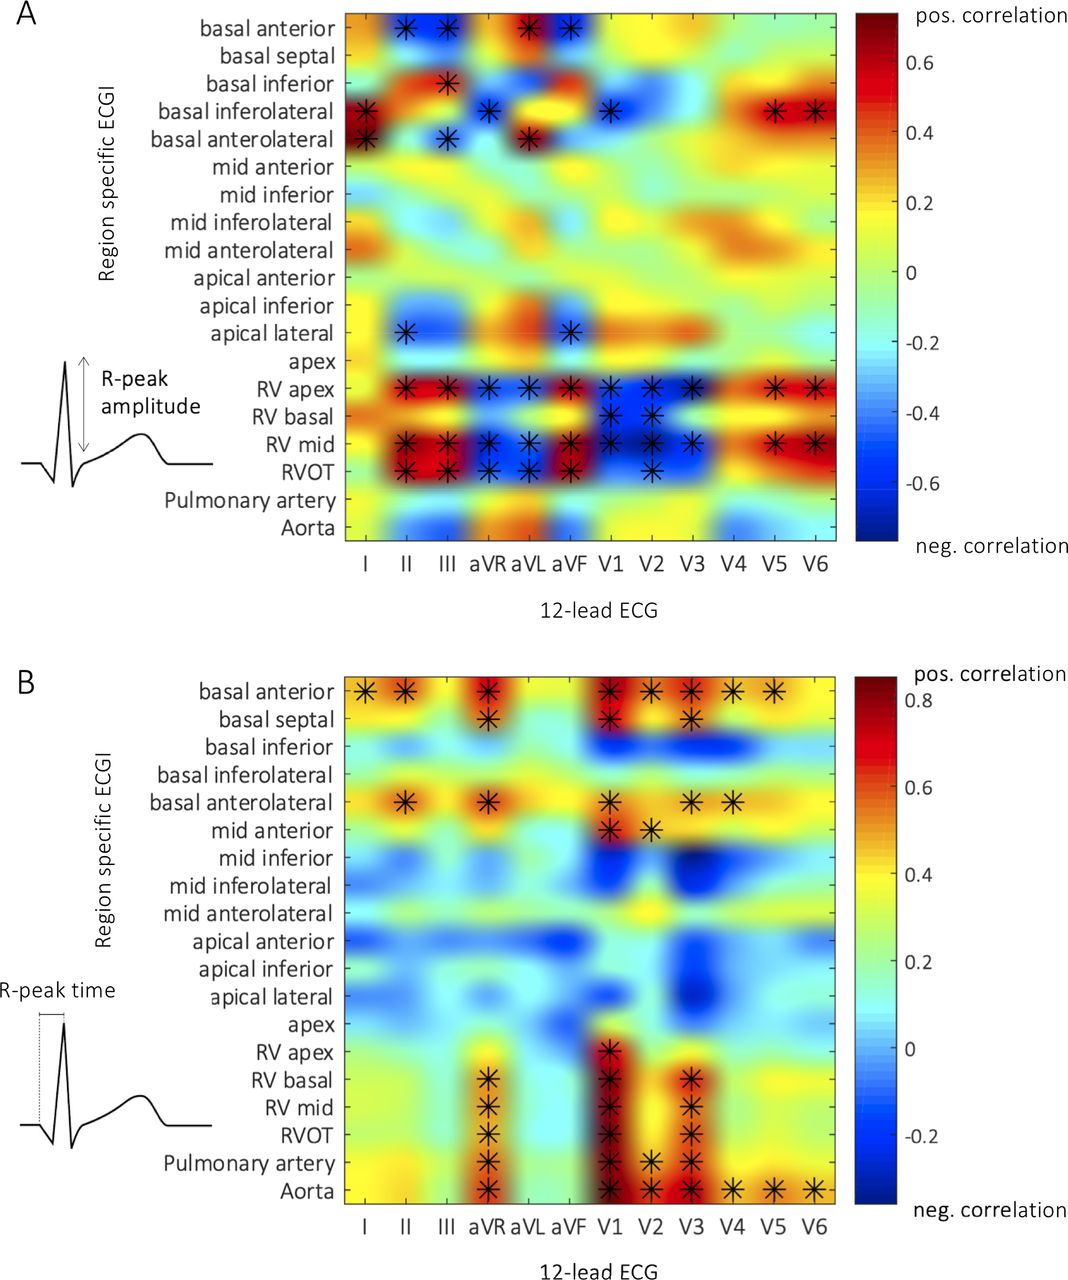
In the next step, we correlated the results obtained by ECGI with routine 12-lead surface ECG recordings of group 1. Epicardial voltage showed a strong positive correlation with R-peak amplitude in the inferior leads II, III and augmented voltage foot (aVF) and a negative correlation in leads V1 and V2. Ventricular activation correlated best with R-peak timing in leads V1–V3 (figure 4).

Correlation between ECGI and 12-lead ECG in CA. (A) Correlation of R-peak amplitude from the mean surface ECG with the mean ventricular voltage map from ECGI generated from patients with CA. Asterisks indicate a significant positive (red) or negative (blue) correlation, with a strong positive correlation in inferior leads II and III and a strong negative correlation in V1 and V2. (B) Correlation of R-peak timing from 12-lead ECG with the mean ventricular activation map from ECGI of patients with CA with best correlation seen in surface ECG leads V1–V3. aVR, augmented voltage right; aVL, augmented voltage left; aVF, augmented voltage foot; CA, cardiac amyloidosis; ECGI, electrocardiographic imaging;; RV, right ventricle; RVOT, right ventricular outflow tract.
Comparison of mean ECG trace representations of individual ECGs from 30 consecutive patients with CA, 25 patients with HCMP and 25 patients with HFpEF of group 2 revealed significant differences in the respective leads of R-peak timing and amplitude (online supplemental figure S3).
Surface ECG leads from patients with CA showed two characteristic patterns that are visually perceptible using the following algorithm (figure 5): in the first step V1–V3 have to be interpreted. In case of delayed R progression, leads II, III and aVF should be checked for reduced voltage less than or equal to 1 mV. The presence of both criteria corresponds to pattern 1 (online supplemental figure S4) and should be followed by guideline-conforming diagnostic work-up. In the absence of pattern 1, the presence of pattern 2 should be checked, characterised by a bifascicular block, that is, RBBB, in V1 and V2 and negative concordance in the inferior leads (online supplemental figure S5).

Surface ECG criteria for detection of CA. Surface ECG leads from patients with CA show two alternative patterns commonly found in CA, providing a simple stepwise approach for ECG interpretation (A). The first step should include interpretation of V1–V3. In case of a delay in R progression, leads II, III and aVF should be checked for a reduced voltage. If both criteria are present, this corresponds to pattern 1. Alternatively, if a right bundle branch block is present in V1 and V2, inferior leads should be checked for negative concordance, resulting in pattern 2. Mean ECG representations (light blue indicates SD) of the two ECG patterns (B). aVF, augmented voltage foot; aVL, augmented voltage left; aVR, augmented voltage right; CA, cardiac amyloidosis.
In the final set of experiments, 10 cardiologists with long-standing experience in CA management were asked to identify patients with CA by analysing 12-lead ECGs from group 2 (30 CA and 50 controls with other types of HF), before and after training on the defined diagnostic algorithm. The training resulted in significant improvements in the detection rate of CA with an area under the curve of 0.69 before and 0.97 after training (naïve vs trained cardiologists: sensitivity: 0.32±0.19 vs 0.89±0.08, p<0.001; specificity: 0.80±0.09 vs 0.96±0.01, p<0.01; Fleiss’ kappa: −0.01, p=0.71 vs −0.87, p<0.001; online supplemental figure S6).
Specific ECG patterns and clinical characteristics
Surface ECGs from 221 patients with CA (group 3) participating in our registry displayed pattern 1 in 63% and pattern 2 in 19% of cases. The remaining 18% displayed none of the two patterns, of which 38% had a PM ECG. All ECGs without a typical combination pattern showed at least one of the subcriteria, such as lack of R progression, RBBB or LAFB.
Pattern 1 was found to be more common in AL amyloidosis, while pattern 2 was more common in ATTR-CA (pattern 1: 78% of AL vs 58% of ATTR, p=0.009; pattern 2: 7% of AL vs 23% of ATTR, p=0.006; no pattern: 16% of AL vs 18% of ATTR, p=0.620). A detailed analysis of the clinical parameters showed that patients with pattern 1 were younger than those with pattern 2 and those without a specific pattern (table 3). Compared with patients with pattern 1, patients with pattern 2 showed a trend towards higher New York Heart Association classes. Comparison of ECG features between ATTR and AL-CA showed that both entities were equally likely to have low voltages. Differences were seen in conduction delays, which occurred much more frequently in ATTR-CA (online supplemental table S1).
Demographic and clinical characteristics according to ECG patterns in 221 surface ECG readings from patients with amyloidosis
Discussion
We developed a simple ECG-based CA detection tool and proved the concept that it is helpful in raising the suspicion of CA without the aid of advanced imaging modalities. Beyond established knowledge on typical ECG alterations in CA, (1) we could provide a pathophysiological background for surface ECG findings in CA; (2) by machine learning we were able to develop an algorithm for more systematic ECG screening; and (3) we could refine previously used ECG criteria, for example, by scaling up the threshold for voltage from 0.5 mV to 1 mV.
Once considered a rare disease, it is now evident that the prevalence of CA is much higher than previously anticipated.12 13 Given a whole new spectrum of medical therapies that can halt the progression of CA, there is an urgent need for simplified non-invasive diagnostic modalities to provide evidence of the presence of the disease.14–16
The presence of a low voltage electrocardiographic pattern, despite increased left ventricular wall thickness, is highly suggestive of CA and can differentiate CA from hypertensive or hypertrophic cardiomyopathy.17 However, only 25%–40% of patients with ATTR-CA meet the low voltage criteria and might even fulfil the criteria for left ventricular hypertrophy.18 The exact reasons for the low voltage ECG are not known. In AL amyloidosis, myocyte atrophy and cardiac toxicity due to circulating light chains are possible contributing factors.6 In patients with ATTR-CA, correlations between low voltage and the presence of pericardial effusion were previously made,19 which could not be confirmed in our analyses. Mean voltage was significantly lower in patients with CA and correlation of 12-lead ECG with the mean ventricular voltage map revealed a strong positive correlation in inferior leads II, III and aVF. ECG tracings from patients with CA revealed that median voltage was low in inferior leads, but did not necessarily meet the low voltage threshold below 0.5 mV but rather below 1 mV.
By using non-invasive methods, it has become possible to perform detailed electrophysiological studies in patients with CA, which contribute to a better understanding of the pathophysiological changes that cause the various ECG changes. Abnormal voltage areas seen in the basal inferior regions of both ventricles and the remaining right ventricular segments may indicate increased amyloid deposition in these regions. Early amyloid deposition in the right ventricle has been described in cardiac magnetic resonacestudies, but for technical and anatomical reasons assessment of gadolinium enhancement is very difficult in this site.20 Our study could provide more insight into the pathogenesis of amyloid deposition in the heart, but this needs to be confirmed, in particular by histopathological studies.
The lack of R progression or often referred to as pseudo-infarction pattern in the anterior precordial leads was reported in descriptive studies in more than half of the affected patients.21 Nevertheless, both low ECG voltage and pseudo-infarct pattern are only present in about 25% of cases.19 As an electrophysiological correlate for the steep deflection in V1–V3, our mean ventricular activation maps revealed an early epicardial excitation breakthrough on the right ventricle. The infiltration of the right ventricular conduction system and its surrounding myocardium is likely to be the responsible substrate for early excitation breakthrough. Another rather unexpected finding was the faster depolarisation in patients with CA, which is most likely due to the earlier excitation breakthrough and the disordered excitation sequence.
PCA of the activation maps identified a group of outliers. After detailed analysis, outlier patients had either RBBB together with an LAFB or a PM ECG. Because the number of outliers without PM was relatively high (n=3), they were defined as pattern 2. Advanced infiltration of the right ventricle is more likely to lead to complete blockade of the right bundle, and similarly infiltration of the left ventricle may lead to LAFB. It is not surprising that pattern 2 was observed more frequently in patients with ATTR than with AL-CA because patients with AL-CA did not survive long enough to show characteristics of this pattern.
In summary, we propose here a simple ECG-based algorithm to raise the suspicion of CA irrespective of its aetiology. Clinical validation is underway to test whether our tool can contribute to meaningful improvement in the management of patients with HF by identifying those with CA-based disease.
Limitations
Our study is not free of limitations. First, the sample size of patients mapped with ECGI is rather small; nevertheless it is comparable with the number of patients in other publications using the same method.8 9 22 Furthermore, the group consists of consecutively recruited patients who were characterised very precisely and correspond to other typical amyloidosis cohorts.16 23 24 Second, the number of ECGI controls was not balanced to the CA cohort. However, the comparison group consisted of patients with a common differential diagnosis of CA. Third, the application of the proposed ECG algorithm was based on the interrogation of trained cardiologists, and some variation due to subjective interpretations cannot be completely excluded.
Conclusion
We have developed a simple ECG-based CA detection tool and proved the concept that it is helpful in raising the suspicion of CA without the aid of advanced imaging modalities. Ongoing studies will validate its usefulness in clinical practice.
Key messages
What is already known on this subject?
Despite new therapies, diagnosis of cardiac amyloidosis is often delayed.
Typical surface ECG patterns have been described, but their role in clinical practice is negligible.
What might this study add?
We have developed an easy-to-use ECG-based method that can provide an initial suspicion of cardiac amyloidosis.
How might this impact on clinical practice?
Our tool may significantly improve the treatment of patients with heart failure by identifying those with amyloidosis-related disease.
Data availability statement
All data relevant to the study are included in the article or uploaded as supplemental information.
Ethics statements
Patient consent for publication
Ethics approval
The study was part of a registry approved by the local ethics committee (EK #796/2010) and conducted according to good clinical practice as outlined in the Declaration of Helsinki.
References
Supplementary materials
Supplementary Data
This web only file has been produced by the BMJ Publishing Group from an electronic file supplied by the author(s) and has not been edited for content.
Footnotes
Contributors LS: conceptualisation, formal analysis, methodology, data curation, funding acquisition, project administration, investigation, resources, software, visualisation, writing - original draft. PA: formal analysis, methodology, software, validation, visualisation, writing - review and editing. AA: formal analysis, methodology, writing - review and editing. BS, FDus: investigation, validation, visualisation, writing - review and editing. RR, FDuc, DD, T-MD, CB: data curation, investigation, validation, writing - review and editing. RB-E: validation, investigation, writing - review and editing. JK: supervision, resources, writing - review and editing. DBe, CL: resources, software, writing - review and editing. CH, GL: funding acquisition, resources, writing - review and editing. GS: methodology, resources, software, validation, writing - review and editing. GD: methodology, resources, software, supervision, writing - review and editing. DBo: conceptualisation, methodology, data curation, funding acquisition, supervision, visualisation, writing - original draft,
guarantor.
Funding The authors have not declared a specific grant for this research from any funding agency in the public, commercial or not-for-profit sectors.
Competing interests None declared.
Provenance and peer review Not commissioned; internally peer reviewed.
Supplemental material This content has been supplied by the author(s). It has not been vetted by BMJ Publishing Group Limited (BMJ) and may not have been peer-reviewed. Any opinions or recommendations discussed are solely those of the author(s) and are not endorsed by BMJ. BMJ disclaims all liability and responsibility arising from any reliance placed on the content. Where the content includes any translated material, BMJ does not warrant the accuracy and reliability of the translations (including but not limited to local regulations, clinical guidelines, terminology, drug names and drug dosages), and is not responsible for any error and/or omissions arising from translation and adaptation or otherwise.